

Key Insights
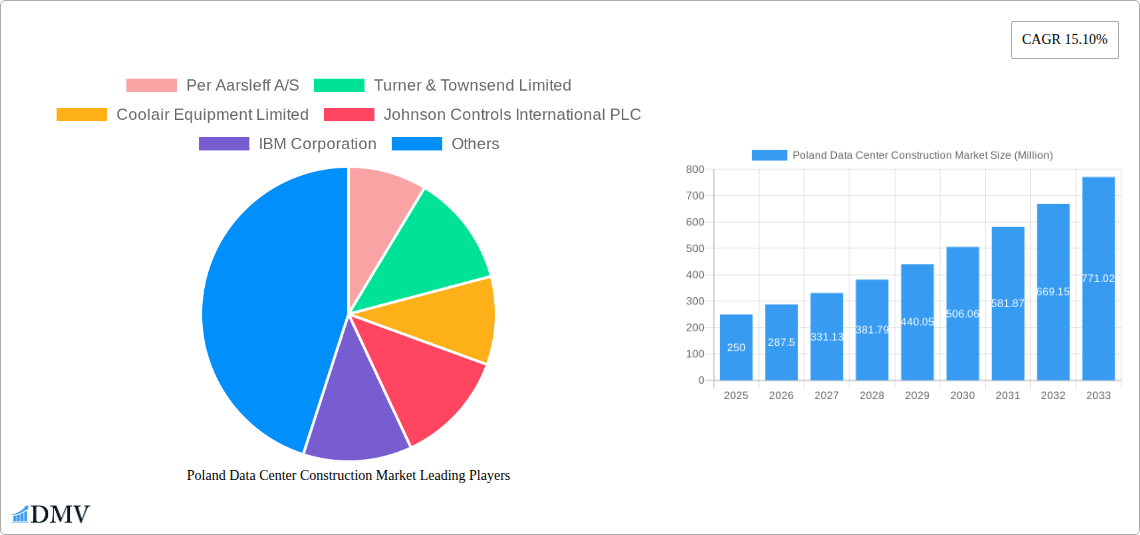
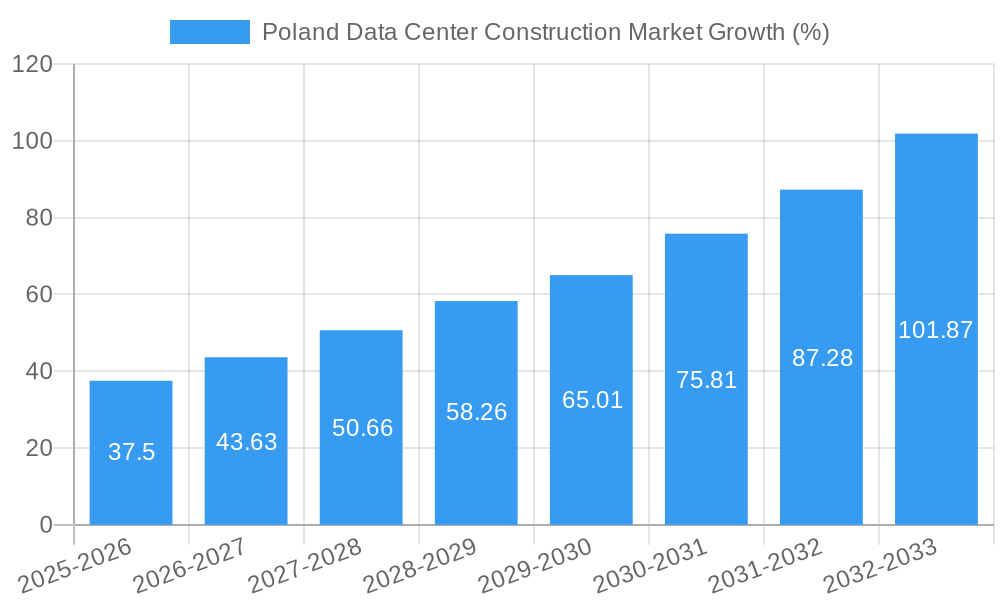
The Poland data center construction market is experiencing robust growth, fueled by increasing digitalization, cloud adoption, and government initiatives promoting digital infrastructure development. The market's Compound Annual Growth Rate (CAGR) of 15.10% from 2019-2024 suggests a significant expansion, projected to continue in the forecast period (2025-2033). Key drivers include the rising demand for colocation services, the expansion of 5G networks, and the growing need for robust data storage and processing capabilities across various sectors, notably IT & Telecommunications, BFSI (Banking, Financial Services, and Insurance), and the Government. The market is segmented by tier type (Tier 1, Tier 2, Tier 3, etc.), data center size (small, medium, large, mega, massive), and infrastructure components (cooling, power, racks, security, etc.). While the exact market size for 2025 is unavailable, extrapolating from the CAGR and considering similar markets, a reasonable estimate would place it in the hundreds of millions of Euros. This growth is further supported by the involvement of major international and local players such as Schneider Electric, IBM, and Arup Group, indicating significant investment and confidence in the Polish market.
The market's growth is not without challenges. Potential restraints could include the availability of skilled labor, land acquisition complexities, and regulatory hurdles. However, the strong underlying drivers are expected to outweigh these constraints. The increasing adoption of sustainable practices, including efficient cooling technologies like evaporative cooling, is also shaping the market. This trend reflects a growing awareness of environmental concerns and a push for energy-efficient data center operations. Further segmentation by end-user indicates strong demand from IT & Telecommunications, as expected, but substantial growth is also anticipated from the BFSI and Government sectors, driving the need for secure and reliable data center infrastructure. The involvement of major construction and engineering firms like Per Aarsleff and Bouygues Construction underscores the scale and complexity of projects within this expanding market.
Poland Data Center Construction Market: A Comprehensive Report (2019-2033)
This insightful report provides a detailed analysis of the Poland data center construction market, covering the period 2019-2033, with a focus on the year 2025. It offers a comprehensive overview of market size, segmentation, key players, growth drivers, and challenges, enabling stakeholders to make informed decisions and capitalize on emerging opportunities. The report utilizes a robust methodology incorporating historical data (2019-2024), the base year (2025), and a forecast period (2025-2033). It delves into the dynamics of the market, forecasting substantial growth fueled by increasing digitalization and government initiatives.
Poland Data Center Construction Market Composition & Trends
The Poland data center construction market exhibits a moderately concentrated landscape, with a few major players holding significant market share. The market share distribution amongst the top 5 players is estimated at 60% in 2025, with the remaining share distributed across numerous smaller companies. Innovation in cooling technologies, such as liquid cooling and AI-driven optimization, are driving market expansion. The regulatory environment is largely supportive, with government incentives encouraging data center development. However, substitute products, such as cloud computing, exert some competitive pressure. M&A activities have been moderate, with total deal values estimated at xx Million in 2024. End-users are primarily from IT & Telecommunication, BFSI, and Government sectors.
- Market Concentration: Moderately concentrated, with top 5 players holding 60% market share in 2025.
- Innovation Catalysts: Liquid cooling, AI-driven optimization.
- Regulatory Landscape: Supportive, with government incentives.
- Substitute Products: Cloud computing.
- M&A Activity (2024): xx Million
- End-User Profile: IT & Telecommunication, BFSI, Government dominate.
Poland Data Center Construction Market Industry Evolution
The Poland data center construction market has experienced significant growth, driven by increasing data consumption, digital transformation initiatives across various sectors, and government support for digital infrastructure development. The market grew at a CAGR of xx% from 2019 to 2024 and is projected to grow at a CAGR of xx% from 2025 to 2033, reaching a market value of xx Million by 2033. This growth is fueled by technological advancements in areas such as virtualization, edge computing, and higher power density solutions. Consumer demands are shifting towards higher reliability, scalability, and energy efficiency in data center facilities. The adoption rate of advanced cooling technologies like evaporative cooling is projected to increase significantly in the forecast period. The rise of hyperscale data centers is also contributing to the growth trajectory.
Leading Regions, Countries, or Segments in Poland Data Center Construction Market
The Warsaw metropolitan area dominates the Poland data center construction market, driven by significant IT & Telecommunication sector concentration and better infrastructure availability. Tier III and Tier IV data centers are experiencing the highest growth due to their higher capacity and resilience. Large and Mega data centers are the fastest-growing segments, fueled by hyperscale deployments. Power infrastructure and cooling infrastructure represent the largest segments within infrastructure spending, with a combined market share exceeding 60%.
- Key Drivers (Warsaw): Strong IT sector, robust infrastructure, government initiatives.
- Key Drivers (Tier III/IV): Higher capacity, resilience, and security.
- Key Drivers (Large/Mega Data Centers): Hyperscale deployments, growing data demand.
- Dominant Infrastructure Segments: Power & Cooling Infrastructure.
Poland Data Center Construction Market Product Innovations
Recent innovations include the deployment of more energy-efficient cooling systems, such as liquid cooling and free-air cooling, aiming to reduce operational costs and environmental impact. Advancements in power distribution units (PDUs) have improved energy efficiency and power management. Improved physical security measures incorporate advanced surveillance technologies and access control systems. These innovations provide better performance metrics in terms of energy efficiency, uptime, and security compared to older technologies.
Propelling Factors for Poland Data Center Construction Market Growth
The Polish data center market is experiencing significant growth driven by factors including: increasing digitalization across various sectors; government initiatives to support digital infrastructure development; growing demand for cloud services; and foreign investments in data center infrastructure. The rising adoption of 5G technology and the expansion of the Internet of Things (IoT) further fuel this growth.
Obstacles in the Poland Data Center Construction Market
Challenges include securing sufficient land for large-scale data center development in strategic locations; potential skills gaps in the workforce; and the need for further development of the energy grid to support the growing energy demand from data centers. Supply chain disruptions, particularly for specialized components, have led to project delays and increased costs (estimated at xx Million in lost revenue in 2024). Competition from established international players also poses a challenge.
Future Opportunities in Poland Data Center Construction Market
Future opportunities lie in the expansion of edge data centers to improve latency, the adoption of sustainable and green data center solutions, and investments in advanced security technologies. Growth in areas like AI and machine learning will create demand for higher capacity data center facilities. The expansion into smaller cities and regions to accommodate geographically distributed services offers potential for growth.
Major Players in the Poland Data Center Construction Market Ecosystem
- Per Aarsleff A/S
- Turner & Townsend Limited
- Coolair Equipment Limited
- Johnson Controls International PLC
- IBM Corporation
- Legrand SA
- Bouygues Construction SA
- ALFA LAVAL AB
- Schneider Electric SE
- STULZ GmbH
- DPR CONSTRUCTION INC
- Arup Group Limited
- Kirby Group Engineering
- AECOM
- Coromatic AB Sweden
Key Developments in Poland Data Center Construction Market Industry
- December 2022: Atman purchased a 5.5-hectare site in Duchnice to build Atman Data Center Warsaw-3, scheduled to open in Q4 2024 with a 43 MW IT capacity.
- August 2022: Atman Data Center Warsaw-1 expanded with the F7 building (7.2 MW capacity), commissioning new server rooms (2,916 sq. m) in February 2024.
Strategic Poland Data Center Construction Market Forecast
The Poland data center construction market is poised for continued strong growth, driven by sustained digital transformation, increasing cloud adoption, and government support. The market's robust fundamentals and significant investments indicate a positive outlook, with substantial opportunities for both established players and new entrants. This growth will be fueled by innovations in cooling technologies, increased energy efficiency, and a focus on sustainable practices. The Warsaw region is expected to remain the dominant market, but growth in other areas is also anticipated.
Poland Data Center Construction Market Segmentation
-
1. Infrastructure
-
1.1. Market Segmentation - By Electrical Infrastructure
-
1.1.1. Power Distribution Solution
- 1.1.1.1. PDUs - B
-
1.1.1.2. Transfer Switches
- 1.1.1.2.1. Static
- 1.1.1.2.2. Automatic (ATS)
-
1.1.1.3. Switchgear
- 1.1.1.3.1. Low-voltage
- 1.1.1.3.2. Medium-voltage
- 1.1.1.4. Power Panels and Components
- 1.1.1.5. Others
-
1.1.2. Power Backup Solutions
- 1.1.2.1. UPS
- 1.1.2.2. Generators
- 1.1.3. Service
-
1.1.1. Power Distribution Solution
-
1.2. Market Segmentation - By Mechanical Infrastructure
-
1.2.1. Cooling Systems
- 1.2.1.1. Immersion Cooling
- 1.2.1.2. Direct-to-chip Cooling
- 1.2.1.3. Rear Door Heat Exchanger
- 1.2.1.4. In-row and In-rack Cooling
- 1.2.1.5. Other Mechanical Infrastructures
- 1.2.2. Racks
-
1.2.1. Cooling Systems
-
1.1. Market Segmentation - By Electrical Infrastructure
-
2. Electrical Infrastructure
-
2.1. Power Distribution Solution
- 2.1.1. PDUs - B
-
2.1.2. Transfer Switches
- 2.1.2.1. Static
- 2.1.2.2. Automatic (ATS)
-
2.1.3. Switchgear
- 2.1.3.1. Low-voltage
- 2.1.3.2. Medium-voltage
- 2.1.4. Power Panels and Components
- 2.1.5. Others
-
2.2. Power Backup Solutions
- 2.2.1. UPS
- 2.2.2. Generators
- 2.3. Service
-
2.1. Power Distribution Solution
-
3. Power Distribution Solution
- 3.1. PDUs - B
-
3.2. Transfer Switches
- 3.2.1. Static
- 3.2.2. Automatic (ATS)
-
3.3. Switchgear
- 3.3.1. Low-voltage
- 3.3.2. Medium-voltage
- 3.4. Power Panels and Components
- 3.5. Others
-
4. Power Backup Solutions
- 4.1. UPS
- 4.2. Generators
- 5. Service
-
6. Mechanical Infrastructure
-
6.1. Cooling Systems
- 6.1.1. Immersion Cooling
- 6.1.2. Direct-to-chip Cooling
- 6.1.3. Rear Door Heat Exchanger
- 6.1.4. In-row and In-rack Cooling
- 6.1.5. Other Mechanical Infrastructures
- 6.2. Racks
-
6.1. Cooling Systems
-
7. Cooling Systems
- 7.1. Immersion Cooling
- 7.2. Direct-to-chip Cooling
- 7.3. Rear Door Heat Exchanger
- 7.4. In-row and In-rack Cooling
- 7.5. Other Mechanical Infrastructures
- 8. Racks
- 9. Other Mechanical Infrastructures
-
10. Tier Type
- 10.1. Tier-I and-II
- 10.2. Tier-III
- 10.3. Tier-IV
- 11. Tier-I and-II
- 12. Tier-III
- 13. Tier-IV
-
14. End User
- 14.1. Banking, Financial Services, and Insurance
- 14.2. IT and Telecommunications
- 14.3. Government and Defense
- 14.4. Healthcare
- 14.5. Other End Users
- 15. Banking, Financial Services, and Insurance
- 16. IT and Telecommunications
- 17. Government and Defense
- 18. Healthcare
- 19. Other End Users
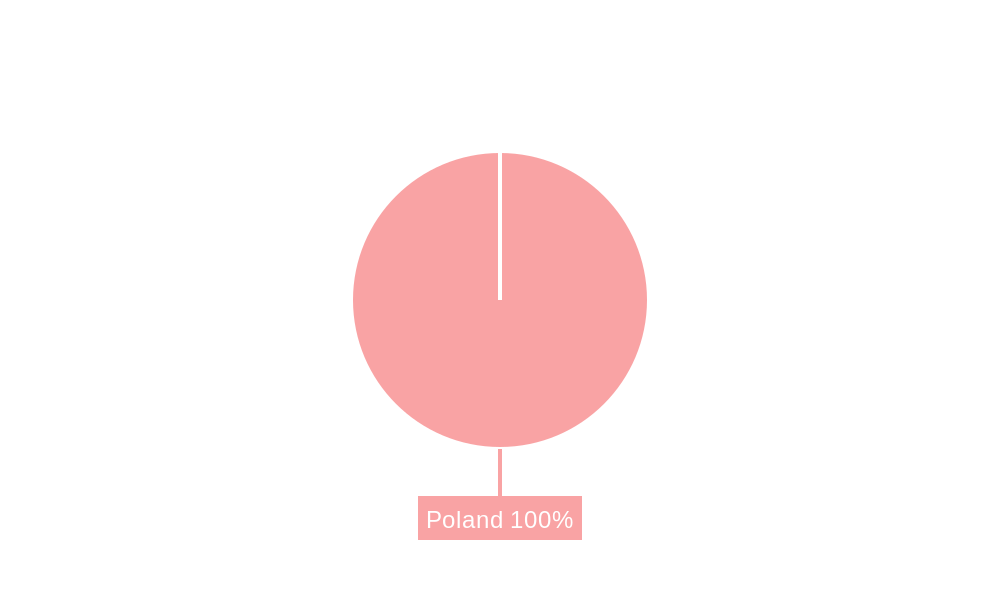
Poland Data Center Construction Market Segmentation By Geography
- 1. Poland
Poland Data Center Construction Market REPORT HIGHLIGHTS
| Aspects | Details |
|---|---|
| Study Period | 2019-2033 |
| Base Year | 2024 |
| Estimated Year | 2025 |
| Forecast Period | 2025-2033 |
| Historical Period | 2019-2024 |
| Growth Rate | CAGR of 15.10% from 2019-2033 |
| Segmentation |
|
Table of Contents
- 1. Introduction
- 1.1. Research Scope
- 1.2. Market Segmentation
- 1.3. Research Methodology
- 1.4. Definitions and Assumptions
- 2. Executive Summary
- 2.1. Introduction
- 3. Market Dynamics
- 3.1. Introduction
- 3.2. Market Drivers
- 3.2.1. 5G Developments Fuelling Data Center Investments; Growing Cloud Servce adoption; Green Data Centers rising awarness of Carbon-Neutrality leading to Infrastructure upgrades
- 3.3. Market Restrains
- 3.3.1. Security Challenges Impacting Growth of Data Centers
- 3.4. Market Trends
- 3.4.1. IT and Telecom to have significant market share
- 4. Market Factor Analysis
- 4.1. Porters Five Forces
- 4.2. Supply/Value Chain
- 4.3. PESTEL analysis
- 4.4. Market Entropy
- 4.5. Patent/Trademark Analysis
- 5. Poland Data Center Construction Market Analysis, Insights and Forecast, 2019-2031
- 5.1. Market Analysis, Insights and Forecast - by Infrastructure
- 5.1.1. Market Segmentation - By Electrical Infrastructure
- 5.1.1.1. Power Distribution Solution
- 5.1.1.1.1. PDUs - B
- 5.1.1.1.2. Transfer Switches
- 5.1.1.1.2.1. Static
- 5.1.1.1.2.2. Automatic (ATS)
- 5.1.1.1.3. Switchgear
- 5.1.1.1.3.1. Low-voltage
- 5.1.1.1.3.2. Medium-voltage
- 5.1.1.1.4. Power Panels and Components
- 5.1.1.1.5. Others
- 5.1.1.2. Power Backup Solutions
- 5.1.1.2.1. UPS
- 5.1.1.2.2. Generators
- 5.1.1.3. Service
- 5.1.1.1. Power Distribution Solution
- 5.1.2. Market Segmentation - By Mechanical Infrastructure
- 5.1.2.1. Cooling Systems
- 5.1.2.1.1. Immersion Cooling
- 5.1.2.1.2. Direct-to-chip Cooling
- 5.1.2.1.3. Rear Door Heat Exchanger
- 5.1.2.1.4. In-row and In-rack Cooling
- 5.1.2.1.5. Other Mechanical Infrastructures
- 5.1.2.2. Racks
- 5.1.2.1. Cooling Systems
- 5.1.1. Market Segmentation - By Electrical Infrastructure
- 5.2. Market Analysis, Insights and Forecast - by Electrical Infrastructure
- 5.2.1. Power Distribution Solution
- 5.2.1.1. PDUs - B
- 5.2.1.2. Transfer Switches
- 5.2.1.2.1. Static
- 5.2.1.2.2. Automatic (ATS)
- 5.2.1.3. Switchgear
- 5.2.1.3.1. Low-voltage
- 5.2.1.3.2. Medium-voltage
- 5.2.1.4. Power Panels and Components
- 5.2.1.5. Others
- 5.2.2. Power Backup Solutions
- 5.2.2.1. UPS
- 5.2.2.2. Generators
- 5.2.3. Service
- 5.2.1. Power Distribution Solution
- 5.3. Market Analysis, Insights and Forecast - by Power Distribution Solution
- 5.3.1. PDUs - B
- 5.3.2. Transfer Switches
- 5.3.2.1. Static
- 5.3.2.2. Automatic (ATS)
- 5.3.3. Switchgear
- 5.3.3.1. Low-voltage
- 5.3.3.2. Medium-voltage
- 5.3.4. Power Panels and Components
- 5.3.5. Others
- 5.4. Market Analysis, Insights and Forecast - by Power Backup Solutions
- 5.4.1. UPS
- 5.4.2. Generators
- 5.5. Market Analysis, Insights and Forecast - by Service
- 5.6. Market Analysis, Insights and Forecast - by Mechanical Infrastructure
- 5.6.1. Cooling Systems
- 5.6.1.1. Immersion Cooling
- 5.6.1.2. Direct-to-chip Cooling
- 5.6.1.3. Rear Door Heat Exchanger
- 5.6.1.4. In-row and In-rack Cooling
- 5.6.1.5. Other Mechanical Infrastructures
- 5.6.2. Racks
- 5.6.1. Cooling Systems
- 5.7. Market Analysis, Insights and Forecast - by Cooling Systems
- 5.7.1. Immersion Cooling
- 5.7.2. Direct-to-chip Cooling
- 5.7.3. Rear Door Heat Exchanger
- 5.7.4. In-row and In-rack Cooling
- 5.7.5. Other Mechanical Infrastructures
- 5.8. Market Analysis, Insights and Forecast - by Racks
- 5.9. Market Analysis, Insights and Forecast - by Other Mechanical Infrastructures
- 5.10. Market Analysis, Insights and Forecast - by Tier Type
- 5.10.1. Tier-I and-II
- 5.10.2. Tier-III
- 5.10.3. Tier-IV
- 5.11. Market Analysis, Insights and Forecast - by Tier-I and-II
- 5.12. Market Analysis, Insights and Forecast - by Tier-III
- 5.13. Market Analysis, Insights and Forecast - by Tier-IV
- 5.14. Market Analysis, Insights and Forecast - by End User
- 5.14.1. Banking, Financial Services, and Insurance
- 5.14.2. IT and Telecommunications
- 5.14.3. Government and Defense
- 5.14.4. Healthcare
- 5.14.5. Other End Users
- 5.15. Market Analysis, Insights and Forecast - by Banking, Financial Services, and Insurance
- 5.16. Market Analysis, Insights and Forecast - by IT and Telecommunications
- 5.17. Market Analysis, Insights and Forecast - by Government and Defense
- 5.18. Market Analysis, Insights and Forecast - by Healthcare
- 5.19. Market Analysis, Insights and Forecast - by Other End Users
- 5.20. Market Analysis, Insights and Forecast - by Region
- 5.20.1. Poland
- 5.1. Market Analysis, Insights and Forecast - by Infrastructure
- 6. Competitive Analysis
- 6.1. Market Share Analysis 2024
- 6.2. Company Profiles
- 6.2.1 Per Aarsleff A/S
- 6.2.1.1. Overview
- 6.2.1.2. Products
- 6.2.1.3. SWOT Analysis
- 6.2.1.4. Recent Developments
- 6.2.1.5. Financials (Based on Availability)
- 6.2.2 Turner & Townsend Limited
- 6.2.2.1. Overview
- 6.2.2.2. Products
- 6.2.2.3. SWOT Analysis
- 6.2.2.4. Recent Developments
- 6.2.2.5. Financials (Based on Availability)
- 6.2.3 Coolair Equipment Limited
- 6.2.3.1. Overview
- 6.2.3.2. Products
- 6.2.3.3. SWOT Analysis
- 6.2.3.4. Recent Developments
- 6.2.3.5. Financials (Based on Availability)
- 6.2.4 Johnson Controls International PLC
- 6.2.4.1. Overview
- 6.2.4.2. Products
- 6.2.4.3. SWOT Analysis
- 6.2.4.4. Recent Developments
- 6.2.4.5. Financials (Based on Availability)
- 6.2.5 IBM Corporation
- 6.2.5.1. Overview
- 6.2.5.2. Products
- 6.2.5.3. SWOT Analysis
- 6.2.5.4. Recent Developments
- 6.2.5.5. Financials (Based on Availability)
- 6.2.6 Legrand SA
- 6.2.6.1. Overview
- 6.2.6.2. Products
- 6.2.6.3. SWOT Analysis
- 6.2.6.4. Recent Developments
- 6.2.6.5. Financials (Based on Availability)
- 6.2.7 Bouygues Construction SA
- 6.2.7.1. Overview
- 6.2.7.2. Products
- 6.2.7.3. SWOT Analysis
- 6.2.7.4. Recent Developments
- 6.2.7.5. Financials (Based on Availability)
- 6.2.8 ALFA LAVAL AB
- 6.2.8.1. Overview
- 6.2.8.2. Products
- 6.2.8.3. SWOT Analysis
- 6.2.8.4. Recent Developments
- 6.2.8.5. Financials (Based on Availability)
- 6.2.9 Schneider Electric SE
- 6.2.9.1. Overview
- 6.2.9.2. Products
- 6.2.9.3. SWOT Analysis
- 6.2.9.4. Recent Developments
- 6.2.9.5. Financials (Based on Availability)
- 6.2.10 STULZ GmbH
- 6.2.10.1. Overview
- 6.2.10.2. Products
- 6.2.10.3. SWOT Analysis
- 6.2.10.4. Recent Developments
- 6.2.10.5. Financials (Based on Availability)
- 6.2.11 DPR CONSTRUCTION INC
- 6.2.11.1. Overview
- 6.2.11.2. Products
- 6.2.11.3. SWOT Analysis
- 6.2.11.4. Recent Developments
- 6.2.11.5. Financials (Based on Availability)
- 6.2.12 Arup Group Limited
- 6.2.12.1. Overview
- 6.2.12.2. Products
- 6.2.12.3. SWOT Analysis
- 6.2.12.4. Recent Developments
- 6.2.12.5. Financials (Based on Availability)
- 6.2.13 Kirby Group Engineering
- 6.2.13.1. Overview
- 6.2.13.2. Products
- 6.2.13.3. SWOT Analysis
- 6.2.13.4. Recent Developments
- 6.2.13.5. Financials (Based on Availability)
- 6.2.14 AECOM
- 6.2.14.1. Overview
- 6.2.14.2. Products
- 6.2.14.3. SWOT Analysis
- 6.2.14.4. Recent Developments
- 6.2.14.5. Financials (Based on Availability)
- 6.2.15 Coromatic AB Sweden
- 6.2.15.1. Overview
- 6.2.15.2. Products
- 6.2.15.3. SWOT Analysis
- 6.2.15.4. Recent Developments
- 6.2.15.5. Financials (Based on Availability)
- 6.2.1 Per Aarsleff A/S
List of Figures
- Figure 1: Poland Data Center Construction Market Revenue Breakdown (Million, %) by Product 2024 & 2032
- Figure 2: Poland Data Center Construction Market Share (%) by Company 2024
List of Tables
- Table 1: Poland Data Center Construction Market Revenue Million Forecast, by Region 2019 & 2032
- Table 2: Poland Data Center Construction Market Volume K Unit Forecast, by Region 2019 & 2032
- Table 3: Poland Data Center Construction Market Revenue Million Forecast, by Infrastructure 2019 & 2032
- Table 4: Poland Data Center Construction Market Volume K Unit Forecast, by Infrastructure 2019 & 2032
- Table 5: Poland Data Center Construction Market Revenue Million Forecast, by Electrical Infrastructure 2019 & 2032
- Table 6: Poland Data Center Construction Market Volume K Unit Forecast, by Electrical Infrastructure 2019 & 2032
- Table 7: Poland Data Center Construction Market Revenue Million Forecast, by Power Distribution Solution 2019 & 2032
- Table 8: Poland Data Center Construction Market Volume K Unit Forecast, by Power Distribution Solution 2019 & 2032
- Table 9: Poland Data Center Construction Market Revenue Million Forecast, by Power Backup Solutions 2019 & 2032
- Table 10: Poland Data Center Construction Market Volume K Unit Forecast, by Power Backup Solutions 2019 & 2032
- Table 11: Poland Data Center Construction Market Revenue Million Forecast, by Service 2019 & 2032
- Table 12: Poland Data Center Construction Market Volume K Unit Forecast, by Service 2019 & 2032
- Table 13: Poland Data Center Construction Market Revenue Million Forecast, by Mechanical Infrastructure 2019 & 2032
- Table 14: Poland Data Center Construction Market Volume K Unit Forecast, by Mechanical Infrastructure 2019 & 2032
- Table 15: Poland Data Center Construction Market Revenue Million Forecast, by Cooling Systems 2019 & 2032
- Table 16: Poland Data Center Construction Market Volume K Unit Forecast, by Cooling Systems 2019 & 2032
- Table 17: Poland Data Center Construction Market Revenue Million Forecast, by Racks 2019 & 2032
- Table 18: Poland Data Center Construction Market Volume K Unit Forecast, by Racks 2019 & 2032
- Table 19: Poland Data Center Construction Market Revenue Million Forecast, by Other Mechanical Infrastructures 2019 & 2032
- Table 20: Poland Data Center Construction Market Volume K Unit Forecast, by Other Mechanical Infrastructures 2019 & 2032
- Table 21: Poland Data Center Construction Market Revenue Million Forecast, by Tier Type 2019 & 2032
- Table 22: Poland Data Center Construction Market Volume K Unit Forecast, by Tier Type 2019 & 2032
- Table 23: Poland Data Center Construction Market Revenue Million Forecast, by Tier-I and-II 2019 & 2032
- Table 24: Poland Data Center Construction Market Volume K Unit Forecast, by Tier-I and-II 2019 & 2032
- Table 25: Poland Data Center Construction Market Revenue Million Forecast, by Tier-III 2019 & 2032
- Table 26: Poland Data Center Construction Market Volume K Unit Forecast, by Tier-III 2019 & 2032
- Table 27: Poland Data Center Construction Market Revenue Million Forecast, by Tier-IV 2019 & 2032
- Table 28: Poland Data Center Construction Market Volume K Unit Forecast, by Tier-IV 2019 & 2032
- Table 29: Poland Data Center Construction Market Revenue Million Forecast, by End User 2019 & 2032
- Table 30: Poland Data Center Construction Market Volume K Unit Forecast, by End User 2019 & 2032
- Table 31: Poland Data Center Construction Market Revenue Million Forecast, by Banking, Financial Services, and Insurance 2019 & 2032
- Table 32: Poland Data Center Construction Market Volume K Unit Forecast, by Banking, Financial Services, and Insurance 2019 & 2032
- Table 33: Poland Data Center Construction Market Revenue Million Forecast, by IT and Telecommunications 2019 & 2032
- Table 34: Poland Data Center Construction Market Volume K Unit Forecast, by IT and Telecommunications 2019 & 2032
- Table 35: Poland Data Center Construction Market Revenue Million Forecast, by Government and Defense 2019 & 2032
- Table 36: Poland Data Center Construction Market Volume K Unit Forecast, by Government and Defense 2019 & 2032
- Table 37: Poland Data Center Construction Market Revenue Million Forecast, by Healthcare 2019 & 2032
- Table 38: Poland Data Center Construction Market Volume K Unit Forecast, by Healthcare 2019 & 2032
- Table 39: Poland Data Center Construction Market Revenue Million Forecast, by Other End Users 2019 & 2032
- Table 40: Poland Data Center Construction Market Volume K Unit Forecast, by Other End Users 2019 & 2032
- Table 41: Poland Data Center Construction Market Revenue Million Forecast, by Region 2019 & 2032
- Table 42: Poland Data Center Construction Market Volume K Unit Forecast, by Region 2019 & 2032
- Table 43: Poland Data Center Construction Market Revenue Million Forecast, by Country 2019 & 2032
- Table 44: Poland Data Center Construction Market Volume K Unit Forecast, by Country 2019 & 2032
- Table 45: Poland Data Center Construction Market Revenue Million Forecast, by Infrastructure 2019 & 2032
- Table 46: Poland Data Center Construction Market Volume K Unit Forecast, by Infrastructure 2019 & 2032
- Table 47: Poland Data Center Construction Market Revenue Million Forecast, by Electrical Infrastructure 2019 & 2032
- Table 48: Poland Data Center Construction Market Volume K Unit Forecast, by Electrical Infrastructure 2019 & 2032
- Table 49: Poland Data Center Construction Market Revenue Million Forecast, by Power Distribution Solution 2019 & 2032
- Table 50: Poland Data Center Construction Market Volume K Unit Forecast, by Power Distribution Solution 2019 & 2032
- Table 51: Poland Data Center Construction Market Revenue Million Forecast, by Power Backup Solutions 2019 & 2032
- Table 52: Poland Data Center Construction Market Volume K Unit Forecast, by Power Backup Solutions 2019 & 2032
- Table 53: Poland Data Center Construction Market Revenue Million Forecast, by Service 2019 & 2032
- Table 54: Poland Data Center Construction Market Volume K Unit Forecast, by Service 2019 & 2032
- Table 55: Poland Data Center Construction Market Revenue Million Forecast, by Mechanical Infrastructure 2019 & 2032
- Table 56: Poland Data Center Construction Market Volume K Unit Forecast, by Mechanical Infrastructure 2019 & 2032
- Table 57: Poland Data Center Construction Market Revenue Million Forecast, by Cooling Systems 2019 & 2032
- Table 58: Poland Data Center Construction Market Volume K Unit Forecast, by Cooling Systems 2019 & 2032
- Table 59: Poland Data Center Construction Market Revenue Million Forecast, by Racks 2019 & 2032
- Table 60: Poland Data Center Construction Market Volume K Unit Forecast, by Racks 2019 & 2032
- Table 61: Poland Data Center Construction Market Revenue Million Forecast, by Other Mechanical Infrastructures 2019 & 2032
- Table 62: Poland Data Center Construction Market Volume K Unit Forecast, by Other Mechanical Infrastructures 2019 & 2032
- Table 63: Poland Data Center Construction Market Revenue Million Forecast, by Tier Type 2019 & 2032
- Table 64: Poland Data Center Construction Market Volume K Unit Forecast, by Tier Type 2019 & 2032
- Table 65: Poland Data Center Construction Market Revenue Million Forecast, by Tier-I and-II 2019 & 2032
- Table 66: Poland Data Center Construction Market Volume K Unit Forecast, by Tier-I and-II 2019 & 2032
- Table 67: Poland Data Center Construction Market Revenue Million Forecast, by Tier-III 2019 & 2032
- Table 68: Poland Data Center Construction Market Volume K Unit Forecast, by Tier-III 2019 & 2032
- Table 69: Poland Data Center Construction Market Revenue Million Forecast, by Tier-IV 2019 & 2032
- Table 70: Poland Data Center Construction Market Volume K Unit Forecast, by Tier-IV 2019 & 2032
- Table 71: Poland Data Center Construction Market Revenue Million Forecast, by End User 2019 & 2032
- Table 72: Poland Data Center Construction Market Volume K Unit Forecast, by End User 2019 & 2032
- Table 73: Poland Data Center Construction Market Revenue Million Forecast, by Banking, Financial Services, and Insurance 2019 & 2032
- Table 74: Poland Data Center Construction Market Volume K Unit Forecast, by Banking, Financial Services, and Insurance 2019 & 2032
- Table 75: Poland Data Center Construction Market Revenue Million Forecast, by IT and Telecommunications 2019 & 2032
- Table 76: Poland Data Center Construction Market Volume K Unit Forecast, by IT and Telecommunications 2019 & 2032
- Table 77: Poland Data Center Construction Market Revenue Million Forecast, by Government and Defense 2019 & 2032
- Table 78: Poland Data Center Construction Market Volume K Unit Forecast, by Government and Defense 2019 & 2032
- Table 79: Poland Data Center Construction Market Revenue Million Forecast, by Healthcare 2019 & 2032
- Table 80: Poland Data Center Construction Market Volume K Unit Forecast, by Healthcare 2019 & 2032
- Table 81: Poland Data Center Construction Market Revenue Million Forecast, by Other End Users 2019 & 2032
- Table 82: Poland Data Center Construction Market Volume K Unit Forecast, by Other End Users 2019 & 2032
- Table 83: Poland Data Center Construction Market Revenue Million Forecast, by Country 2019 & 2032
- Table 84: Poland Data Center Construction Market Volume K Unit Forecast, by Country 2019 & 2032
Frequently Asked Questions
1. What is the projected Compound Annual Growth Rate (CAGR) of the Poland Data Center Construction Market?
The projected CAGR is approximately 15.10%.
2. Which companies are prominent players in the Poland Data Center Construction Market?
Key companies in the market include Per Aarsleff A/S, Turner & Townsend Limited, Coolair Equipment Limited, Johnson Controls International PLC, IBM Corporation, Legrand SA, Bouygues Construction SA, ALFA LAVAL AB, Schneider Electric SE, STULZ GmbH, DPR CONSTRUCTION INC, Arup Group Limited, Kirby Group Engineering, AECOM, Coromatic AB Sweden.
3. What are the main segments of the Poland Data Center Construction Market?
The market segments include Infrastructure, Electrical Infrastructure, Power Distribution Solution, Power Backup Solutions, Service , Mechanical Infrastructure, Cooling Systems, Racks, Other Mechanical Infrastructures, Tier Type, Tier-I and-II, Tier-III, Tier-IV, End User, Banking, Financial Services, and Insurance, IT and Telecommunications, Government and Defense, Healthcare, Other End Users.
4. Can you provide details about the market size?
The market size is estimated to be USD XX Million as of 2022.
5. What are some drivers contributing to market growth?
5G Developments Fuelling Data Center Investments; Growing Cloud Servce adoption; Green Data Centers rising awarness of Carbon-Neutrality leading to Infrastructure upgrades.
6. What are the notable trends driving market growth?
IT and Telecom to have significant market share.
7. Are there any restraints impacting market growth?
Security Challenges Impacting Growth of Data Centers.
8. Can you provide examples of recent developments in the market?
December 2022: Atman purchased land, the 5.5-hectare site in Duchnice near Ożarów Mazowiecki, to build another data center. The Atman Data Center Warsaw-3 campus was scheduled to open in Q4 2024 with a target IT capacity of 43 MW.
9. What pricing options are available for accessing the report?
Pricing options include single-user, multi-user, and enterprise licenses priced at USD 3800, USD 4500, and USD 5800 respectively.
10. Is the market size provided in terms of value or volume?
The market size is provided in terms of value, measured in Million and volume, measured in K Unit.
11. Are there any specific market keywords associated with the report?
Yes, the market keyword associated with the report is "Poland Data Center Construction Market," which aids in identifying and referencing the specific market segment covered.
12. How do I determine which pricing option suits my needs best?
The pricing options vary based on user requirements and access needs. Individual users may opt for single-user licenses, while businesses requiring broader access may choose multi-user or enterprise licenses for cost-effective access to the report.
13. Are there any additional resources or data provided in the Poland Data Center Construction Market report?
While the report offers comprehensive insights, it's advisable to review the specific contents or supplementary materials provided to ascertain if additional resources or data are available.
14. How can I stay updated on further developments or reports in the Poland Data Center Construction Market?
To stay informed about further developments, trends, and reports in the Poland Data Center Construction Market, consider subscribing to industry newsletters, following relevant companies and organizations, or regularly checking reputable industry news sources and publications.
Methodology
Step 1 - Identification of Relevant Samples Size from Population Database


Step 2 - Approaches for Defining Global Market Size (Value, Volume* & Price*)

Note*: In applicable scenarios
Step 3 - Data Sources
Primary Research
- Web Analytics
- Survey Reports
- Research Institute
- Latest Research Reports
- Opinion Leaders
Secondary Research
- Annual Reports
- White Paper
- Latest Press Release
- Industry Association
- Paid Database
- Investor Presentations

Step 4 - Data Triangulation
Involves using different sources of information in order to increase the validity of a study
These sources are likely to be stakeholders in a program - participants, other researchers, program staff, other community members, and so on.
Then we put all data in single framework & apply various statistical tools to find out the dynamic on the market.
During the analysis stage, feedback from the stakeholder groups would be compared to determine areas of agreement as well as areas of divergence
