

Key Insights
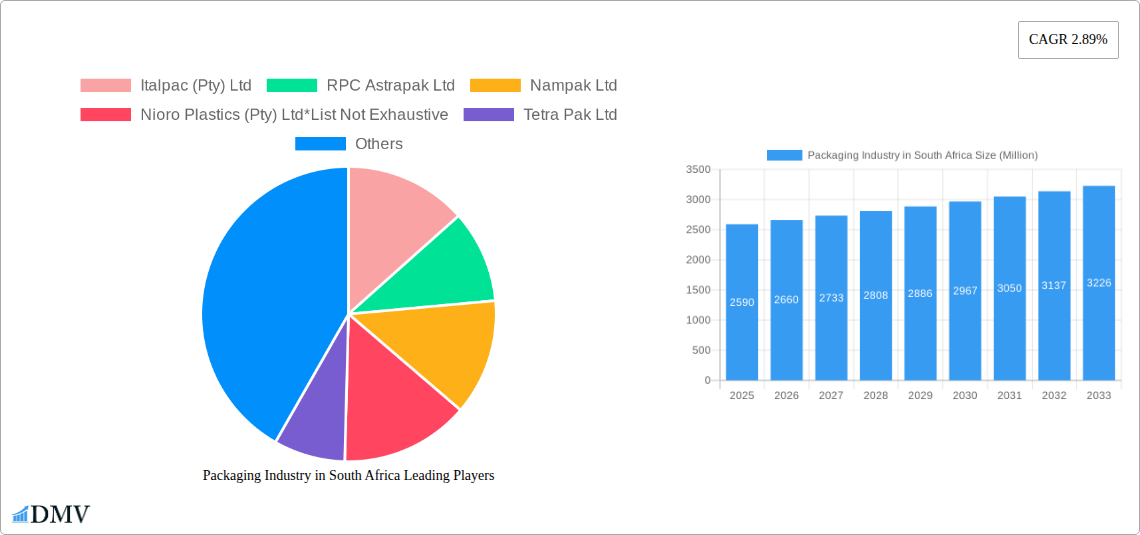
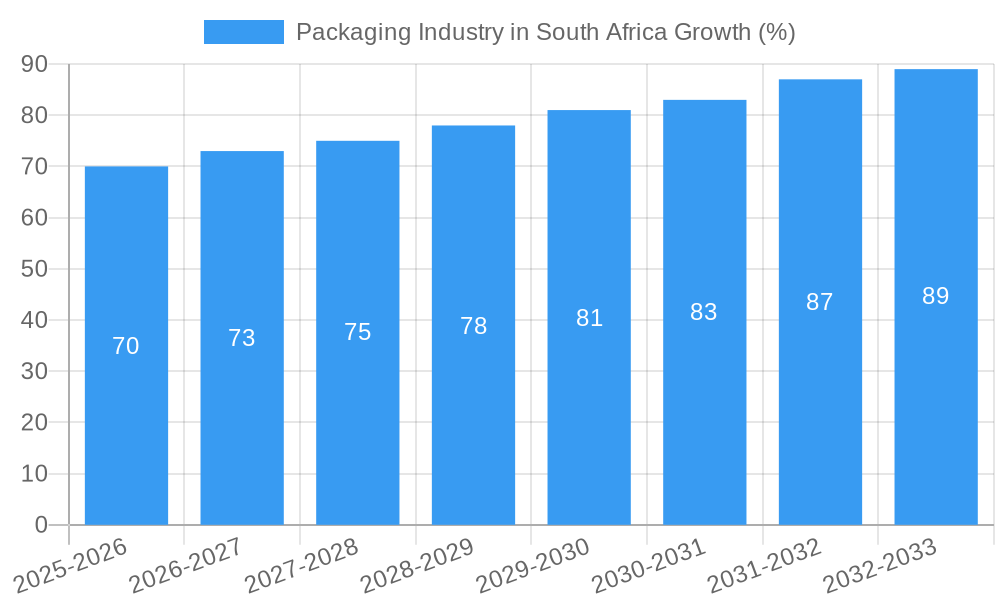
The South African packaging industry, valued at $2.59 billion in 2025, is projected to experience steady growth, driven by a rising population, increasing urbanization, and a burgeoning food and beverage sector. The 2.89% CAGR indicates a consistent expansion, primarily fueled by demand for convenient and safe packaging solutions across various end-user industries. Growth is further stimulated by the evolving consumer preferences for sustainable and eco-friendly packaging materials, pushing manufacturers to innovate with recyclable and biodegradable options like PE and PP. While the dominance of rigid packaging (bottles and jars) is expected to continue, flexible packaging (pouches and films) is witnessing significant uptake, particularly in the food and beverage sectors, due to its cost-effectiveness and versatility. However, challenges such as fluctuating raw material prices and stringent environmental regulations present potential restraints on market growth. The competitive landscape is marked by both local players like Italpac, RPC Astrapak, and Nampak, and international giants such as Amcor and Tetra Pak, indicating a dynamic market characterized by both local expertise and global innovation. The industry's segmentation by product type, plastic type, material, and end-user provides insights into specific market niches, enabling targeted strategies for businesses seeking to capitalize on growth opportunities. Further analysis should consider the impact of government policies aimed at promoting sustainable packaging practices and reducing plastic waste, which will significantly shape the future trajectory of the market.
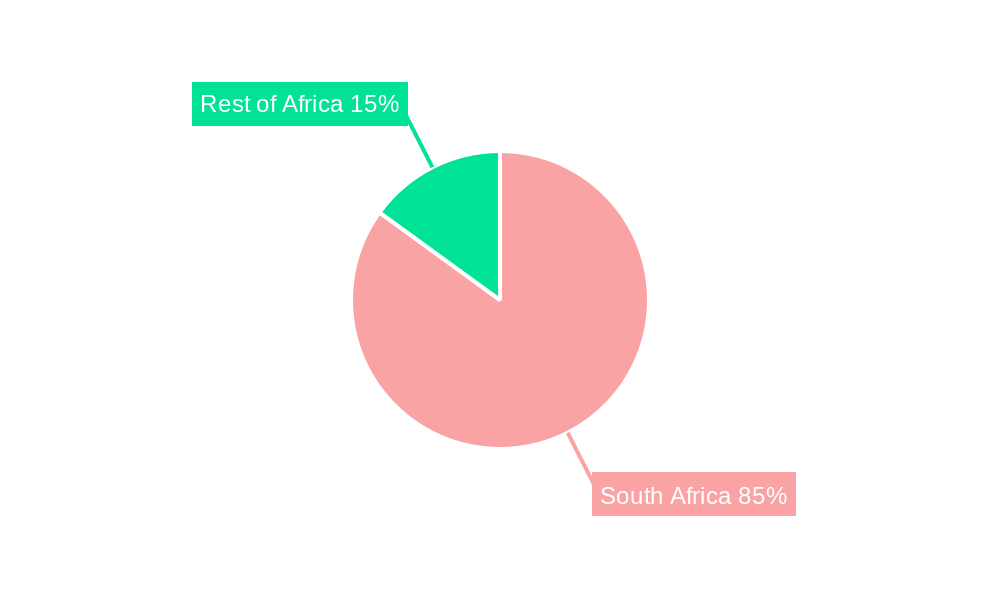
The regional distribution of the South African market shows strong concentration within the country itself, with South Africa contributing significantly to the overall regional value. Neighbouring countries like Sudan, Uganda, Tanzania, and Kenya represent emerging markets with growth potential, although their contribution to the overall African market share remains relatively smaller compared to South Africa at this time. The forecast period (2025-2033) will likely see a diversification of both packaging materials and end-use sectors, with a continued focus on innovation in sustainable packaging technologies aligning with global trends towards environmentally responsible practices. This will likely influence the market share held by various material types and product types as companies adapt to meet these evolving demands.
Packaging Industry in South Africa Market Report: 2019-2033
This comprehensive report provides a detailed analysis of the South African packaging industry, offering invaluable insights for stakeholders seeking to understand market trends, opportunities, and challenges. Covering the period from 2019 to 2033, with a base year of 2025, this report forecasts market growth and evolution, highlighting key players and emerging trends. The report's data-driven analysis utilizes both historical (2019-2024) and projected (2025-2033) data, providing a complete picture of this dynamic market. The South African packaging market, valued at xx Million in 2024, is expected to reach xx Million by 2033, presenting significant opportunities and challenges for businesses operating within this sector.
Packaging Industry in South Africa Market Composition & Trends
The South African packaging industry is characterized by a moderately concentrated market with key players like Nampak Ltd, RPC Astrapak Ltd, and Tetra Pak Ltd holding significant market share. However, a multitude of smaller players contribute to the overall market dynamism. Market share distribution fluctuates based on product type, material, and end-user industry demands. Innovation is driven by sustainability concerns, evolving consumer preferences for convenient packaging, and the introduction of new materials and technologies. The regulatory landscape, particularly concerning plastic waste management and the EPR (Extended Producer Responsibility) fee introduced in May 2021, significantly influences industry strategies and investments. Substitute products, especially in the food and beverage sector, pose a competitive threat. Mergers and acquisitions (M&A) activity remains relatively moderate, with deal values averaging around xx Million per transaction in recent years.
- Market Concentration: Moderately concentrated, with several large players and many smaller companies.
- Innovation Catalysts: Sustainability concerns, consumer preference shifts, technological advancements.
- Regulatory Landscape: Significant impact of EPR regulations and focus on plastic waste reduction.
- Substitute Products: Growing competition from alternative packaging materials and solutions.
- End-User Profiles: Diverse, spanning food, beverages, healthcare, personal care, and other industries.
- M&A Activity: Moderate activity with average deal values of approximately xx Million.
Packaging Industry in South Africa Industry Evolution
The South African packaging industry has witnessed significant growth over the past decade, fueled by a growing population, rising disposable incomes, and increased consumption. The historical period (2019-2024) saw an average annual growth rate (AAGR) of xx%, largely driven by the food and beverage sector. Technological advancements, including automation in manufacturing and the adoption of sustainable packaging materials, have played a key role in boosting efficiency and improving product quality. Shifting consumer demands towards convenience, eco-friendly packaging, and enhanced product protection are further shaping the market landscape. The forecast period (2025-2033) projects a continued growth trajectory, with an anticipated AAGR of xx%, primarily fueled by rising demand for sustainable packaging and increasing government support for the circular economy. The adoption of advanced technologies such as AI and machine learning in packaging design and production is expected to accelerate in the forecast period.
Leading Regions, Countries, or Segments in Packaging Industry in South Africa
The South African packaging market is geographically diverse, with no single region dominating. However, major urban centers and industrial hubs exhibit higher concentration of packaging activities. Within product segments, bottles and jars maintain a significant share, followed by flexible packaging (pouches, bags, and films). PET and PP are the most widely used plastic types, reflecting their versatility and cost-effectiveness. The food and beverage industry is the largest end-user, followed by the healthcare and personal care sectors.
- Key Drivers (By Segment):
- Bottles & Jars: Established demand, suitability for diverse products.
- Flexible Packaging: Cost-effectiveness, convenience, and versatility.
- PET & PP: High demand due to recyclability and suitability for various applications.
- Food & Beverages: High volume consumption, diverse packaging needs.
- Dominance Factors: Strong consumer demand, established manufacturing infrastructure, favorable regulatory environment.
Packaging Industry in South Africa Product Innovations
Recent innovations focus on sustainable materials like bioplastics and recycled content, improved barrier properties for extended shelf life, and smart packaging technologies enabling product traceability and consumer engagement. These innovations emphasize reducing environmental impact while meeting evolving consumer demands for convenience and enhanced product quality. Unique selling propositions include lightweight designs to reduce material consumption and functional features like resealable closures and tamper-evident seals.
Propelling Factors for Packaging Industry in South Africa Growth
Technological advancements (automation, sustainable materials), robust economic growth and rising consumer spending, and supportive government policies (e.g., the EPR scheme aiming to boost recycling) are all major drivers of growth. The increasing focus on sustainability and the circular economy is particularly significant, fostering innovation in eco-friendly packaging solutions.
Obstacles in the Packaging Industry in South Africa Market
Regulatory hurdles, particularly those related to plastic waste management and EPR compliance, can increase production costs and require significant investments in infrastructure. Supply chain disruptions, raw material price volatility, and intense competition from both domestic and international players also pose challenges.
Future Opportunities in Packaging Industry in South Africa
Growth opportunities exist in sustainable packaging solutions, e-commerce packaging, and specialized packaging for niche markets. Technological advancements such as AI-powered design and smart packaging will create further opportunities. Furthermore, increasing demand for convenient and personalized packaging will drive product innovation.
Major Players in the Packaging Industry in South Africa Ecosystem
- Italpac (Pty) Ltd
- RPC Astrapak Ltd
- Nampak Ltd
- Nioro Plastics (Pty) Ltd
- Tetra Pak Ltd
- Mondi PLC
- Mpact Ltd
- Amcor Limited
- Sealed Air Corporation
- Constantia Flexibles Corporation
Key Developments in Packaging Industry in South Africa Industry
- May 2021: Introduction of EPR regulations, impacting production costs and driving investment in recycling infrastructure.
- January 2020: Launch of the South African Plastics Pact, promoting a circular economy for plastics and collaboration among stakeholders.
Strategic Packaging Industry in South Africa Market Forecast
The South African packaging market is poised for continued growth, driven by favorable demographics, economic development, and increasing focus on sustainability. Opportunities abound in eco-friendly packaging, technological innovation, and catering to evolving consumer preferences. The market's future success will depend on adaptation to regulatory changes, efficient supply chain management, and a commitment to sustainable practices.
Packaging Industry in South Africa Segmentation
-
1. Product Type
- 1.1. Bottles and Jars
- 1.2. Pouches
- 1.3. Bags
- 1.4. Films and Wraps
- 1.5. Other Product Types
-
2. Type of Plastic
- 2.1. Rigid
- 2.2. Flexible
-
3. Material
- 3.1. Polyethylene (PE)
- 3.2. Polypropylene (PP)
- 3.3. Polyvinyl Chloride (PVC)
- 3.4. Polyethylene Terephthalate (PET)
- 3.5. Other Materials
-
4. End-user Industry
- 4.1. Food
- 4.2. Beverages
- 4.3. Healthcare and Pharmaceuticals
- 4.4. Personal and Home Care
- 4.5. Other End-user Industries
Packaging Industry in South Africa Segmentation By Geography
-
1. North America
- 1.1. United States
- 1.2. Canada
- 1.3. Mexico
-
2. South America
- 2.1. Brazil
- 2.2. Argentina
- 2.3. Rest of South America
-
3. Europe
- 3.1. United Kingdom
- 3.2. Germany
- 3.3. France
- 3.4. Italy
- 3.5. Spain
- 3.6. Russia
- 3.7. Benelux
- 3.8. Nordics
- 3.9. Rest of Europe
-
4. Middle East & Africa
- 4.1. Turkey
- 4.2. Israel
- 4.3. GCC
- 4.4. North Africa
- 4.5. South Africa
- 4.6. Rest of Middle East & Africa
-
5. Asia Pacific
- 5.1. China
- 5.2. India
- 5.3. Japan
- 5.4. South Korea
- 5.5. ASEAN
- 5.6. Oceania
- 5.7. Rest of Asia Pacific
Packaging Industry in South Africa REPORT HIGHLIGHTS
| Aspects | Details |
|---|---|
| Study Period | 2019-2033 |
| Base Year | 2024 |
| Estimated Year | 2025 |
| Forecast Period | 2025-2033 |
| Historical Period | 2019-2024 |
| Growth Rate | CAGR of 2.89% from 2019-2033 |
| Segmentation |
|
Table of Contents
- 1. Introduction
- 1.1. Research Scope
- 1.2. Market Segmentation
- 1.3. Research Methodology
- 1.4. Definitions and Assumptions
- 2. Executive Summary
- 2.1. Introduction
- 3. Market Dynamics
- 3.1. Introduction
- 3.2. Market Drivers
- 3.2.1. Growing Demand for Consumer Goods; Favorable Packaging Properties Possessed by Plastic
- 3.3. Market Restrains
- 3.3.1. Fluctuating Raw Material Prices
- 3.4. Market Trends
- 3.4.1. Aggressive Recycling Rates of Plastic Products within the Country and an increase in Waste Generation
- 4. Market Factor Analysis
- 4.1. Porters Five Forces
- 4.2. Supply/Value Chain
- 4.3. PESTEL analysis
- 4.4. Market Entropy
- 4.5. Patent/Trademark Analysis
- 5. Global Packaging Industry in South Africa Analysis, Insights and Forecast, 2019-2031
- 5.1. Market Analysis, Insights and Forecast - by Product Type
- 5.1.1. Bottles and Jars
- 5.1.2. Pouches
- 5.1.3. Bags
- 5.1.4. Films and Wraps
- 5.1.5. Other Product Types
- 5.2. Market Analysis, Insights and Forecast - by Type of Plastic
- 5.2.1. Rigid
- 5.2.2. Flexible
- 5.3. Market Analysis, Insights and Forecast - by Material
- 5.3.1. Polyethylene (PE)
- 5.3.2. Polypropylene (PP)
- 5.3.3. Polyvinyl Chloride (PVC)
- 5.3.4. Polyethylene Terephthalate (PET)
- 5.3.5. Other Materials
- 5.4. Market Analysis, Insights and Forecast - by End-user Industry
- 5.4.1. Food
- 5.4.2. Beverages
- 5.4.3. Healthcare and Pharmaceuticals
- 5.4.4. Personal and Home Care
- 5.4.5. Other End-user Industries
- 5.5. Market Analysis, Insights and Forecast - by Region
- 5.5.1. North America
- 5.5.2. South America
- 5.5.3. Europe
- 5.5.4. Middle East & Africa
- 5.5.5. Asia Pacific
- 5.1. Market Analysis, Insights and Forecast - by Product Type
- 6. North America Packaging Industry in South Africa Analysis, Insights and Forecast, 2019-2031
- 6.1. Market Analysis, Insights and Forecast - by Product Type
- 6.1.1. Bottles and Jars
- 6.1.2. Pouches
- 6.1.3. Bags
- 6.1.4. Films and Wraps
- 6.1.5. Other Product Types
- 6.2. Market Analysis, Insights and Forecast - by Type of Plastic
- 6.2.1. Rigid
- 6.2.2. Flexible
- 6.3. Market Analysis, Insights and Forecast - by Material
- 6.3.1. Polyethylene (PE)
- 6.3.2. Polypropylene (PP)
- 6.3.3. Polyvinyl Chloride (PVC)
- 6.3.4. Polyethylene Terephthalate (PET)
- 6.3.5. Other Materials
- 6.4. Market Analysis, Insights and Forecast - by End-user Industry
- 6.4.1. Food
- 6.4.2. Beverages
- 6.4.3. Healthcare and Pharmaceuticals
- 6.4.4. Personal and Home Care
- 6.4.5. Other End-user Industries
- 6.1. Market Analysis, Insights and Forecast - by Product Type
- 7. South America Packaging Industry in South Africa Analysis, Insights and Forecast, 2019-2031
- 7.1. Market Analysis, Insights and Forecast - by Product Type
- 7.1.1. Bottles and Jars
- 7.1.2. Pouches
- 7.1.3. Bags
- 7.1.4. Films and Wraps
- 7.1.5. Other Product Types
- 7.2. Market Analysis, Insights and Forecast - by Type of Plastic
- 7.2.1. Rigid
- 7.2.2. Flexible
- 7.3. Market Analysis, Insights and Forecast - by Material
- 7.3.1. Polyethylene (PE)
- 7.3.2. Polypropylene (PP)
- 7.3.3. Polyvinyl Chloride (PVC)
- 7.3.4. Polyethylene Terephthalate (PET)
- 7.3.5. Other Materials
- 7.4. Market Analysis, Insights and Forecast - by End-user Industry
- 7.4.1. Food
- 7.4.2. Beverages
- 7.4.3. Healthcare and Pharmaceuticals
- 7.4.4. Personal and Home Care
- 7.4.5. Other End-user Industries
- 7.1. Market Analysis, Insights and Forecast - by Product Type
- 8. Europe Packaging Industry in South Africa Analysis, Insights and Forecast, 2019-2031
- 8.1. Market Analysis, Insights and Forecast - by Product Type
- 8.1.1. Bottles and Jars
- 8.1.2. Pouches
- 8.1.3. Bags
- 8.1.4. Films and Wraps
- 8.1.5. Other Product Types
- 8.2. Market Analysis, Insights and Forecast - by Type of Plastic
- 8.2.1. Rigid
- 8.2.2. Flexible
- 8.3. Market Analysis, Insights and Forecast - by Material
- 8.3.1. Polyethylene (PE)
- 8.3.2. Polypropylene (PP)
- 8.3.3. Polyvinyl Chloride (PVC)
- 8.3.4. Polyethylene Terephthalate (PET)
- 8.3.5. Other Materials
- 8.4. Market Analysis, Insights and Forecast - by End-user Industry
- 8.4.1. Food
- 8.4.2. Beverages
- 8.4.3. Healthcare and Pharmaceuticals
- 8.4.4. Personal and Home Care
- 8.4.5. Other End-user Industries
- 8.1. Market Analysis, Insights and Forecast - by Product Type
- 9. Middle East & Africa Packaging Industry in South Africa Analysis, Insights and Forecast, 2019-2031
- 9.1. Market Analysis, Insights and Forecast - by Product Type
- 9.1.1. Bottles and Jars
- 9.1.2. Pouches
- 9.1.3. Bags
- 9.1.4. Films and Wraps
- 9.1.5. Other Product Types
- 9.2. Market Analysis, Insights and Forecast - by Type of Plastic
- 9.2.1. Rigid
- 9.2.2. Flexible
- 9.3. Market Analysis, Insights and Forecast - by Material
- 9.3.1. Polyethylene (PE)
- 9.3.2. Polypropylene (PP)
- 9.3.3. Polyvinyl Chloride (PVC)
- 9.3.4. Polyethylene Terephthalate (PET)
- 9.3.5. Other Materials
- 9.4. Market Analysis, Insights and Forecast - by End-user Industry
- 9.4.1. Food
- 9.4.2. Beverages
- 9.4.3. Healthcare and Pharmaceuticals
- 9.4.4. Personal and Home Care
- 9.4.5. Other End-user Industries
- 9.1. Market Analysis, Insights and Forecast - by Product Type
- 10. Asia Pacific Packaging Industry in South Africa Analysis, Insights and Forecast, 2019-2031
- 10.1. Market Analysis, Insights and Forecast - by Product Type
- 10.1.1. Bottles and Jars
- 10.1.2. Pouches
- 10.1.3. Bags
- 10.1.4. Films and Wraps
- 10.1.5. Other Product Types
- 10.2. Market Analysis, Insights and Forecast - by Type of Plastic
- 10.2.1. Rigid
- 10.2.2. Flexible
- 10.3. Market Analysis, Insights and Forecast - by Material
- 10.3.1. Polyethylene (PE)
- 10.3.2. Polypropylene (PP)
- 10.3.3. Polyvinyl Chloride (PVC)
- 10.3.4. Polyethylene Terephthalate (PET)
- 10.3.5. Other Materials
- 10.4. Market Analysis, Insights and Forecast - by End-user Industry
- 10.4.1. Food
- 10.4.2. Beverages
- 10.4.3. Healthcare and Pharmaceuticals
- 10.4.4. Personal and Home Care
- 10.4.5. Other End-user Industries
- 10.1. Market Analysis, Insights and Forecast - by Product Type
- 11. South Africa Packaging Industry in South Africa Analysis, Insights and Forecast, 2019-2031
- 12. Sudan Packaging Industry in South Africa Analysis, Insights and Forecast, 2019-2031
- 13. Uganda Packaging Industry in South Africa Analysis, Insights and Forecast, 2019-2031
- 14. Tanzania Packaging Industry in South Africa Analysis, Insights and Forecast, 2019-2031
- 15. Kenya Packaging Industry in South Africa Analysis, Insights and Forecast, 2019-2031
- 16. Rest of Africa Packaging Industry in South Africa Analysis, Insights and Forecast, 2019-2031
- 17. Competitive Analysis
- 17.1. Global Market Share Analysis 2024
- 17.2. Company Profiles
- 17.2.1 Italpac (Pty) Ltd
- 17.2.1.1. Overview
- 17.2.1.2. Products
- 17.2.1.3. SWOT Analysis
- 17.2.1.4. Recent Developments
- 17.2.1.5. Financials (Based on Availability)
- 17.2.2 RPC Astrapak Ltd
- 17.2.2.1. Overview
- 17.2.2.2. Products
- 17.2.2.3. SWOT Analysis
- 17.2.2.4. Recent Developments
- 17.2.2.5. Financials (Based on Availability)
- 17.2.3 Nampak Ltd
- 17.2.3.1. Overview
- 17.2.3.2. Products
- 17.2.3.3. SWOT Analysis
- 17.2.3.4. Recent Developments
- 17.2.3.5. Financials (Based on Availability)
- 17.2.4 Nioro Plastics (Pty) Ltd*List Not Exhaustive
- 17.2.4.1. Overview
- 17.2.4.2. Products
- 17.2.4.3. SWOT Analysis
- 17.2.4.4. Recent Developments
- 17.2.4.5. Financials (Based on Availability)
- 17.2.5 Tetra Pak Ltd
- 17.2.5.1. Overview
- 17.2.5.2. Products
- 17.2.5.3. SWOT Analysis
- 17.2.5.4. Recent Developments
- 17.2.5.5. Financials (Based on Availability)
- 17.2.6 Mondi PLC
- 17.2.6.1. Overview
- 17.2.6.2. Products
- 17.2.6.3. SWOT Analysis
- 17.2.6.4. Recent Developments
- 17.2.6.5. Financials (Based on Availability)
- 17.2.7 Mpact Ltd
- 17.2.7.1. Overview
- 17.2.7.2. Products
- 17.2.7.3. SWOT Analysis
- 17.2.7.4. Recent Developments
- 17.2.7.5. Financials (Based on Availability)
- 17.2.8 Amcor Limited
- 17.2.8.1. Overview
- 17.2.8.2. Products
- 17.2.8.3. SWOT Analysis
- 17.2.8.4. Recent Developments
- 17.2.8.5. Financials (Based on Availability)
- 17.2.9 Sealed Air Corporation
- 17.2.9.1. Overview
- 17.2.9.2. Products
- 17.2.9.3. SWOT Analysis
- 17.2.9.4. Recent Developments
- 17.2.9.5. Financials (Based on Availability)
- 17.2.10 Constantia Flexibles Corporation
- 17.2.10.1. Overview
- 17.2.10.2. Products
- 17.2.10.3. SWOT Analysis
- 17.2.10.4. Recent Developments
- 17.2.10.5. Financials (Based on Availability)
- 17.2.1 Italpac (Pty) Ltd
List of Figures
- Figure 1: Global Packaging Industry in South Africa Revenue Breakdown (Million, %) by Region 2024 & 2032
- Figure 2: Africa Packaging Industry in South Africa Revenue (Million), by Country 2024 & 2032
- Figure 3: Africa Packaging Industry in South Africa Revenue Share (%), by Country 2024 & 2032
- Figure 4: North America Packaging Industry in South Africa Revenue (Million), by Product Type 2024 & 2032
- Figure 5: North America Packaging Industry in South Africa Revenue Share (%), by Product Type 2024 & 2032
- Figure 6: North America Packaging Industry in South Africa Revenue (Million), by Type of Plastic 2024 & 2032
- Figure 7: North America Packaging Industry in South Africa Revenue Share (%), by Type of Plastic 2024 & 2032
- Figure 8: North America Packaging Industry in South Africa Revenue (Million), by Material 2024 & 2032
- Figure 9: North America Packaging Industry in South Africa Revenue Share (%), by Material 2024 & 2032
- Figure 10: North America Packaging Industry in South Africa Revenue (Million), by End-user Industry 2024 & 2032
- Figure 11: North America Packaging Industry in South Africa Revenue Share (%), by End-user Industry 2024 & 2032
- Figure 12: North America Packaging Industry in South Africa Revenue (Million), by Country 2024 & 2032
- Figure 13: North America Packaging Industry in South Africa Revenue Share (%), by Country 2024 & 2032
- Figure 14: South America Packaging Industry in South Africa Revenue (Million), by Product Type 2024 & 2032
- Figure 15: South America Packaging Industry in South Africa Revenue Share (%), by Product Type 2024 & 2032
- Figure 16: South America Packaging Industry in South Africa Revenue (Million), by Type of Plastic 2024 & 2032
- Figure 17: South America Packaging Industry in South Africa Revenue Share (%), by Type of Plastic 2024 & 2032
- Figure 18: South America Packaging Industry in South Africa Revenue (Million), by Material 2024 & 2032
- Figure 19: South America Packaging Industry in South Africa Revenue Share (%), by Material 2024 & 2032
- Figure 20: South America Packaging Industry in South Africa Revenue (Million), by End-user Industry 2024 & 2032
- Figure 21: South America Packaging Industry in South Africa Revenue Share (%), by End-user Industry 2024 & 2032
- Figure 22: South America Packaging Industry in South Africa Revenue (Million), by Country 2024 & 2032
- Figure 23: South America Packaging Industry in South Africa Revenue Share (%), by Country 2024 & 2032
- Figure 24: Europe Packaging Industry in South Africa Revenue (Million), by Product Type 2024 & 2032
- Figure 25: Europe Packaging Industry in South Africa Revenue Share (%), by Product Type 2024 & 2032
- Figure 26: Europe Packaging Industry in South Africa Revenue (Million), by Type of Plastic 2024 & 2032
- Figure 27: Europe Packaging Industry in South Africa Revenue Share (%), by Type of Plastic 2024 & 2032
- Figure 28: Europe Packaging Industry in South Africa Revenue (Million), by Material 2024 & 2032
- Figure 29: Europe Packaging Industry in South Africa Revenue Share (%), by Material 2024 & 2032
- Figure 30: Europe Packaging Industry in South Africa Revenue (Million), by End-user Industry 2024 & 2032
- Figure 31: Europe Packaging Industry in South Africa Revenue Share (%), by End-user Industry 2024 & 2032
- Figure 32: Europe Packaging Industry in South Africa Revenue (Million), by Country 2024 & 2032
- Figure 33: Europe Packaging Industry in South Africa Revenue Share (%), by Country 2024 & 2032
- Figure 34: Middle East & Africa Packaging Industry in South Africa Revenue (Million), by Product Type 2024 & 2032
- Figure 35: Middle East & Africa Packaging Industry in South Africa Revenue Share (%), by Product Type 2024 & 2032
- Figure 36: Middle East & Africa Packaging Industry in South Africa Revenue (Million), by Type of Plastic 2024 & 2032
- Figure 37: Middle East & Africa Packaging Industry in South Africa Revenue Share (%), by Type of Plastic 2024 & 2032
- Figure 38: Middle East & Africa Packaging Industry in South Africa Revenue (Million), by Material 2024 & 2032
- Figure 39: Middle East & Africa Packaging Industry in South Africa Revenue Share (%), by Material 2024 & 2032
- Figure 40: Middle East & Africa Packaging Industry in South Africa Revenue (Million), by End-user Industry 2024 & 2032
- Figure 41: Middle East & Africa Packaging Industry in South Africa Revenue Share (%), by End-user Industry 2024 & 2032
- Figure 42: Middle East & Africa Packaging Industry in South Africa Revenue (Million), by Country 2024 & 2032
- Figure 43: Middle East & Africa Packaging Industry in South Africa Revenue Share (%), by Country 2024 & 2032
- Figure 44: Asia Pacific Packaging Industry in South Africa Revenue (Million), by Product Type 2024 & 2032
- Figure 45: Asia Pacific Packaging Industry in South Africa Revenue Share (%), by Product Type 2024 & 2032
- Figure 46: Asia Pacific Packaging Industry in South Africa Revenue (Million), by Type of Plastic 2024 & 2032
- Figure 47: Asia Pacific Packaging Industry in South Africa Revenue Share (%), by Type of Plastic 2024 & 2032
- Figure 48: Asia Pacific Packaging Industry in South Africa Revenue (Million), by Material 2024 & 2032
- Figure 49: Asia Pacific Packaging Industry in South Africa Revenue Share (%), by Material 2024 & 2032
- Figure 50: Asia Pacific Packaging Industry in South Africa Revenue (Million), by End-user Industry 2024 & 2032
- Figure 51: Asia Pacific Packaging Industry in South Africa Revenue Share (%), by End-user Industry 2024 & 2032
- Figure 52: Asia Pacific Packaging Industry in South Africa Revenue (Million), by Country 2024 & 2032
- Figure 53: Asia Pacific Packaging Industry in South Africa Revenue Share (%), by Country 2024 & 2032
List of Tables
- Table 1: Global Packaging Industry in South Africa Revenue Million Forecast, by Region 2019 & 2032
- Table 2: Global Packaging Industry in South Africa Revenue Million Forecast, by Product Type 2019 & 2032
- Table 3: Global Packaging Industry in South Africa Revenue Million Forecast, by Type of Plastic 2019 & 2032
- Table 4: Global Packaging Industry in South Africa Revenue Million Forecast, by Material 2019 & 2032
- Table 5: Global Packaging Industry in South Africa Revenue Million Forecast, by End-user Industry 2019 & 2032
- Table 6: Global Packaging Industry in South Africa Revenue Million Forecast, by Region 2019 & 2032
- Table 7: Global Packaging Industry in South Africa Revenue Million Forecast, by Country 2019 & 2032
- Table 8: South Africa Packaging Industry in South Africa Revenue (Million) Forecast, by Application 2019 & 2032
- Table 9: Sudan Packaging Industry in South Africa Revenue (Million) Forecast, by Application 2019 & 2032
- Table 10: Uganda Packaging Industry in South Africa Revenue (Million) Forecast, by Application 2019 & 2032
- Table 11: Tanzania Packaging Industry in South Africa Revenue (Million) Forecast, by Application 2019 & 2032
- Table 12: Kenya Packaging Industry in South Africa Revenue (Million) Forecast, by Application 2019 & 2032
- Table 13: Rest of Africa Packaging Industry in South Africa Revenue (Million) Forecast, by Application 2019 & 2032
- Table 14: Global Packaging Industry in South Africa Revenue Million Forecast, by Product Type 2019 & 2032
- Table 15: Global Packaging Industry in South Africa Revenue Million Forecast, by Type of Plastic 2019 & 2032
- Table 16: Global Packaging Industry in South Africa Revenue Million Forecast, by Material 2019 & 2032
- Table 17: Global Packaging Industry in South Africa Revenue Million Forecast, by End-user Industry 2019 & 2032
- Table 18: Global Packaging Industry in South Africa Revenue Million Forecast, by Country 2019 & 2032
- Table 19: United States Packaging Industry in South Africa Revenue (Million) Forecast, by Application 2019 & 2032
- Table 20: Canada Packaging Industry in South Africa Revenue (Million) Forecast, by Application 2019 & 2032
- Table 21: Mexico Packaging Industry in South Africa Revenue (Million) Forecast, by Application 2019 & 2032
- Table 22: Global Packaging Industry in South Africa Revenue Million Forecast, by Product Type 2019 & 2032
- Table 23: Global Packaging Industry in South Africa Revenue Million Forecast, by Type of Plastic 2019 & 2032
- Table 24: Global Packaging Industry in South Africa Revenue Million Forecast, by Material 2019 & 2032
- Table 25: Global Packaging Industry in South Africa Revenue Million Forecast, by End-user Industry 2019 & 2032
- Table 26: Global Packaging Industry in South Africa Revenue Million Forecast, by Country 2019 & 2032
- Table 27: Brazil Packaging Industry in South Africa Revenue (Million) Forecast, by Application 2019 & 2032
- Table 28: Argentina Packaging Industry in South Africa Revenue (Million) Forecast, by Application 2019 & 2032
- Table 29: Rest of South America Packaging Industry in South Africa Revenue (Million) Forecast, by Application 2019 & 2032
- Table 30: Global Packaging Industry in South Africa Revenue Million Forecast, by Product Type 2019 & 2032
- Table 31: Global Packaging Industry in South Africa Revenue Million Forecast, by Type of Plastic 2019 & 2032
- Table 32: Global Packaging Industry in South Africa Revenue Million Forecast, by Material 2019 & 2032
- Table 33: Global Packaging Industry in South Africa Revenue Million Forecast, by End-user Industry 2019 & 2032
- Table 34: Global Packaging Industry in South Africa Revenue Million Forecast, by Country 2019 & 2032
- Table 35: United Kingdom Packaging Industry in South Africa Revenue (Million) Forecast, by Application 2019 & 2032
- Table 36: Germany Packaging Industry in South Africa Revenue (Million) Forecast, by Application 2019 & 2032
- Table 37: France Packaging Industry in South Africa Revenue (Million) Forecast, by Application 2019 & 2032
- Table 38: Italy Packaging Industry in South Africa Revenue (Million) Forecast, by Application 2019 & 2032
- Table 39: Spain Packaging Industry in South Africa Revenue (Million) Forecast, by Application 2019 & 2032
- Table 40: Russia Packaging Industry in South Africa Revenue (Million) Forecast, by Application 2019 & 2032
- Table 41: Benelux Packaging Industry in South Africa Revenue (Million) Forecast, by Application 2019 & 2032
- Table 42: Nordics Packaging Industry in South Africa Revenue (Million) Forecast, by Application 2019 & 2032
- Table 43: Rest of Europe Packaging Industry in South Africa Revenue (Million) Forecast, by Application 2019 & 2032
- Table 44: Global Packaging Industry in South Africa Revenue Million Forecast, by Product Type 2019 & 2032
- Table 45: Global Packaging Industry in South Africa Revenue Million Forecast, by Type of Plastic 2019 & 2032
- Table 46: Global Packaging Industry in South Africa Revenue Million Forecast, by Material 2019 & 2032
- Table 47: Global Packaging Industry in South Africa Revenue Million Forecast, by End-user Industry 2019 & 2032
- Table 48: Global Packaging Industry in South Africa Revenue Million Forecast, by Country 2019 & 2032
- Table 49: Turkey Packaging Industry in South Africa Revenue (Million) Forecast, by Application 2019 & 2032
- Table 50: Israel Packaging Industry in South Africa Revenue (Million) Forecast, by Application 2019 & 2032
- Table 51: GCC Packaging Industry in South Africa Revenue (Million) Forecast, by Application 2019 & 2032
- Table 52: North Africa Packaging Industry in South Africa Revenue (Million) Forecast, by Application 2019 & 2032
- Table 53: South Africa Packaging Industry in South Africa Revenue (Million) Forecast, by Application 2019 & 2032
- Table 54: Rest of Middle East & Africa Packaging Industry in South Africa Revenue (Million) Forecast, by Application 2019 & 2032
- Table 55: Global Packaging Industry in South Africa Revenue Million Forecast, by Product Type 2019 & 2032
- Table 56: Global Packaging Industry in South Africa Revenue Million Forecast, by Type of Plastic 2019 & 2032
- Table 57: Global Packaging Industry in South Africa Revenue Million Forecast, by Material 2019 & 2032
- Table 58: Global Packaging Industry in South Africa Revenue Million Forecast, by End-user Industry 2019 & 2032
- Table 59: Global Packaging Industry in South Africa Revenue Million Forecast, by Country 2019 & 2032
- Table 60: China Packaging Industry in South Africa Revenue (Million) Forecast, by Application 2019 & 2032
- Table 61: India Packaging Industry in South Africa Revenue (Million) Forecast, by Application 2019 & 2032
- Table 62: Japan Packaging Industry in South Africa Revenue (Million) Forecast, by Application 2019 & 2032
- Table 63: South Korea Packaging Industry in South Africa Revenue (Million) Forecast, by Application 2019 & 2032
- Table 64: ASEAN Packaging Industry in South Africa Revenue (Million) Forecast, by Application 2019 & 2032
- Table 65: Oceania Packaging Industry in South Africa Revenue (Million) Forecast, by Application 2019 & 2032
- Table 66: Rest of Asia Pacific Packaging Industry in South Africa Revenue (Million) Forecast, by Application 2019 & 2032
Frequently Asked Questions
1. What is the projected Compound Annual Growth Rate (CAGR) of the Packaging Industry in South Africa?
The projected CAGR is approximately 2.89%.
2. Which companies are prominent players in the Packaging Industry in South Africa?
Key companies in the market include Italpac (Pty) Ltd, RPC Astrapak Ltd, Nampak Ltd, Nioro Plastics (Pty) Ltd*List Not Exhaustive, Tetra Pak Ltd, Mondi PLC, Mpact Ltd, Amcor Limited, Sealed Air Corporation, Constantia Flexibles Corporation.
3. What are the main segments of the Packaging Industry in South Africa?
The market segments include Product Type, Type of Plastic, Material, End-user Industry.
4. Can you provide details about the market size?
The market size is estimated to be USD 2.59 Million as of 2022.
5. What are some drivers contributing to market growth?
Growing Demand for Consumer Goods; Favorable Packaging Properties Possessed by Plastic.
6. What are the notable trends driving market growth?
Aggressive Recycling Rates of Plastic Products within the Country and an increase in Waste Generation.
7. Are there any restraints impacting market growth?
Fluctuating Raw Material Prices.
8. Can you provide examples of recent developments in the market?
May 2021 - The country released a new regulation that requires any company or brand that makes or imports any form of plastic packaging for distribution in South Africa to pay an extended producer responsibility (EPR) fee per tonne from 5 May 2021. Strict government targets have been set for annual collection and recycling over the next five years, and the EPR is positioned to invest in collection infrastructure in the country. Existing producers are expected to register with the Department of Environment, Forestry, and Fisheries by November 2021.
9. What pricing options are available for accessing the report?
Pricing options include single-user, multi-user, and enterprise licenses priced at USD 3800, USD 4500, and USD 5800 respectively.
10. Is the market size provided in terms of value or volume?
The market size is provided in terms of value, measured in Million.
11. Are there any specific market keywords associated with the report?
Yes, the market keyword associated with the report is "Packaging Industry in South Africa," which aids in identifying and referencing the specific market segment covered.
12. How do I determine which pricing option suits my needs best?
The pricing options vary based on user requirements and access needs. Individual users may opt for single-user licenses, while businesses requiring broader access may choose multi-user or enterprise licenses for cost-effective access to the report.
13. Are there any additional resources or data provided in the Packaging Industry in South Africa report?
While the report offers comprehensive insights, it's advisable to review the specific contents or supplementary materials provided to ascertain if additional resources or data are available.
14. How can I stay updated on further developments or reports in the Packaging Industry in South Africa?
To stay informed about further developments, trends, and reports in the Packaging Industry in South Africa, consider subscribing to industry newsletters, following relevant companies and organizations, or regularly checking reputable industry news sources and publications.
Methodology
Step 1 - Identification of Relevant Samples Size from Population Database


Step 2 - Approaches for Defining Global Market Size (Value, Volume* & Price*)

Note*: In applicable scenarios
Step 3 - Data Sources
Primary Research
- Web Analytics
- Survey Reports
- Research Institute
- Latest Research Reports
- Opinion Leaders
Secondary Research
- Annual Reports
- White Paper
- Latest Press Release
- Industry Association
- Paid Database
- Investor Presentations

Step 4 - Data Triangulation
Involves using different sources of information in order to increase the validity of a study
These sources are likely to be stakeholders in a program - participants, other researchers, program staff, other community members, and so on.
Then we put all data in single framework & apply various statistical tools to find out the dynamic on the market.
During the analysis stage, feedback from the stakeholder groups would be compared to determine areas of agreement as well as areas of divergence
