

Key Insights
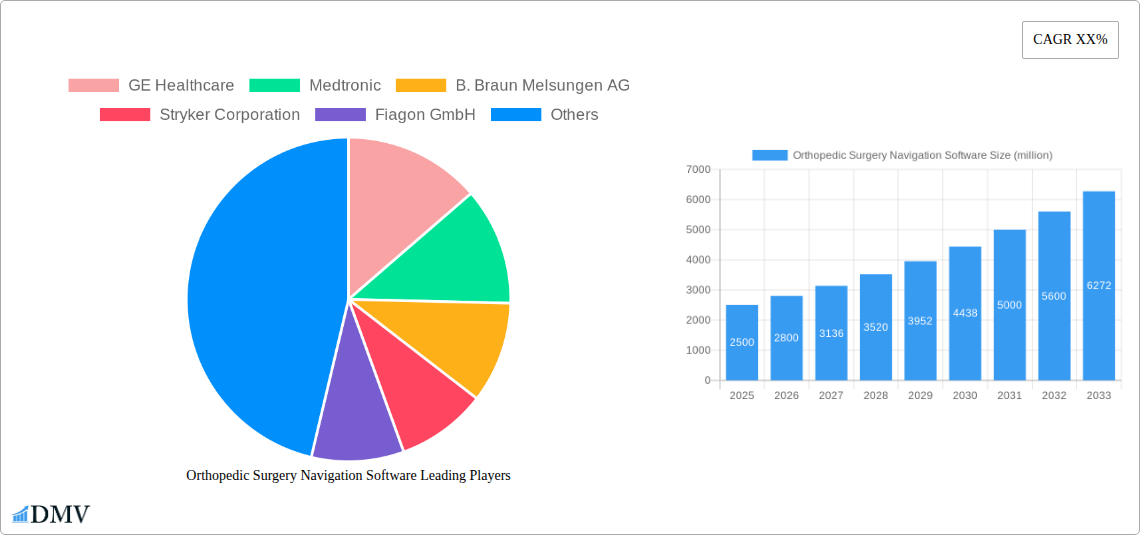
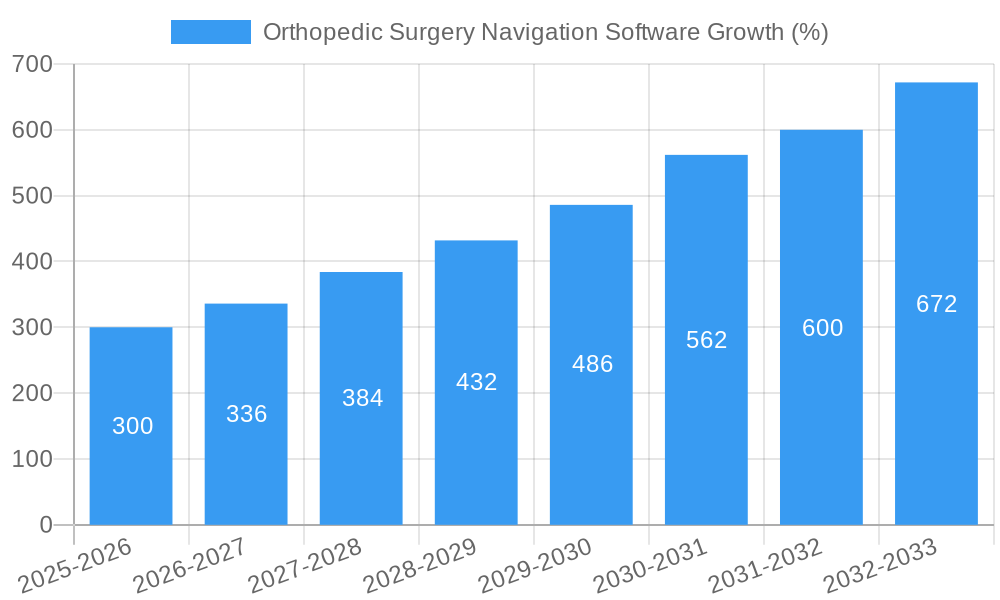
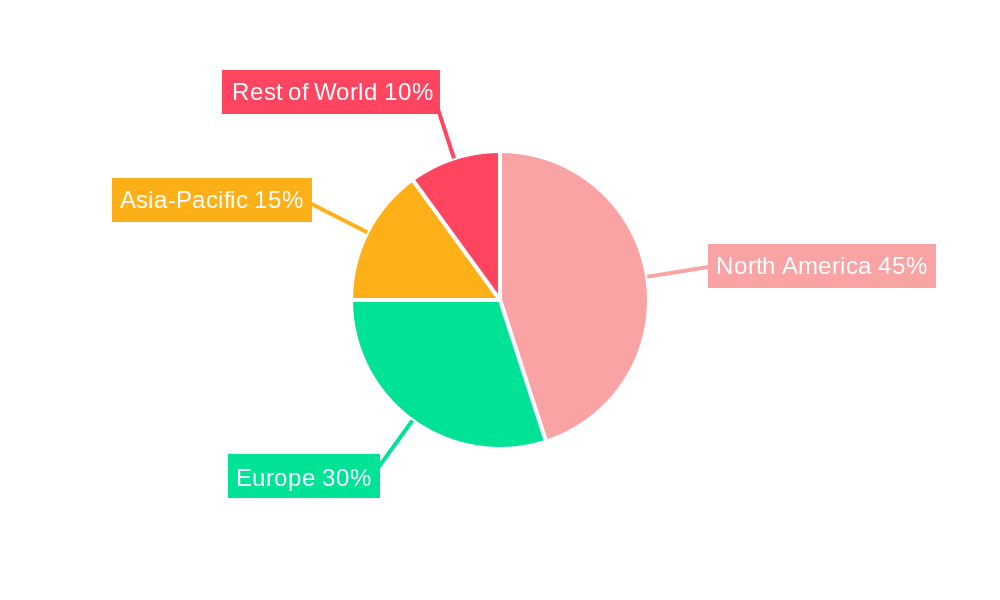
The orthopedic surgery navigation software market is experiencing robust growth, driven by the increasing prevalence of orthopedic procedures, a rising geriatric population susceptible to musculoskeletal disorders, and the growing demand for minimally invasive surgeries. Technological advancements, such as the integration of artificial intelligence and augmented reality, are further enhancing the accuracy and efficiency of these systems, leading to improved patient outcomes and reduced recovery times. The market is segmented by software type (e.g., image-guided surgery, robotic-assisted surgery), application (e.g., knee replacement, hip replacement, spine surgery), and end-user (e.g., hospitals, ambulatory surgical centers). While the high cost of these systems and the need for specialized training can pose challenges, the long-term benefits in terms of precision, reduced complications, and shorter hospital stays are fueling market expansion. We project a market size of $2.5 billion in 2025, growing at a compound annual growth rate (CAGR) of 12% to reach approximately $6 billion by 2033. Key players like GE Healthcare, Medtronic, and Stryker are actively investing in research and development to enhance their product offerings and maintain their competitive edge. The North American market currently holds a significant share, but regions like Asia-Pacific are witnessing rapid growth due to increasing healthcare infrastructure development and rising disposable incomes.
The competitive landscape is characterized by both established players and emerging companies. Larger corporations leverage their existing distribution networks and brand recognition to maintain market leadership. Meanwhile, smaller companies are focusing on niche applications and innovative technologies to gain market share. Future growth will be shaped by the integration of advanced imaging techniques, the development of more user-friendly interfaces, and the expansion of applications to other orthopedic procedures. Regulatory approvals and reimbursement policies also play a significant role in shaping market dynamics. Successful navigation software providers will need to focus on delivering superior clinical outcomes, cost-effectiveness, and ease of use to appeal to a broad range of healthcare professionals.
Orthopedic Surgery Navigation Software Market Report: A Comprehensive Analysis (2019-2033)
This insightful report provides a comprehensive analysis of the global Orthopedic Surgery Navigation Software market, projecting a market value exceeding $XX million by 2033. The study covers the period 2019-2033, with 2025 as the base and estimated year. It meticulously examines market trends, technological advancements, competitive landscapes, and future growth prospects, offering invaluable insights for stakeholders across the medical device and healthcare industries. Key players profiled include GE Healthcare, Medtronic, B. Braun Melsungen AG, Stryker Corporation, Fiagon GmbH, AllEarth Renewables, Amplitude Surgical, Scopis GmbH, Karl Storz GmbH & Co. Kg, and Brainlab.
Orthopedic Surgery Navigation Software Market Composition & Trends
The orthopedic surgery navigation software market demonstrates a moderately concentrated structure, with the top five players holding an estimated XX% market share in 2025. Innovation is driven by the need for enhanced surgical precision, minimally invasive procedures, and improved patient outcomes. Regulatory landscapes vary across regions, impacting market entry and product approvals. Substitute products include traditional surgical techniques, though the trend leans towards navigation systems for their accuracy benefits. End-users primarily comprise hospitals, orthopedic clinics, and ambulatory surgery centers. Significant M&A activity, with deal values exceeding $XX million in the past five years, indicates consolidation and technological expansion within the sector.
- Market Share Distribution (2025): Top 5 players - XX%; Others - XX%
- M&A Deal Value (2019-2024): >$XX million
- Key Regulatory Bodies: FDA (USA), EMA (Europe), etc.
Orthopedic Surgery Navigation Software Industry Evolution
The orthopedic surgery navigation software market has experienced a compound annual growth rate (CAGR) of XX% during the historical period (2019-2024), fueled by advancements in image processing, robotics, and AI integration. Adoption rates are increasing significantly, with a projected XX% rise in installations across hospitals globally by 2033. Consumer demand is driven by the preference for faster recovery times, reduced complications, and improved surgical outcomes. Technological advancements, including augmented reality (AR) and virtual reality (VR) integration, are further bolstering market growth. The integration of AI and machine learning algorithms is expected to further enhance the accuracy and efficiency of these systems in the forecast period (2025-2033), potentially leading to a CAGR of XX%.
Leading Regions, Countries, or Segments in Orthopedic Surgery Navigation Software
North America currently dominates the orthopedic surgery navigation software market, driven by high healthcare expenditure, robust technological infrastructure, and a strong regulatory framework.
- Key Drivers in North America:
- High adoption rate of advanced medical technologies.
- Significant investments in R&D by key players.
- Favorable reimbursement policies and supportive regulatory environment.
- Factors Contributing to North America's Dominance: The region's established healthcare infrastructure, combined with a high concentration of orthopedic surgery centers and a significant number of patients requiring orthopedic procedures, makes it a focal point for the market. Strong government support and private investment in healthcare also contribute to its leading position. Further, the presence of major market players with extensive R&D capabilities strengthens North America's position.
Europe and Asia-Pacific are experiencing substantial growth, fueled by increasing healthcare investments and expanding surgical volumes.
Orthopedic Surgery Navigation Software Product Innovations
Recent product innovations focus on miniaturization, improved image quality, enhanced user interfaces, and seamless integration with existing surgical workflows. The incorporation of AI-powered predictive analytics for enhanced surgical planning and intraoperative guidance is a notable development. These innovations deliver improved accuracy, reduced surgical time, and improved patient outcomes, offering unique selling propositions to healthcare providers.
Propelling Factors for Orthopedic Surgery Navigation Software Growth
Technological advancements, such as the integration of AI and machine learning, are key drivers of market growth. Rising healthcare expenditure and increasing prevalence of orthopedic conditions are creating significant demand. Favorable regulatory environments and government initiatives promoting minimally invasive procedures further propel market expansion.
Obstacles in the Orthopedic Surgery Navigation Software Market
High initial investment costs and the need for specialized training can hinder market penetration. Supply chain disruptions, particularly concerning critical components, pose a significant challenge. Intense competition from established players and emerging market entrants also creates pressure on pricing and profitability. The market also faces regulatory hurdles and variations in reimbursement policies across different geographical regions, slowing adoption.
Future Opportunities in Orthopedic Surgery Navigation Software
Expanding applications in minimally invasive procedures and emerging markets present significant growth opportunities. The integration of advanced imaging modalities and the development of user-friendly, cost-effective navigation systems will further drive market expansion. The adoption of cloud-based platforms and the development of personalized surgical plans offer avenues for future innovation.
Major Players in the Orthopedic Surgery Navigation Software Ecosystem
- GE Healthcare
- Medtronic
- B. Braun Melsungen AG
- Stryker Corporation
- Fiagon GmbH
- AllEarth Renewables
- Amplitude Surgical
- Scopis GmbH
- Karl Storz GmbH & Co. Kg
- Brainlab
Key Developments in Orthopedic Surgery Navigation Software Industry
- 2022 Q3: Stryker Corporation launched a new navigation system with AI-powered features.
- 2023 Q1: Medtronic announced a strategic partnership to integrate its navigation software with a leading robotic surgery platform.
- 2024 Q2: A significant merger between two smaller navigation software companies resulted in a larger market player. (Further details are needed to complete this section)
Strategic Orthopedic Surgery Navigation Software Market Forecast
The orthopedic surgery navigation software market is poised for significant growth, driven by technological advancements, increasing demand for minimally invasive procedures, and favorable regulatory support. The market is expected to witness substantial expansion in the coming years, particularly in emerging economies, creating lucrative opportunities for market players. Continued innovation in AI and machine learning integration will further enhance the precision and effectiveness of these systems, leading to enhanced patient outcomes and market expansion.
Orthopedic Surgery Navigation Software Segmentation
-
1. Application
- 1.1. Hospitals
- 1.2. Clinics
- 1.3. Others
-
2. Types
- 2.1. Electromagnetic Navigation Systems
- 2.2. Hybrid Navigation Systems
- 2.3. Optical Navigation Systems
- 2.4. Fluoroscopy-Based Navigation Systems
- 2.5. CT-Based Navigation Systems
Orthopedic Surgery Navigation Software Segmentation By Geography
-
1. North America
- 1.1. United States
- 1.2. Canada
- 1.3. Mexico
-
2. South America
- 2.1. Brazil
- 2.2. Argentina
- 2.3. Rest of South America
-
3. Europe
- 3.1. United Kingdom
- 3.2. Germany
- 3.3. France
- 3.4. Italy
- 3.5. Spain
- 3.6. Russia
- 3.7. Benelux
- 3.8. Nordics
- 3.9. Rest of Europe
-
4. Middle East & Africa
- 4.1. Turkey
- 4.2. Israel
- 4.3. GCC
- 4.4. North Africa
- 4.5. South Africa
- 4.6. Rest of Middle East & Africa
-
5. Asia Pacific
- 5.1. China
- 5.2. India
- 5.3. Japan
- 5.4. South Korea
- 5.5. ASEAN
- 5.6. Oceania
- 5.7. Rest of Asia Pacific
Orthopedic Surgery Navigation Software REPORT HIGHLIGHTS
| Aspects | Details |
|---|---|
| Study Period | 2019-2033 |
| Base Year | 2024 |
| Estimated Year | 2025 |
| Forecast Period | 2025-2033 |
| Historical Period | 2019-2024 |
| Growth Rate | CAGR of XX% from 2019-2033 |
| Segmentation |
|
Table of Contents
- 1. Introduction
- 1.1. Research Scope
- 1.2. Market Segmentation
- 1.3. Research Methodology
- 1.4. Definitions and Assumptions
- 2. Executive Summary
- 2.1. Introduction
- 3. Market Dynamics
- 3.1. Introduction
- 3.2. Market Drivers
- 3.3. Market Restrains
- 3.4. Market Trends
- 4. Market Factor Analysis
- 4.1. Porters Five Forces
- 4.2. Supply/Value Chain
- 4.3. PESTEL analysis
- 4.4. Market Entropy
- 4.5. Patent/Trademark Analysis
- 5. Global Orthopedic Surgery Navigation Software Analysis, Insights and Forecast, 2019-2031
- 5.1. Market Analysis, Insights and Forecast - by Application
- 5.1.1. Hospitals
- 5.1.2. Clinics
- 5.1.3. Others
- 5.2. Market Analysis, Insights and Forecast - by Types
- 5.2.1. Electromagnetic Navigation Systems
- 5.2.2. Hybrid Navigation Systems
- 5.2.3. Optical Navigation Systems
- 5.2.4. Fluoroscopy-Based Navigation Systems
- 5.2.5. CT-Based Navigation Systems
- 5.3. Market Analysis, Insights and Forecast - by Region
- 5.3.1. North America
- 5.3.2. South America
- 5.3.3. Europe
- 5.3.4. Middle East & Africa
- 5.3.5. Asia Pacific
- 5.1. Market Analysis, Insights and Forecast - by Application
- 6. North America Orthopedic Surgery Navigation Software Analysis, Insights and Forecast, 2019-2031
- 6.1. Market Analysis, Insights and Forecast - by Application
- 6.1.1. Hospitals
- 6.1.2. Clinics
- 6.1.3. Others
- 6.2. Market Analysis, Insights and Forecast - by Types
- 6.2.1. Electromagnetic Navigation Systems
- 6.2.2. Hybrid Navigation Systems
- 6.2.3. Optical Navigation Systems
- 6.2.4. Fluoroscopy-Based Navigation Systems
- 6.2.5. CT-Based Navigation Systems
- 6.1. Market Analysis, Insights and Forecast - by Application
- 7. South America Orthopedic Surgery Navigation Software Analysis, Insights and Forecast, 2019-2031
- 7.1. Market Analysis, Insights and Forecast - by Application
- 7.1.1. Hospitals
- 7.1.2. Clinics
- 7.1.3. Others
- 7.2. Market Analysis, Insights and Forecast - by Types
- 7.2.1. Electromagnetic Navigation Systems
- 7.2.2. Hybrid Navigation Systems
- 7.2.3. Optical Navigation Systems
- 7.2.4. Fluoroscopy-Based Navigation Systems
- 7.2.5. CT-Based Navigation Systems
- 7.1. Market Analysis, Insights and Forecast - by Application
- 8. Europe Orthopedic Surgery Navigation Software Analysis, Insights and Forecast, 2019-2031
- 8.1. Market Analysis, Insights and Forecast - by Application
- 8.1.1. Hospitals
- 8.1.2. Clinics
- 8.1.3. Others
- 8.2. Market Analysis, Insights and Forecast - by Types
- 8.2.1. Electromagnetic Navigation Systems
- 8.2.2. Hybrid Navigation Systems
- 8.2.3. Optical Navigation Systems
- 8.2.4. Fluoroscopy-Based Navigation Systems
- 8.2.5. CT-Based Navigation Systems
- 8.1. Market Analysis, Insights and Forecast - by Application
- 9. Middle East & Africa Orthopedic Surgery Navigation Software Analysis, Insights and Forecast, 2019-2031
- 9.1. Market Analysis, Insights and Forecast - by Application
- 9.1.1. Hospitals
- 9.1.2. Clinics
- 9.1.3. Others
- 9.2. Market Analysis, Insights and Forecast - by Types
- 9.2.1. Electromagnetic Navigation Systems
- 9.2.2. Hybrid Navigation Systems
- 9.2.3. Optical Navigation Systems
- 9.2.4. Fluoroscopy-Based Navigation Systems
- 9.2.5. CT-Based Navigation Systems
- 9.1. Market Analysis, Insights and Forecast - by Application
- 10. Asia Pacific Orthopedic Surgery Navigation Software Analysis, Insights and Forecast, 2019-2031
- 10.1. Market Analysis, Insights and Forecast - by Application
- 10.1.1. Hospitals
- 10.1.2. Clinics
- 10.1.3. Others
- 10.2. Market Analysis, Insights and Forecast - by Types
- 10.2.1. Electromagnetic Navigation Systems
- 10.2.2. Hybrid Navigation Systems
- 10.2.3. Optical Navigation Systems
- 10.2.4. Fluoroscopy-Based Navigation Systems
- 10.2.5. CT-Based Navigation Systems
- 10.1. Market Analysis, Insights and Forecast - by Application
- 11. Competitive Analysis
- 11.1. Global Market Share Analysis 2024
- 11.2. Company Profiles
- 11.2.1 GE Healthcare
- 11.2.1.1. Overview
- 11.2.1.2. Products
- 11.2.1.3. SWOT Analysis
- 11.2.1.4. Recent Developments
- 11.2.1.5. Financials (Based on Availability)
- 11.2.2 Medtronic
- 11.2.2.1. Overview
- 11.2.2.2. Products
- 11.2.2.3. SWOT Analysis
- 11.2.2.4. Recent Developments
- 11.2.2.5. Financials (Based on Availability)
- 11.2.3 B. Braun Melsungen AG
- 11.2.3.1. Overview
- 11.2.3.2. Products
- 11.2.3.3. SWOT Analysis
- 11.2.3.4. Recent Developments
- 11.2.3.5. Financials (Based on Availability)
- 11.2.4 Stryker Corporation
- 11.2.4.1. Overview
- 11.2.4.2. Products
- 11.2.4.3. SWOT Analysis
- 11.2.4.4. Recent Developments
- 11.2.4.5. Financials (Based on Availability)
- 11.2.5 Fiagon GmbH
- 11.2.5.1. Overview
- 11.2.5.2. Products
- 11.2.5.3. SWOT Analysis
- 11.2.5.4. Recent Developments
- 11.2.5.5. Financials (Based on Availability)
- 11.2.6 AllEarth Renewables
- 11.2.6.1. Overview
- 11.2.6.2. Products
- 11.2.6.3. SWOT Analysis
- 11.2.6.4. Recent Developments
- 11.2.6.5. Financials (Based on Availability)
- 11.2.7 Amplitude Surgical
- 11.2.7.1. Overview
- 11.2.7.2. Products
- 11.2.7.3. SWOT Analysis
- 11.2.7.4. Recent Developments
- 11.2.7.5. Financials (Based on Availability)
- 11.2.8 Scopis GmbH
- 11.2.8.1. Overview
- 11.2.8.2. Products
- 11.2.8.3. SWOT Analysis
- 11.2.8.4. Recent Developments
- 11.2.8.5. Financials (Based on Availability)
- 11.2.9 Karl Storz GmbH & Co. Kg
- 11.2.9.1. Overview
- 11.2.9.2. Products
- 11.2.9.3. SWOT Analysis
- 11.2.9.4. Recent Developments
- 11.2.9.5. Financials (Based on Availability)
- 11.2.10 Brainlab
- 11.2.10.1. Overview
- 11.2.10.2. Products
- 11.2.10.3. SWOT Analysis
- 11.2.10.4. Recent Developments
- 11.2.10.5. Financials (Based on Availability)
- 11.2.1 GE Healthcare
List of Figures
- Figure 1: Global Orthopedic Surgery Navigation Software Revenue Breakdown (million, %) by Region 2024 & 2032
- Figure 2: North America Orthopedic Surgery Navigation Software Revenue (million), by Application 2024 & 2032
- Figure 3: North America Orthopedic Surgery Navigation Software Revenue Share (%), by Application 2024 & 2032
- Figure 4: North America Orthopedic Surgery Navigation Software Revenue (million), by Types 2024 & 2032
- Figure 5: North America Orthopedic Surgery Navigation Software Revenue Share (%), by Types 2024 & 2032
- Figure 6: North America Orthopedic Surgery Navigation Software Revenue (million), by Country 2024 & 2032
- Figure 7: North America Orthopedic Surgery Navigation Software Revenue Share (%), by Country 2024 & 2032
- Figure 8: South America Orthopedic Surgery Navigation Software Revenue (million), by Application 2024 & 2032
- Figure 9: South America Orthopedic Surgery Navigation Software Revenue Share (%), by Application 2024 & 2032
- Figure 10: South America Orthopedic Surgery Navigation Software Revenue (million), by Types 2024 & 2032
- Figure 11: South America Orthopedic Surgery Navigation Software Revenue Share (%), by Types 2024 & 2032
- Figure 12: South America Orthopedic Surgery Navigation Software Revenue (million), by Country 2024 & 2032
- Figure 13: South America Orthopedic Surgery Navigation Software Revenue Share (%), by Country 2024 & 2032
- Figure 14: Europe Orthopedic Surgery Navigation Software Revenue (million), by Application 2024 & 2032
- Figure 15: Europe Orthopedic Surgery Navigation Software Revenue Share (%), by Application 2024 & 2032
- Figure 16: Europe Orthopedic Surgery Navigation Software Revenue (million), by Types 2024 & 2032
- Figure 17: Europe Orthopedic Surgery Navigation Software Revenue Share (%), by Types 2024 & 2032
- Figure 18: Europe Orthopedic Surgery Navigation Software Revenue (million), by Country 2024 & 2032
- Figure 19: Europe Orthopedic Surgery Navigation Software Revenue Share (%), by Country 2024 & 2032
- Figure 20: Middle East & Africa Orthopedic Surgery Navigation Software Revenue (million), by Application 2024 & 2032
- Figure 21: Middle East & Africa Orthopedic Surgery Navigation Software Revenue Share (%), by Application 2024 & 2032
- Figure 22: Middle East & Africa Orthopedic Surgery Navigation Software Revenue (million), by Types 2024 & 2032
- Figure 23: Middle East & Africa Orthopedic Surgery Navigation Software Revenue Share (%), by Types 2024 & 2032
- Figure 24: Middle East & Africa Orthopedic Surgery Navigation Software Revenue (million), by Country 2024 & 2032
- Figure 25: Middle East & Africa Orthopedic Surgery Navigation Software Revenue Share (%), by Country 2024 & 2032
- Figure 26: Asia Pacific Orthopedic Surgery Navigation Software Revenue (million), by Application 2024 & 2032
- Figure 27: Asia Pacific Orthopedic Surgery Navigation Software Revenue Share (%), by Application 2024 & 2032
- Figure 28: Asia Pacific Orthopedic Surgery Navigation Software Revenue (million), by Types 2024 & 2032
- Figure 29: Asia Pacific Orthopedic Surgery Navigation Software Revenue Share (%), by Types 2024 & 2032
- Figure 30: Asia Pacific Orthopedic Surgery Navigation Software Revenue (million), by Country 2024 & 2032
- Figure 31: Asia Pacific Orthopedic Surgery Navigation Software Revenue Share (%), by Country 2024 & 2032
List of Tables
- Table 1: Global Orthopedic Surgery Navigation Software Revenue million Forecast, by Region 2019 & 2032
- Table 2: Global Orthopedic Surgery Navigation Software Revenue million Forecast, by Application 2019 & 2032
- Table 3: Global Orthopedic Surgery Navigation Software Revenue million Forecast, by Types 2019 & 2032
- Table 4: Global Orthopedic Surgery Navigation Software Revenue million Forecast, by Region 2019 & 2032
- Table 5: Global Orthopedic Surgery Navigation Software Revenue million Forecast, by Application 2019 & 2032
- Table 6: Global Orthopedic Surgery Navigation Software Revenue million Forecast, by Types 2019 & 2032
- Table 7: Global Orthopedic Surgery Navigation Software Revenue million Forecast, by Country 2019 & 2032
- Table 8: United States Orthopedic Surgery Navigation Software Revenue (million) Forecast, by Application 2019 & 2032
- Table 9: Canada Orthopedic Surgery Navigation Software Revenue (million) Forecast, by Application 2019 & 2032
- Table 10: Mexico Orthopedic Surgery Navigation Software Revenue (million) Forecast, by Application 2019 & 2032
- Table 11: Global Orthopedic Surgery Navigation Software Revenue million Forecast, by Application 2019 & 2032
- Table 12: Global Orthopedic Surgery Navigation Software Revenue million Forecast, by Types 2019 & 2032
- Table 13: Global Orthopedic Surgery Navigation Software Revenue million Forecast, by Country 2019 & 2032
- Table 14: Brazil Orthopedic Surgery Navigation Software Revenue (million) Forecast, by Application 2019 & 2032
- Table 15: Argentina Orthopedic Surgery Navigation Software Revenue (million) Forecast, by Application 2019 & 2032
- Table 16: Rest of South America Orthopedic Surgery Navigation Software Revenue (million) Forecast, by Application 2019 & 2032
- Table 17: Global Orthopedic Surgery Navigation Software Revenue million Forecast, by Application 2019 & 2032
- Table 18: Global Orthopedic Surgery Navigation Software Revenue million Forecast, by Types 2019 & 2032
- Table 19: Global Orthopedic Surgery Navigation Software Revenue million Forecast, by Country 2019 & 2032
- Table 20: United Kingdom Orthopedic Surgery Navigation Software Revenue (million) Forecast, by Application 2019 & 2032
- Table 21: Germany Orthopedic Surgery Navigation Software Revenue (million) Forecast, by Application 2019 & 2032
- Table 22: France Orthopedic Surgery Navigation Software Revenue (million) Forecast, by Application 2019 & 2032
- Table 23: Italy Orthopedic Surgery Navigation Software Revenue (million) Forecast, by Application 2019 & 2032
- Table 24: Spain Orthopedic Surgery Navigation Software Revenue (million) Forecast, by Application 2019 & 2032
- Table 25: Russia Orthopedic Surgery Navigation Software Revenue (million) Forecast, by Application 2019 & 2032
- Table 26: Benelux Orthopedic Surgery Navigation Software Revenue (million) Forecast, by Application 2019 & 2032
- Table 27: Nordics Orthopedic Surgery Navigation Software Revenue (million) Forecast, by Application 2019 & 2032
- Table 28: Rest of Europe Orthopedic Surgery Navigation Software Revenue (million) Forecast, by Application 2019 & 2032
- Table 29: Global Orthopedic Surgery Navigation Software Revenue million Forecast, by Application 2019 & 2032
- Table 30: Global Orthopedic Surgery Navigation Software Revenue million Forecast, by Types 2019 & 2032
- Table 31: Global Orthopedic Surgery Navigation Software Revenue million Forecast, by Country 2019 & 2032
- Table 32: Turkey Orthopedic Surgery Navigation Software Revenue (million) Forecast, by Application 2019 & 2032
- Table 33: Israel Orthopedic Surgery Navigation Software Revenue (million) Forecast, by Application 2019 & 2032
- Table 34: GCC Orthopedic Surgery Navigation Software Revenue (million) Forecast, by Application 2019 & 2032
- Table 35: North Africa Orthopedic Surgery Navigation Software Revenue (million) Forecast, by Application 2019 & 2032
- Table 36: South Africa Orthopedic Surgery Navigation Software Revenue (million) Forecast, by Application 2019 & 2032
- Table 37: Rest of Middle East & Africa Orthopedic Surgery Navigation Software Revenue (million) Forecast, by Application 2019 & 2032
- Table 38: Global Orthopedic Surgery Navigation Software Revenue million Forecast, by Application 2019 & 2032
- Table 39: Global Orthopedic Surgery Navigation Software Revenue million Forecast, by Types 2019 & 2032
- Table 40: Global Orthopedic Surgery Navigation Software Revenue million Forecast, by Country 2019 & 2032
- Table 41: China Orthopedic Surgery Navigation Software Revenue (million) Forecast, by Application 2019 & 2032
- Table 42: India Orthopedic Surgery Navigation Software Revenue (million) Forecast, by Application 2019 & 2032
- Table 43: Japan Orthopedic Surgery Navigation Software Revenue (million) Forecast, by Application 2019 & 2032
- Table 44: South Korea Orthopedic Surgery Navigation Software Revenue (million) Forecast, by Application 2019 & 2032
- Table 45: ASEAN Orthopedic Surgery Navigation Software Revenue (million) Forecast, by Application 2019 & 2032
- Table 46: Oceania Orthopedic Surgery Navigation Software Revenue (million) Forecast, by Application 2019 & 2032
- Table 47: Rest of Asia Pacific Orthopedic Surgery Navigation Software Revenue (million) Forecast, by Application 2019 & 2032
Frequently Asked Questions
1. What is the projected Compound Annual Growth Rate (CAGR) of the Orthopedic Surgery Navigation Software?
The projected CAGR is approximately XX%.
2. Which companies are prominent players in the Orthopedic Surgery Navigation Software?
Key companies in the market include GE Healthcare, Medtronic, B. Braun Melsungen AG, Stryker Corporation, Fiagon GmbH, AllEarth Renewables, Amplitude Surgical, Scopis GmbH, Karl Storz GmbH & Co. Kg, Brainlab.
3. What are the main segments of the Orthopedic Surgery Navigation Software?
The market segments include Application, Types.
4. Can you provide details about the market size?
The market size is estimated to be USD XXX million as of 2022.
5. What are some drivers contributing to market growth?
N/A
6. What are the notable trends driving market growth?
N/A
7. Are there any restraints impacting market growth?
N/A
8. Can you provide examples of recent developments in the market?
N/A
9. What pricing options are available for accessing the report?
Pricing options include single-user, multi-user, and enterprise licenses priced at USD 2900.00, USD 4350.00, and USD 5800.00 respectively.
10. Is the market size provided in terms of value or volume?
The market size is provided in terms of value, measured in million.
11. Are there any specific market keywords associated with the report?
Yes, the market keyword associated with the report is "Orthopedic Surgery Navigation Software," which aids in identifying and referencing the specific market segment covered.
12. How do I determine which pricing option suits my needs best?
The pricing options vary based on user requirements and access needs. Individual users may opt for single-user licenses, while businesses requiring broader access may choose multi-user or enterprise licenses for cost-effective access to the report.
13. Are there any additional resources or data provided in the Orthopedic Surgery Navigation Software report?
While the report offers comprehensive insights, it's advisable to review the specific contents or supplementary materials provided to ascertain if additional resources or data are available.
14. How can I stay updated on further developments or reports in the Orthopedic Surgery Navigation Software?
To stay informed about further developments, trends, and reports in the Orthopedic Surgery Navigation Software, consider subscribing to industry newsletters, following relevant companies and organizations, or regularly checking reputable industry news sources and publications.
Methodology
Step 1 - Identification of Relevant Samples Size from Population Database


Step 2 - Approaches for Defining Global Market Size (Value, Volume* & Price*)

Note*: In applicable scenarios
Step 3 - Data Sources
Primary Research
- Web Analytics
- Survey Reports
- Research Institute
- Latest Research Reports
- Opinion Leaders
Secondary Research
- Annual Reports
- White Paper
- Latest Press Release
- Industry Association
- Paid Database
- Investor Presentations

Step 4 - Data Triangulation
Involves using different sources of information in order to increase the validity of a study
These sources are likely to be stakeholders in a program - participants, other researchers, program staff, other community members, and so on.
Then we put all data in single framework & apply various statistical tools to find out the dynamic on the market.
During the analysis stage, feedback from the stakeholder groups would be compared to determine areas of agreement as well as areas of divergence
