

Key Insights
The global market for non-destructive testing (NDT) services in the materials industry is experiencing robust growth, driven by increasing demand for quality control and assurance across diverse sectors like manufacturing, construction, and energy. The rising adoption of advanced NDT techniques, such as ultrasonic testing, radiographic testing, and magnetic particle inspection, is a key factor fueling this expansion. Stringent regulatory requirements concerning product safety and reliability, particularly in sectors like aerospace and automotive, are further propelling market demand. The industry is witnessing a shift towards more automated and digitally enhanced NDT solutions, improving efficiency and accuracy. This trend is supported by investments in research and development across leading companies like DEKRA, TÜV SÜD Group, and SGS Group, who are actively expanding their service portfolios and geographical reach. While the initial investment in advanced technologies can be a restraint, the long-term benefits in terms of reduced costs associated with defects and improved safety outweigh the initial investment.
Competition in this market is intense, with numerous established players and emerging specialized firms vying for market share. The market's future growth will likely be influenced by several factors, including the pace of technological innovation, the adoption of Industry 4.0 technologies, and global economic conditions. The increasing need for infrastructure development and maintenance globally, especially in developing economies, will create considerable opportunities for the expansion of NDT services. Furthermore, increasing awareness of the importance of safety and quality control across various industries should sustain the high demand for reliable and efficient NDT solutions. Sustained growth is projected through 2033, with a focus on niche applications and emerging technologies driving further specialization within the sector. Given the data, we can assume a moderate growth trend reflecting both market maturity and continued innovation within the sector.
Non-destructive Testing (NDT) and Inspection, and Third-Party Inspection (TIC) Services Market Report: 2019-2033
This comprehensive report provides a detailed analysis of the Non-destructive TIC Service for Material market, offering invaluable insights for stakeholders across the value chain. The study period spans from 2019 to 2033, with 2025 serving as both the base and estimated year. The forecast period covers 2025-2033, while the historical period encompasses 2019-2024. This report projects a market value exceeding $XX million by 2033, driven by significant technological advancements and increasing demand across diverse industries.
Non-destructive TIC Service for Material Market Composition & Trends
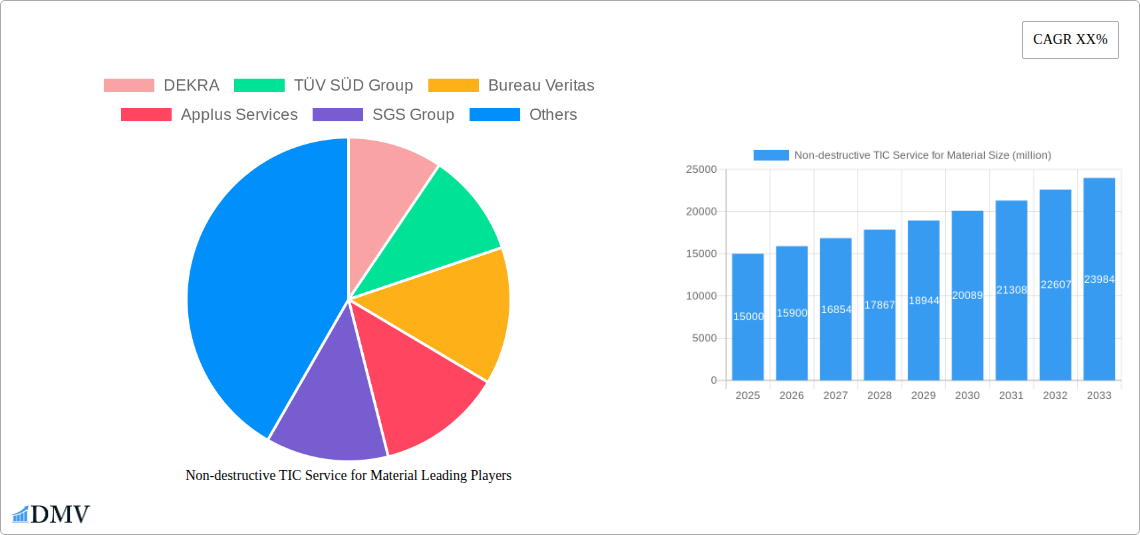
The Non-destructive TIC Service for Material market is characterized by a moderately concentrated landscape, with key players such as DEKRA, TÜV SÜD Group, Bureau Veritas, Applus Services, SGS Group, Intertek Group, TÜV Rheinland Group, TÜV Nord Group, and Element Materials holding significant market share. The exact distribution is dynamic, with estimates suggesting a combined market share of approximately 60% in 2025. Innovation is primarily driven by advancements in testing technologies, including improved sensor capabilities and AI-powered data analysis. Stringent regulatory frameworks, particularly concerning safety and quality, are shaping market practices. Substitute products are limited, with NDT methods often being the only viable option for certain applications. End-users span diverse sectors, including automotive, aerospace, construction, and energy. M&A activity has been relatively moderate in recent years, with deal values averaging $XX million per transaction, primarily focused on expanding service offerings and geographical reach.
- Market Share Distribution (2025): DEKRA (15%), TÜV SÜD Group (12%), Bureau Veritas (10%), Applus Services (8%), SGS Group (7%), Intertek Group (6%), TÜV Rheinland Group (5%), TÜV Nord Group (4%), Element Materials (3%), Others (30%).
- M&A Activity (2019-2024): Average deal value: $XX million; Total deal value: $XX million.
- Regulatory Landscape: Stringent safety regulations, particularly in sectors like aerospace and energy, are driving demand for NDT services.
Non-destructive TIC Service for Material Industry Evolution
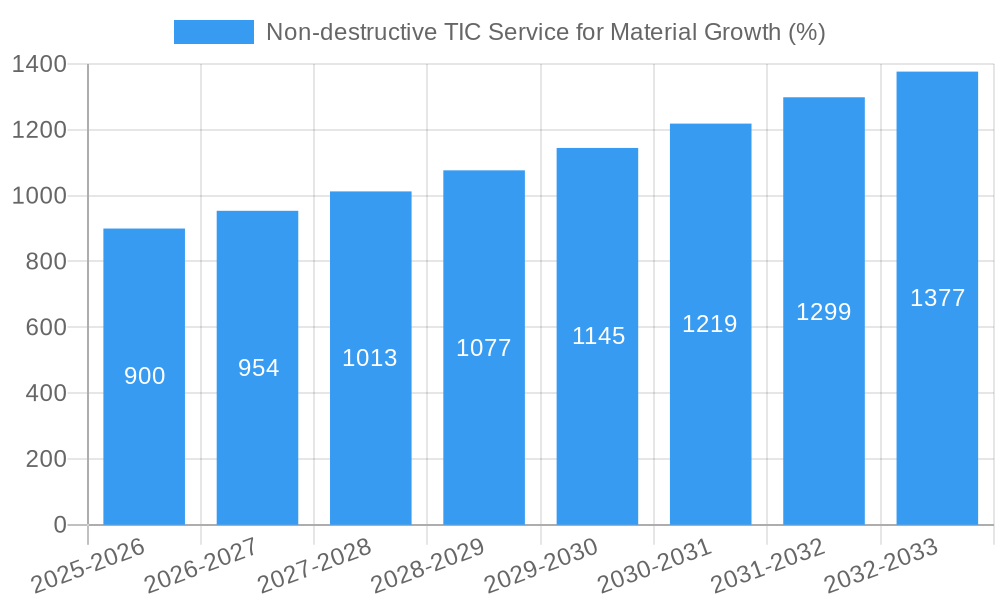
The Non-destructive TIC Service for Material market exhibits a steady growth trajectory, projected to expand at a CAGR of XX% during the forecast period (2025-2033). This growth is fueled by several factors, including increasing industrialization across emerging economies, stricter quality control standards, and rising demand for advanced materials requiring sophisticated testing methods. Technological advancements, such as the adoption of advanced imaging techniques and automation, are enhancing the efficiency and accuracy of NDT services. Furthermore, shifting consumer preferences toward higher quality and safety are indirectly boosting demand. The adoption of digitalization and data analytics is also transforming the industry, allowing for better data management, remote inspections, and predictive maintenance capabilities. The market is witnessing a growing demand for specialized NDT services catered to specific industry needs, further diversifying service offerings.
- Market Growth Rate (CAGR, 2025-2033): XX%
- Adoption of AI-powered NDT solutions (2025): XX%
Leading Regions, Countries, or Segments in Non-destructive TIC Service for Material
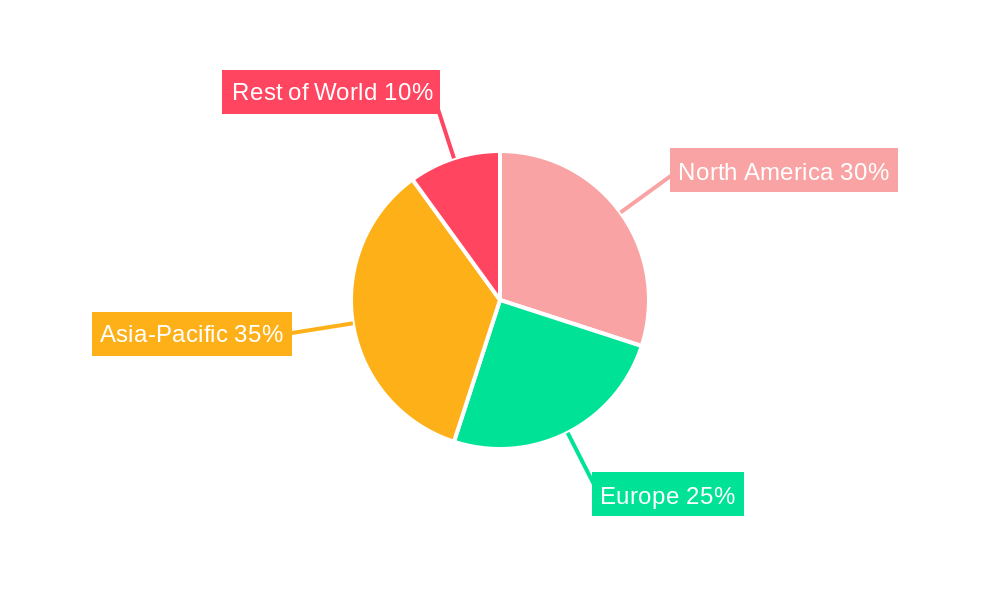
North America currently dominates the Non-destructive TIC Service for Material market, driven by factors such as robust industrial infrastructure, high adoption of advanced technologies, and stringent regulatory compliance standards. Europe follows closely behind, fueled by a strong manufacturing sector and high investment in infrastructure development. Asia-Pacific is projected to witness significant growth in the coming years due to rapid industrialization and rising demand for quality assurance.
- Key Drivers for North American Dominance: High investment in R&D, strong regulatory frameworks, and well-established industrial infrastructure.
- Key Drivers for European Growth: Established manufacturing base, focus on sustainable practices, and government support for NDT adoption.
- Key Drivers for Asia-Pacific Growth: Rapid industrialization, rising disposable incomes, and increased focus on infrastructure development.
Non-destructive TIC Service for Material Product Innovations
Recent innovations in the Non-destructive TIC Service for Material sector include the development of more portable and user-friendly equipment, the integration of AI and machine learning for automated defect detection, and the adoption of advanced imaging techniques, such as 3D scanning and thermography, enabling faster and more precise assessments. These advancements improve efficiency, reduce costs, and enhance the overall quality of NDT services. Specific examples include handheld ultrasonic devices with improved image clarity and automated defect classification algorithms that streamline analysis. Unique selling propositions revolve around increased speed, accuracy, and reduced operational costs.
Propelling Factors for Non-destructive TIC Service for Material Growth
Several factors propel the growth of the Non-destructive TIC Service for Material market. Technological advancements, particularly in sensor technology and data analysis, enhance accuracy and efficiency. Economic growth, especially in developing nations, fuels infrastructure development and industrial expansion, leading to increased demand for quality assurance services. Finally, stringent regulatory frameworks mandating NDT for various applications drive market growth.
Obstacles in the Non-destructive TIC Service for Material Market
The Non-destructive TIC Service for Material market faces several challenges. Regulatory compliance can be complex and costly, while supply chain disruptions can impact the availability of crucial equipment and materials. Intense competition among established players and new entrants creates pricing pressures.
Future Opportunities in Non-destructive TIC Service for Material
Future opportunities lie in expanding into new markets such as renewable energy, advanced materials, and nanotechnology. The integration of digitalization, AI, and IoT into NDT services offers potential for improved data analysis and remote inspection capabilities. There is also growth potential in developing specialized NDT solutions to address the unique challenges of emerging industries.
Major Players in the Non-destructive TIC Service for Material Ecosystem
- DEKRA
- TÜV SÜD Group
- Bureau Veritas
- Applus Services
- SGS Group
- Intertek Group
- TÜV Rheinland Group
- TÜV Nord Group
- Element Materials
Key Developments in Non-destructive TIC Service for Material Industry
- 2022 Q4: SGS Group launched a new AI-powered defect detection system for its ultrasonic testing services.
- 2023 Q1: Bureau Veritas acquired a smaller NDT specialist, expanding its service portfolio in the aerospace sector.
- 2023 Q3: TÜV SÜD Group introduced a new training program for NDT technicians, aimed at addressing the growing skills gap in the industry. (Further updates to be added as available)
Strategic Non-destructive TIC Service for Material Market Forecast
The Non-destructive TIC Service for Material market is poised for robust growth over the next decade, driven by sustained technological advancements, rising industrial activity, and stringent regulatory requirements. Emerging opportunities in new markets and applications, coupled with the integration of innovative technologies, will further fuel market expansion. The market's projected value exceeding $XX million by 2033 underscores its significant potential.
Non-destructive TIC Service for Material Segmentation
-
1. Application
- 1.1. Transportation
- 1.2. Construction
- 1.3. Others
-
2. Types
- 2.1. Onsite
- 2.2. Offsite
Non-destructive TIC Service for Material Segmentation By Geography
-
1. North America
- 1.1. United States
- 1.2. Canada
- 1.3. Mexico
-
2. South America
- 2.1. Brazil
- 2.2. Argentina
- 2.3. Rest of South America
-
3. Europe
- 3.1. United Kingdom
- 3.2. Germany
- 3.3. France
- 3.4. Italy
- 3.5. Spain
- 3.6. Russia
- 3.7. Benelux
- 3.8. Nordics
- 3.9. Rest of Europe
-
4. Middle East & Africa
- 4.1. Turkey
- 4.2. Israel
- 4.3. GCC
- 4.4. North Africa
- 4.5. South Africa
- 4.6. Rest of Middle East & Africa
-
5. Asia Pacific
- 5.1. China
- 5.2. India
- 5.3. Japan
- 5.4. South Korea
- 5.5. ASEAN
- 5.6. Oceania
- 5.7. Rest of Asia Pacific
Non-destructive TIC Service for Material REPORT HIGHLIGHTS
| Aspects | Details |
|---|---|
| Study Period | 2019-2033 |
| Base Year | 2024 |
| Estimated Year | 2025 |
| Forecast Period | 2025-2033 |
| Historical Period | 2019-2024 |
| Growth Rate | CAGR of XX% from 2019-2033 |
| Segmentation |
|
Table of Contents
- 1. Introduction
- 1.1. Research Scope
- 1.2. Market Segmentation
- 1.3. Research Methodology
- 1.4. Definitions and Assumptions
- 2. Executive Summary
- 2.1. Introduction
- 3. Market Dynamics
- 3.1. Introduction
- 3.2. Market Drivers
- 3.3. Market Restrains
- 3.4. Market Trends
- 4. Market Factor Analysis
- 4.1. Porters Five Forces
- 4.2. Supply/Value Chain
- 4.3. PESTEL analysis
- 4.4. Market Entropy
- 4.5. Patent/Trademark Analysis
- 5. Global Non-destructive TIC Service for Material Analysis, Insights and Forecast, 2019-2031
- 5.1. Market Analysis, Insights and Forecast - by Application
- 5.1.1. Transportation
- 5.1.2. Construction
- 5.1.3. Others
- 5.2. Market Analysis, Insights and Forecast - by Types
- 5.2.1. Onsite
- 5.2.2. Offsite
- 5.3. Market Analysis, Insights and Forecast - by Region
- 5.3.1. North America
- 5.3.2. South America
- 5.3.3. Europe
- 5.3.4. Middle East & Africa
- 5.3.5. Asia Pacific
- 5.1. Market Analysis, Insights and Forecast - by Application
- 6. North America Non-destructive TIC Service for Material Analysis, Insights and Forecast, 2019-2031
- 6.1. Market Analysis, Insights and Forecast - by Application
- 6.1.1. Transportation
- 6.1.2. Construction
- 6.1.3. Others
- 6.2. Market Analysis, Insights and Forecast - by Types
- 6.2.1. Onsite
- 6.2.2. Offsite
- 6.1. Market Analysis, Insights and Forecast - by Application
- 7. South America Non-destructive TIC Service for Material Analysis, Insights and Forecast, 2019-2031
- 7.1. Market Analysis, Insights and Forecast - by Application
- 7.1.1. Transportation
- 7.1.2. Construction
- 7.1.3. Others
- 7.2. Market Analysis, Insights and Forecast - by Types
- 7.2.1. Onsite
- 7.2.2. Offsite
- 7.1. Market Analysis, Insights and Forecast - by Application
- 8. Europe Non-destructive TIC Service for Material Analysis, Insights and Forecast, 2019-2031
- 8.1. Market Analysis, Insights and Forecast - by Application
- 8.1.1. Transportation
- 8.1.2. Construction
- 8.1.3. Others
- 8.2. Market Analysis, Insights and Forecast - by Types
- 8.2.1. Onsite
- 8.2.2. Offsite
- 8.1. Market Analysis, Insights and Forecast - by Application
- 9. Middle East & Africa Non-destructive TIC Service for Material Analysis, Insights and Forecast, 2019-2031
- 9.1. Market Analysis, Insights and Forecast - by Application
- 9.1.1. Transportation
- 9.1.2. Construction
- 9.1.3. Others
- 9.2. Market Analysis, Insights and Forecast - by Types
- 9.2.1. Onsite
- 9.2.2. Offsite
- 9.1. Market Analysis, Insights and Forecast - by Application
- 10. Asia Pacific Non-destructive TIC Service for Material Analysis, Insights and Forecast, 2019-2031
- 10.1. Market Analysis, Insights and Forecast - by Application
- 10.1.1. Transportation
- 10.1.2. Construction
- 10.1.3. Others
- 10.2. Market Analysis, Insights and Forecast - by Types
- 10.2.1. Onsite
- 10.2.2. Offsite
- 10.1. Market Analysis, Insights and Forecast - by Application
- 11. Competitive Analysis
- 11.1. Global Market Share Analysis 2024
- 11.2. Company Profiles
- 11.2.1 DEKRA
- 11.2.1.1. Overview
- 11.2.1.2. Products
- 11.2.1.3. SWOT Analysis
- 11.2.1.4. Recent Developments
- 11.2.1.5. Financials (Based on Availability)
- 11.2.2 TÜV SÜD Group
- 11.2.2.1. Overview
- 11.2.2.2. Products
- 11.2.2.3. SWOT Analysis
- 11.2.2.4. Recent Developments
- 11.2.2.5. Financials (Based on Availability)
- 11.2.3 Bureau Veritas
- 11.2.3.1. Overview
- 11.2.3.2. Products
- 11.2.3.3. SWOT Analysis
- 11.2.3.4. Recent Developments
- 11.2.3.5. Financials (Based on Availability)
- 11.2.4 Applus Services
- 11.2.4.1. Overview
- 11.2.4.2. Products
- 11.2.4.3. SWOT Analysis
- 11.2.4.4. Recent Developments
- 11.2.4.5. Financials (Based on Availability)
- 11.2.5 SGS Group
- 11.2.5.1. Overview
- 11.2.5.2. Products
- 11.2.5.3. SWOT Analysis
- 11.2.5.4. Recent Developments
- 11.2.5.5. Financials (Based on Availability)
- 11.2.6 Intertek Group
- 11.2.6.1. Overview
- 11.2.6.2. Products
- 11.2.6.3. SWOT Analysis
- 11.2.6.4. Recent Developments
- 11.2.6.5. Financials (Based on Availability)
- 11.2.7 TÜV Rheinland Group
- 11.2.7.1. Overview
- 11.2.7.2. Products
- 11.2.7.3. SWOT Analysis
- 11.2.7.4. Recent Developments
- 11.2.7.5. Financials (Based on Availability)
- 11.2.8 TÜV Nord Group
- 11.2.8.1. Overview
- 11.2.8.2. Products
- 11.2.8.3. SWOT Analysis
- 11.2.8.4. Recent Developments
- 11.2.8.5. Financials (Based on Availability)
- 11.2.9 Element Materials
- 11.2.9.1. Overview
- 11.2.9.2. Products
- 11.2.9.3. SWOT Analysis
- 11.2.9.4. Recent Developments
- 11.2.9.5. Financials (Based on Availability)
- 11.2.1 DEKRA
List of Figures
- Figure 1: Global Non-destructive TIC Service for Material Revenue Breakdown (million, %) by Region 2024 & 2032
- Figure 2: North America Non-destructive TIC Service for Material Revenue (million), by Application 2024 & 2032
- Figure 3: North America Non-destructive TIC Service for Material Revenue Share (%), by Application 2024 & 2032
- Figure 4: North America Non-destructive TIC Service for Material Revenue (million), by Types 2024 & 2032
- Figure 5: North America Non-destructive TIC Service for Material Revenue Share (%), by Types 2024 & 2032
- Figure 6: North America Non-destructive TIC Service for Material Revenue (million), by Country 2024 & 2032
- Figure 7: North America Non-destructive TIC Service for Material Revenue Share (%), by Country 2024 & 2032
- Figure 8: South America Non-destructive TIC Service for Material Revenue (million), by Application 2024 & 2032
- Figure 9: South America Non-destructive TIC Service for Material Revenue Share (%), by Application 2024 & 2032
- Figure 10: South America Non-destructive TIC Service for Material Revenue (million), by Types 2024 & 2032
- Figure 11: South America Non-destructive TIC Service for Material Revenue Share (%), by Types 2024 & 2032
- Figure 12: South America Non-destructive TIC Service for Material Revenue (million), by Country 2024 & 2032
- Figure 13: South America Non-destructive TIC Service for Material Revenue Share (%), by Country 2024 & 2032
- Figure 14: Europe Non-destructive TIC Service for Material Revenue (million), by Application 2024 & 2032
- Figure 15: Europe Non-destructive TIC Service for Material Revenue Share (%), by Application 2024 & 2032
- Figure 16: Europe Non-destructive TIC Service for Material Revenue (million), by Types 2024 & 2032
- Figure 17: Europe Non-destructive TIC Service for Material Revenue Share (%), by Types 2024 & 2032
- Figure 18: Europe Non-destructive TIC Service for Material Revenue (million), by Country 2024 & 2032
- Figure 19: Europe Non-destructive TIC Service for Material Revenue Share (%), by Country 2024 & 2032
- Figure 20: Middle East & Africa Non-destructive TIC Service for Material Revenue (million), by Application 2024 & 2032
- Figure 21: Middle East & Africa Non-destructive TIC Service for Material Revenue Share (%), by Application 2024 & 2032
- Figure 22: Middle East & Africa Non-destructive TIC Service for Material Revenue (million), by Types 2024 & 2032
- Figure 23: Middle East & Africa Non-destructive TIC Service for Material Revenue Share (%), by Types 2024 & 2032
- Figure 24: Middle East & Africa Non-destructive TIC Service for Material Revenue (million), by Country 2024 & 2032
- Figure 25: Middle East & Africa Non-destructive TIC Service for Material Revenue Share (%), by Country 2024 & 2032
- Figure 26: Asia Pacific Non-destructive TIC Service for Material Revenue (million), by Application 2024 & 2032
- Figure 27: Asia Pacific Non-destructive TIC Service for Material Revenue Share (%), by Application 2024 & 2032
- Figure 28: Asia Pacific Non-destructive TIC Service for Material Revenue (million), by Types 2024 & 2032
- Figure 29: Asia Pacific Non-destructive TIC Service for Material Revenue Share (%), by Types 2024 & 2032
- Figure 30: Asia Pacific Non-destructive TIC Service for Material Revenue (million), by Country 2024 & 2032
- Figure 31: Asia Pacific Non-destructive TIC Service for Material Revenue Share (%), by Country 2024 & 2032
List of Tables
- Table 1: Global Non-destructive TIC Service for Material Revenue million Forecast, by Region 2019 & 2032
- Table 2: Global Non-destructive TIC Service for Material Revenue million Forecast, by Application 2019 & 2032
- Table 3: Global Non-destructive TIC Service for Material Revenue million Forecast, by Types 2019 & 2032
- Table 4: Global Non-destructive TIC Service for Material Revenue million Forecast, by Region 2019 & 2032
- Table 5: Global Non-destructive TIC Service for Material Revenue million Forecast, by Application 2019 & 2032
- Table 6: Global Non-destructive TIC Service for Material Revenue million Forecast, by Types 2019 & 2032
- Table 7: Global Non-destructive TIC Service for Material Revenue million Forecast, by Country 2019 & 2032
- Table 8: United States Non-destructive TIC Service for Material Revenue (million) Forecast, by Application 2019 & 2032
- Table 9: Canada Non-destructive TIC Service for Material Revenue (million) Forecast, by Application 2019 & 2032
- Table 10: Mexico Non-destructive TIC Service for Material Revenue (million) Forecast, by Application 2019 & 2032
- Table 11: Global Non-destructive TIC Service for Material Revenue million Forecast, by Application 2019 & 2032
- Table 12: Global Non-destructive TIC Service for Material Revenue million Forecast, by Types 2019 & 2032
- Table 13: Global Non-destructive TIC Service for Material Revenue million Forecast, by Country 2019 & 2032
- Table 14: Brazil Non-destructive TIC Service for Material Revenue (million) Forecast, by Application 2019 & 2032
- Table 15: Argentina Non-destructive TIC Service for Material Revenue (million) Forecast, by Application 2019 & 2032
- Table 16: Rest of South America Non-destructive TIC Service for Material Revenue (million) Forecast, by Application 2019 & 2032
- Table 17: Global Non-destructive TIC Service for Material Revenue million Forecast, by Application 2019 & 2032
- Table 18: Global Non-destructive TIC Service for Material Revenue million Forecast, by Types 2019 & 2032
- Table 19: Global Non-destructive TIC Service for Material Revenue million Forecast, by Country 2019 & 2032
- Table 20: United Kingdom Non-destructive TIC Service for Material Revenue (million) Forecast, by Application 2019 & 2032
- Table 21: Germany Non-destructive TIC Service for Material Revenue (million) Forecast, by Application 2019 & 2032
- Table 22: France Non-destructive TIC Service for Material Revenue (million) Forecast, by Application 2019 & 2032
- Table 23: Italy Non-destructive TIC Service for Material Revenue (million) Forecast, by Application 2019 & 2032
- Table 24: Spain Non-destructive TIC Service for Material Revenue (million) Forecast, by Application 2019 & 2032
- Table 25: Russia Non-destructive TIC Service for Material Revenue (million) Forecast, by Application 2019 & 2032
- Table 26: Benelux Non-destructive TIC Service for Material Revenue (million) Forecast, by Application 2019 & 2032
- Table 27: Nordics Non-destructive TIC Service for Material Revenue (million) Forecast, by Application 2019 & 2032
- Table 28: Rest of Europe Non-destructive TIC Service for Material Revenue (million) Forecast, by Application 2019 & 2032
- Table 29: Global Non-destructive TIC Service for Material Revenue million Forecast, by Application 2019 & 2032
- Table 30: Global Non-destructive TIC Service for Material Revenue million Forecast, by Types 2019 & 2032
- Table 31: Global Non-destructive TIC Service for Material Revenue million Forecast, by Country 2019 & 2032
- Table 32: Turkey Non-destructive TIC Service for Material Revenue (million) Forecast, by Application 2019 & 2032
- Table 33: Israel Non-destructive TIC Service for Material Revenue (million) Forecast, by Application 2019 & 2032
- Table 34: GCC Non-destructive TIC Service for Material Revenue (million) Forecast, by Application 2019 & 2032
- Table 35: North Africa Non-destructive TIC Service for Material Revenue (million) Forecast, by Application 2019 & 2032
- Table 36: South Africa Non-destructive TIC Service for Material Revenue (million) Forecast, by Application 2019 & 2032
- Table 37: Rest of Middle East & Africa Non-destructive TIC Service for Material Revenue (million) Forecast, by Application 2019 & 2032
- Table 38: Global Non-destructive TIC Service for Material Revenue million Forecast, by Application 2019 & 2032
- Table 39: Global Non-destructive TIC Service for Material Revenue million Forecast, by Types 2019 & 2032
- Table 40: Global Non-destructive TIC Service for Material Revenue million Forecast, by Country 2019 & 2032
- Table 41: China Non-destructive TIC Service for Material Revenue (million) Forecast, by Application 2019 & 2032
- Table 42: India Non-destructive TIC Service for Material Revenue (million) Forecast, by Application 2019 & 2032
- Table 43: Japan Non-destructive TIC Service for Material Revenue (million) Forecast, by Application 2019 & 2032
- Table 44: South Korea Non-destructive TIC Service for Material Revenue (million) Forecast, by Application 2019 & 2032
- Table 45: ASEAN Non-destructive TIC Service for Material Revenue (million) Forecast, by Application 2019 & 2032
- Table 46: Oceania Non-destructive TIC Service for Material Revenue (million) Forecast, by Application 2019 & 2032
- Table 47: Rest of Asia Pacific Non-destructive TIC Service for Material Revenue (million) Forecast, by Application 2019 & 2032
Frequently Asked Questions
1. What is the projected Compound Annual Growth Rate (CAGR) of the Non-destructive TIC Service for Material?
The projected CAGR is approximately XX%.
2. Which companies are prominent players in the Non-destructive TIC Service for Material?
Key companies in the market include DEKRA, TÜV SÜD Group, Bureau Veritas, Applus Services, SGS Group, Intertek Group, TÜV Rheinland Group, TÜV Nord Group, Element Materials.
3. What are the main segments of the Non-destructive TIC Service for Material?
The market segments include Application, Types.
4. Can you provide details about the market size?
The market size is estimated to be USD XXX million as of 2022.
5. What are some drivers contributing to market growth?
N/A
6. What are the notable trends driving market growth?
N/A
7. Are there any restraints impacting market growth?
N/A
8. Can you provide examples of recent developments in the market?
N/A
9. What pricing options are available for accessing the report?
Pricing options include single-user, multi-user, and enterprise licenses priced at USD 4900.00, USD 7350.00, and USD 9800.00 respectively.
10. Is the market size provided in terms of value or volume?
The market size is provided in terms of value, measured in million.
11. Are there any specific market keywords associated with the report?
Yes, the market keyword associated with the report is "Non-destructive TIC Service for Material," which aids in identifying and referencing the specific market segment covered.
12. How do I determine which pricing option suits my needs best?
The pricing options vary based on user requirements and access needs. Individual users may opt for single-user licenses, while businesses requiring broader access may choose multi-user or enterprise licenses for cost-effective access to the report.
13. Are there any additional resources or data provided in the Non-destructive TIC Service for Material report?
While the report offers comprehensive insights, it's advisable to review the specific contents or supplementary materials provided to ascertain if additional resources or data are available.
14. How can I stay updated on further developments or reports in the Non-destructive TIC Service for Material?
To stay informed about further developments, trends, and reports in the Non-destructive TIC Service for Material, consider subscribing to industry newsletters, following relevant companies and organizations, or regularly checking reputable industry news sources and publications.
Methodology
Step 1 - Identification of Relevant Samples Size from Population Database


Step 2 - Approaches for Defining Global Market Size (Value, Volume* & Price*)

Note*: In applicable scenarios
Step 3 - Data Sources
Primary Research
- Web Analytics
- Survey Reports
- Research Institute
- Latest Research Reports
- Opinion Leaders
Secondary Research
- Annual Reports
- White Paper
- Latest Press Release
- Industry Association
- Paid Database
- Investor Presentations

Step 4 - Data Triangulation
Involves using different sources of information in order to increase the validity of a study
These sources are likely to be stakeholders in a program - participants, other researchers, program staff, other community members, and so on.
Then we put all data in single framework & apply various statistical tools to find out the dynamic on the market.
During the analysis stage, feedback from the stakeholder groups would be compared to determine areas of agreement as well as areas of divergence
