

Key Insights
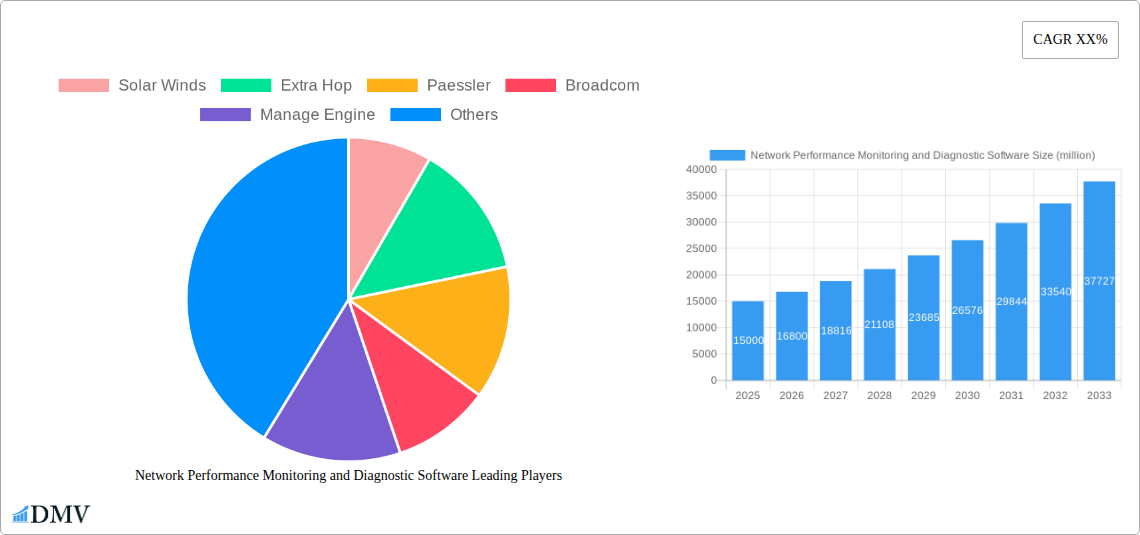
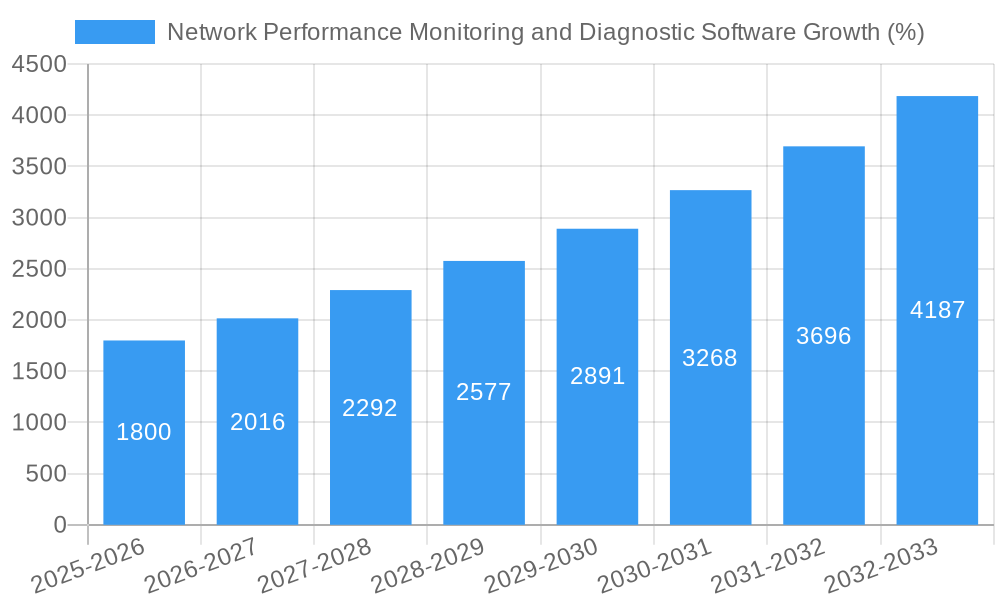
The Network Performance Monitoring and Diagnostic (NPMD) software market is experiencing robust growth, driven by the increasing complexity of network infrastructures and the rising adoption of cloud-based services. The market, estimated at $15 billion in 2025, is projected to maintain a healthy Compound Annual Growth Rate (CAGR) of 12% throughout the forecast period (2025-2033), reaching an estimated $40 billion by 2033. Key drivers include the expanding adoption of digital transformation initiatives across various industries, the need for enhanced network security and compliance, and the growing demand for real-time network visibility. Emerging trends such as AI-powered analytics, automation of network operations, and the integration of NPMD with other IT management tools are further fueling market expansion. However, challenges such as the high cost of implementation, integration complexities with existing systems, and the need for specialized expertise can act as restraints to market growth. The market is segmented by deployment type (cloud, on-premises), organization size (small and medium-sized enterprises (SMEs), large enterprises), and industry vertical (IT & Telecom, BFSI, Healthcare, Retail, Manufacturing), offering diverse solutions tailored to specific needs. Leading vendors such as SolarWinds, ExtraHop, Paessler, Broadcom, ManageEngine, and Cisco are actively competing through innovation, acquisitions, and strategic partnerships to gain market share.
The competitive landscape is dynamic, with established players focusing on expanding their product portfolios and geographical reach. The rise of open-source NPMD solutions poses a potential challenge, though their lack of comprehensive support and advanced features limits their adoption by larger enterprises. Growth in the Asia-Pacific region is expected to be particularly strong due to increased infrastructure investment and rapid digitalization. Overall, the NPMD software market presents a significant opportunity for vendors to capitalize on the growing need for efficient network management and optimization in an increasingly complex technological landscape. Companies are increasingly investing in advanced analytics capabilities to improve network performance, predict outages, and enhance security. This trend is expected to drive further market consolidation and innovation in the coming years.
Network Performance Monitoring and Diagnostic Software Market Report: 2019-2033
This comprehensive report provides an in-depth analysis of the global Network Performance Monitoring and Diagnostic Software market, projecting a market value exceeding $XX million by 2033. The study covers the period from 2019 to 2033, with a focus on the forecast period of 2025-2033, using 2025 as the base and estimated year. This report is essential for stakeholders seeking to understand market trends, technological advancements, and competitive dynamics within this rapidly evolving sector.
Network Performance Monitoring and Diagnostic Software Market Composition & Trends
This section analyzes the market’s competitive landscape, highlighting key trends influencing growth. The market is characterized by a moderately concentrated structure, with major players like SolarWinds, ExtraHop, and Cisco holding significant market share. However, the emergence of innovative solutions from smaller companies is driving increased competition.
Market Share Distribution (Estimated 2025):
- SolarWinds: xx%
- ExtraHop: xx%
- Cisco: xx%
- Paessler: xx%
- Others: xx%
Innovation Catalysts: The market is fueled by advancements in Artificial Intelligence (AI), Machine Learning (ML), and cloud computing, enabling more sophisticated network monitoring and predictive analytics.
Regulatory Landscape: Compliance requirements regarding data security and network uptime are driving adoption, particularly within regulated industries.
Substitute Products: While limited, alternative approaches such as manual monitoring exist but lack the scalability and efficiency of dedicated software solutions.
End-User Profiles: The primary end-users include IT departments in enterprises across various sectors, including telecom, finance, healthcare, and government.
M&A Activities: The past five years have witnessed significant M&A activity, with deal values exceeding $XX million in aggregate. Notable transactions include [Insert details of specific M&A activity if available, otherwise use "xx" and state "Specific details of M&A transactions are not publicly available at this time." ]. This consolidation signifies a push for enhanced market positioning and technological integration.
Network Performance Monitoring and Diagnostic Software Industry Evolution
The global Network Performance Monitoring and Diagnostic Software market has experienced robust growth over the historical period (2019-2024), with a Compound Annual Growth Rate (CAGR) of xx%. This growth is primarily driven by several factors: the increasing complexity of network infrastructures, the rising adoption of cloud-based services, and the growing need for enhanced network security and performance optimization. The market is witnessing a shift towards software-as-a-service (SaaS) offerings, driven by the advantages of scalability, cost-effectiveness, and ease of deployment. The adoption rate of cloud-based solutions is projected to increase significantly over the forecast period, exceeding xx% by 2033. Furthermore, the integration of AI and ML capabilities into network monitoring tools is transforming the sector, enabling predictive analytics and automated incident response. The market is witnessing increasing demand for advanced functionalities such as application performance monitoring (APM), network security monitoring, and digital experience monitoring (DEM), resulting in substantial revenue growth and innovative product development within the Network Performance Monitoring and Diagnostic Software sector. The increased focus on digital transformation initiatives across various industries is further propelling market expansion. The predicted CAGR for the forecast period (2025-2033) is xx%, indicating sustained and robust growth.
Leading Regions, Countries, or Segments in Network Performance Monitoring and Diagnostic Software
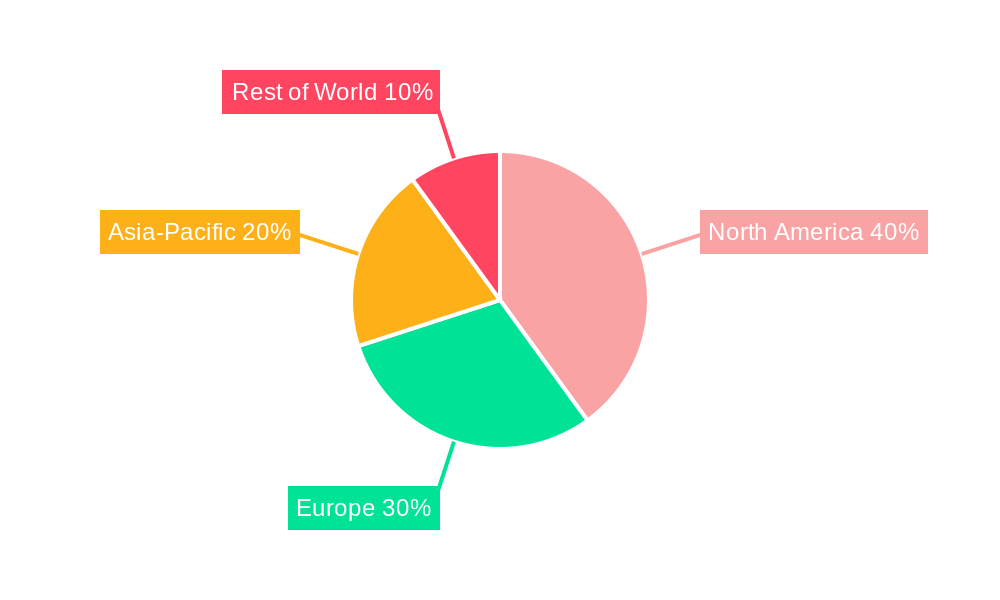
North America currently dominates the global Network Performance Monitoring and Diagnostic Software market, driven by high technological adoption rates, significant investments in IT infrastructure, and the presence of major market players.
Key Drivers for North American Dominance:
- High IT Spending: Significant investments in IT infrastructure and digital transformation initiatives fuel demand.
- Technological Advancements: North America is a hub for innovation, fostering the development and adoption of cutting-edge monitoring technologies.
- Stringent Regulatory Compliance: Regulations related to data security and network uptime drive adoption among enterprises.
Other Regions:
While North America leads, Europe and Asia-Pacific are exhibiting strong growth potential driven by increasing digitalization across various sectors.
Network Performance Monitoring and Diagnostic Software Product Innovations
Recent innovations include the integration of AI/ML for predictive analytics, automated anomaly detection, and improved root cause analysis. Enhanced visualization tools provide clearer representations of network performance, and self-service dashboards empower users to efficiently monitor and troubleshoot network issues. Unique selling propositions often focus on ease of use, scalability, and advanced analytics capabilities. These advancements cater to the need for efficient and proactive network management in increasingly complex IT environments.
Propelling Factors for Network Performance Monitoring and Diagnostic Software Growth
The market's growth is driven by several factors: the increasing complexity of networks, requiring sophisticated monitoring solutions; the rising adoption of cloud computing and virtualization, demanding integrated monitoring capabilities; and stricter regulatory compliance, emphasizing network security and uptime. Economic factors, such as increased IT spending and digital transformation investments across various sectors, are also key growth drivers.
Obstacles in the Network Performance Monitoring and Diagnostic Software Market
Significant obstacles include the high cost of implementation and maintenance, particularly for advanced solutions. Integration challenges with existing IT infrastructure can also hinder adoption. Furthermore, the competitive landscape, with numerous vendors offering overlapping functionalities, presents a challenge for market penetration. Supply chain disruptions caused by global events can affect product availability and pricing, impacting market growth.
Future Opportunities in Network Performance Monitoring and Diagnostic Software
Emerging opportunities lie in the integration of network performance monitoring with security information and event management (SIEM) systems to enhance threat detection and response. The expanding adoption of 5G and IoT technologies will create new monitoring demands. Moreover, the growth of edge computing requires tailored monitoring solutions for distributed networks.
Major Players in the Network Performance Monitoring and Diagnostic Software Ecosystem
- SolarWinds
- ExtraHop
- Paessler
- Broadcom
- ManageEngine
- Cisco
- LiveAction
- Ipswitch
- Riverbed
- Corvil
- NetBrain
- ThousandEyes
- LogicMonitor
- Viavi
- AppNeta
- Micro Focus
- Flowmon Networks
Key Developments in Network Performance Monitoring and Diagnostic Software Industry
- [Insert specific developments with year/month and impact. If no specific data is available, use "xx" and specify that specific information on industry developments is unavailable.]
Strategic Network Performance Monitoring and Diagnostic Software Market Forecast
The Network Performance Monitoring and Diagnostic Software market is poised for continued growth, driven by increasing digitalization, the adoption of advanced technologies like AI and ML, and the expanding demand for robust network security and performance optimization. The market's future trajectory is optimistic, with significant potential for expansion across various industries and geographies. The integration of emerging technologies and the ongoing demand for enhanced network visibility will continue to shape the market landscape in the coming years.
Network Performance Monitoring and Diagnostic Software Segmentation
-
1. Application
- 1.1. Large Enterprises (1000+Users)
- 1.2. Medium-Sized Enterprise (499-1000 Users)
- 1.3. Small Enterprises (1-499Users)
-
2. Types
- 2.1. Cloud-Based
- 2.2. On-Premises
Network Performance Monitoring and Diagnostic Software Segmentation By Geography
-
1. North America
- 1.1. United States
- 1.2. Canada
- 1.3. Mexico
-
2. South America
- 2.1. Brazil
- 2.2. Argentina
- 2.3. Rest of South America
-
3. Europe
- 3.1. United Kingdom
- 3.2. Germany
- 3.3. France
- 3.4. Italy
- 3.5. Spain
- 3.6. Russia
- 3.7. Benelux
- 3.8. Nordics
- 3.9. Rest of Europe
-
4. Middle East & Africa
- 4.1. Turkey
- 4.2. Israel
- 4.3. GCC
- 4.4. North Africa
- 4.5. South Africa
- 4.6. Rest of Middle East & Africa
-
5. Asia Pacific
- 5.1. China
- 5.2. India
- 5.3. Japan
- 5.4. South Korea
- 5.5. ASEAN
- 5.6. Oceania
- 5.7. Rest of Asia Pacific
Network Performance Monitoring and Diagnostic Software REPORT HIGHLIGHTS
| Aspects | Details |
|---|---|
| Study Period | 2019-2033 |
| Base Year | 2024 |
| Estimated Year | 2025 |
| Forecast Period | 2025-2033 |
| Historical Period | 2019-2024 |
| Growth Rate | CAGR of XX% from 2019-2033 |
| Segmentation |
|
Table of Contents
- 1. Introduction
- 1.1. Research Scope
- 1.2. Market Segmentation
- 1.3. Research Methodology
- 1.4. Definitions and Assumptions
- 2. Executive Summary
- 2.1. Introduction
- 3. Market Dynamics
- 3.1. Introduction
- 3.2. Market Drivers
- 3.3. Market Restrains
- 3.4. Market Trends
- 4. Market Factor Analysis
- 4.1. Porters Five Forces
- 4.2. Supply/Value Chain
- 4.3. PESTEL analysis
- 4.4. Market Entropy
- 4.5. Patent/Trademark Analysis
- 5. Global Network Performance Monitoring and Diagnostic Software Analysis, Insights and Forecast, 2019-2031
- 5.1. Market Analysis, Insights and Forecast - by Application
- 5.1.1. Large Enterprises (1000+Users)
- 5.1.2. Medium-Sized Enterprise (499-1000 Users)
- 5.1.3. Small Enterprises (1-499Users)
- 5.2. Market Analysis, Insights and Forecast - by Types
- 5.2.1. Cloud-Based
- 5.2.2. On-Premises
- 5.3. Market Analysis, Insights and Forecast - by Region
- 5.3.1. North America
- 5.3.2. South America
- 5.3.3. Europe
- 5.3.4. Middle East & Africa
- 5.3.5. Asia Pacific
- 5.1. Market Analysis, Insights and Forecast - by Application
- 6. North America Network Performance Monitoring and Diagnostic Software Analysis, Insights and Forecast, 2019-2031
- 6.1. Market Analysis, Insights and Forecast - by Application
- 6.1.1. Large Enterprises (1000+Users)
- 6.1.2. Medium-Sized Enterprise (499-1000 Users)
- 6.1.3. Small Enterprises (1-499Users)
- 6.2. Market Analysis, Insights and Forecast - by Types
- 6.2.1. Cloud-Based
- 6.2.2. On-Premises
- 6.1. Market Analysis, Insights and Forecast - by Application
- 7. South America Network Performance Monitoring and Diagnostic Software Analysis, Insights and Forecast, 2019-2031
- 7.1. Market Analysis, Insights and Forecast - by Application
- 7.1.1. Large Enterprises (1000+Users)
- 7.1.2. Medium-Sized Enterprise (499-1000 Users)
- 7.1.3. Small Enterprises (1-499Users)
- 7.2. Market Analysis, Insights and Forecast - by Types
- 7.2.1. Cloud-Based
- 7.2.2. On-Premises
- 7.1. Market Analysis, Insights and Forecast - by Application
- 8. Europe Network Performance Monitoring and Diagnostic Software Analysis, Insights and Forecast, 2019-2031
- 8.1. Market Analysis, Insights and Forecast - by Application
- 8.1.1. Large Enterprises (1000+Users)
- 8.1.2. Medium-Sized Enterprise (499-1000 Users)
- 8.1.3. Small Enterprises (1-499Users)
- 8.2. Market Analysis, Insights and Forecast - by Types
- 8.2.1. Cloud-Based
- 8.2.2. On-Premises
- 8.1. Market Analysis, Insights and Forecast - by Application
- 9. Middle East & Africa Network Performance Monitoring and Diagnostic Software Analysis, Insights and Forecast, 2019-2031
- 9.1. Market Analysis, Insights and Forecast - by Application
- 9.1.1. Large Enterprises (1000+Users)
- 9.1.2. Medium-Sized Enterprise (499-1000 Users)
- 9.1.3. Small Enterprises (1-499Users)
- 9.2. Market Analysis, Insights and Forecast - by Types
- 9.2.1. Cloud-Based
- 9.2.2. On-Premises
- 9.1. Market Analysis, Insights and Forecast - by Application
- 10. Asia Pacific Network Performance Monitoring and Diagnostic Software Analysis, Insights and Forecast, 2019-2031
- 10.1. Market Analysis, Insights and Forecast - by Application
- 10.1.1. Large Enterprises (1000+Users)
- 10.1.2. Medium-Sized Enterprise (499-1000 Users)
- 10.1.3. Small Enterprises (1-499Users)
- 10.2. Market Analysis, Insights and Forecast - by Types
- 10.2.1. Cloud-Based
- 10.2.2. On-Premises
- 10.1. Market Analysis, Insights and Forecast - by Application
- 11. Competitive Analysis
- 11.1. Global Market Share Analysis 2024
- 11.2. Company Profiles
- 11.2.1 Solar Winds
- 11.2.1.1. Overview
- 11.2.1.2. Products
- 11.2.1.3. SWOT Analysis
- 11.2.1.4. Recent Developments
- 11.2.1.5. Financials (Based on Availability)
- 11.2.2 Extra Hop
- 11.2.2.1. Overview
- 11.2.2.2. Products
- 11.2.2.3. SWOT Analysis
- 11.2.2.4. Recent Developments
- 11.2.2.5. Financials (Based on Availability)
- 11.2.3 Paessler
- 11.2.3.1. Overview
- 11.2.3.2. Products
- 11.2.3.3. SWOT Analysis
- 11.2.3.4. Recent Developments
- 11.2.3.5. Financials (Based on Availability)
- 11.2.4 Broadcom
- 11.2.4.1. Overview
- 11.2.4.2. Products
- 11.2.4.3. SWOT Analysis
- 11.2.4.4. Recent Developments
- 11.2.4.5. Financials (Based on Availability)
- 11.2.5 Manage Engine
- 11.2.5.1. Overview
- 11.2.5.2. Products
- 11.2.5.3. SWOT Analysis
- 11.2.5.4. Recent Developments
- 11.2.5.5. Financials (Based on Availability)
- 11.2.6 Cisco
- 11.2.6.1. Overview
- 11.2.6.2. Products
- 11.2.6.3. SWOT Analysis
- 11.2.6.4. Recent Developments
- 11.2.6.5. Financials (Based on Availability)
- 11.2.7 Live Action
- 11.2.7.1. Overview
- 11.2.7.2. Products
- 11.2.7.3. SWOT Analysis
- 11.2.7.4. Recent Developments
- 11.2.7.5. Financials (Based on Availability)
- 11.2.8 Ipswitch
- 11.2.8.1. Overview
- 11.2.8.2. Products
- 11.2.8.3. SWOT Analysis
- 11.2.8.4. Recent Developments
- 11.2.8.5. Financials (Based on Availability)
- 11.2.9 Riverbed
- 11.2.9.1. Overview
- 11.2.9.2. Products
- 11.2.9.3. SWOT Analysis
- 11.2.9.4. Recent Developments
- 11.2.9.5. Financials (Based on Availability)
- 11.2.10 Corvil
- 11.2.10.1. Overview
- 11.2.10.2. Products
- 11.2.10.3. SWOT Analysis
- 11.2.10.4. Recent Developments
- 11.2.10.5. Financials (Based on Availability)
- 11.2.11 Net Brain
- 11.2.11.1. Overview
- 11.2.11.2. Products
- 11.2.11.3. SWOT Analysis
- 11.2.11.4. Recent Developments
- 11.2.11.5. Financials (Based on Availability)
- 11.2.12 Thous and Eyes
- 11.2.12.1. Overview
- 11.2.12.2. Products
- 11.2.12.3. SWOT Analysis
- 11.2.12.4. Recent Developments
- 11.2.12.5. Financials (Based on Availability)
- 11.2.13 LogicMonitor
- 11.2.13.1. Overview
- 11.2.13.2. Products
- 11.2.13.3. SWOT Analysis
- 11.2.13.4. Recent Developments
- 11.2.13.5. Financials (Based on Availability)
- 11.2.14 Viavi
- 11.2.14.1. Overview
- 11.2.14.2. Products
- 11.2.14.3. SWOT Analysis
- 11.2.14.4. Recent Developments
- 11.2.14.5. Financials (Based on Availability)
- 11.2.15 App Neta
- 11.2.15.1. Overview
- 11.2.15.2. Products
- 11.2.15.3. SWOT Analysis
- 11.2.15.4. Recent Developments
- 11.2.15.5. Financials (Based on Availability)
- 11.2.16 Micro Focus
- 11.2.16.1. Overview
- 11.2.16.2. Products
- 11.2.16.3. SWOT Analysis
- 11.2.16.4. Recent Developments
- 11.2.16.5. Financials (Based on Availability)
- 11.2.17 Flowmon Networks
- 11.2.17.1. Overview
- 11.2.17.2. Products
- 11.2.17.3. SWOT Analysis
- 11.2.17.4. Recent Developments
- 11.2.17.5. Financials (Based on Availability)
- 11.2.1 Solar Winds
List of Figures
- Figure 1: Global Network Performance Monitoring and Diagnostic Software Revenue Breakdown (million, %) by Region 2024 & 2032
- Figure 2: North America Network Performance Monitoring and Diagnostic Software Revenue (million), by Application 2024 & 2032
- Figure 3: North America Network Performance Monitoring and Diagnostic Software Revenue Share (%), by Application 2024 & 2032
- Figure 4: North America Network Performance Monitoring and Diagnostic Software Revenue (million), by Types 2024 & 2032
- Figure 5: North America Network Performance Monitoring and Diagnostic Software Revenue Share (%), by Types 2024 & 2032
- Figure 6: North America Network Performance Monitoring and Diagnostic Software Revenue (million), by Country 2024 & 2032
- Figure 7: North America Network Performance Monitoring and Diagnostic Software Revenue Share (%), by Country 2024 & 2032
- Figure 8: South America Network Performance Monitoring and Diagnostic Software Revenue (million), by Application 2024 & 2032
- Figure 9: South America Network Performance Monitoring and Diagnostic Software Revenue Share (%), by Application 2024 & 2032
- Figure 10: South America Network Performance Monitoring and Diagnostic Software Revenue (million), by Types 2024 & 2032
- Figure 11: South America Network Performance Monitoring and Diagnostic Software Revenue Share (%), by Types 2024 & 2032
- Figure 12: South America Network Performance Monitoring and Diagnostic Software Revenue (million), by Country 2024 & 2032
- Figure 13: South America Network Performance Monitoring and Diagnostic Software Revenue Share (%), by Country 2024 & 2032
- Figure 14: Europe Network Performance Monitoring and Diagnostic Software Revenue (million), by Application 2024 & 2032
- Figure 15: Europe Network Performance Monitoring and Diagnostic Software Revenue Share (%), by Application 2024 & 2032
- Figure 16: Europe Network Performance Monitoring and Diagnostic Software Revenue (million), by Types 2024 & 2032
- Figure 17: Europe Network Performance Monitoring and Diagnostic Software Revenue Share (%), by Types 2024 & 2032
- Figure 18: Europe Network Performance Monitoring and Diagnostic Software Revenue (million), by Country 2024 & 2032
- Figure 19: Europe Network Performance Monitoring and Diagnostic Software Revenue Share (%), by Country 2024 & 2032
- Figure 20: Middle East & Africa Network Performance Monitoring and Diagnostic Software Revenue (million), by Application 2024 & 2032
- Figure 21: Middle East & Africa Network Performance Monitoring and Diagnostic Software Revenue Share (%), by Application 2024 & 2032
- Figure 22: Middle East & Africa Network Performance Monitoring and Diagnostic Software Revenue (million), by Types 2024 & 2032
- Figure 23: Middle East & Africa Network Performance Monitoring and Diagnostic Software Revenue Share (%), by Types 2024 & 2032
- Figure 24: Middle East & Africa Network Performance Monitoring and Diagnostic Software Revenue (million), by Country 2024 & 2032
- Figure 25: Middle East & Africa Network Performance Monitoring and Diagnostic Software Revenue Share (%), by Country 2024 & 2032
- Figure 26: Asia Pacific Network Performance Monitoring and Diagnostic Software Revenue (million), by Application 2024 & 2032
- Figure 27: Asia Pacific Network Performance Monitoring and Diagnostic Software Revenue Share (%), by Application 2024 & 2032
- Figure 28: Asia Pacific Network Performance Monitoring and Diagnostic Software Revenue (million), by Types 2024 & 2032
- Figure 29: Asia Pacific Network Performance Monitoring and Diagnostic Software Revenue Share (%), by Types 2024 & 2032
- Figure 30: Asia Pacific Network Performance Monitoring and Diagnostic Software Revenue (million), by Country 2024 & 2032
- Figure 31: Asia Pacific Network Performance Monitoring and Diagnostic Software Revenue Share (%), by Country 2024 & 2032
List of Tables
- Table 1: Global Network Performance Monitoring and Diagnostic Software Revenue million Forecast, by Region 2019 & 2032
- Table 2: Global Network Performance Monitoring and Diagnostic Software Revenue million Forecast, by Application 2019 & 2032
- Table 3: Global Network Performance Monitoring and Diagnostic Software Revenue million Forecast, by Types 2019 & 2032
- Table 4: Global Network Performance Monitoring and Diagnostic Software Revenue million Forecast, by Region 2019 & 2032
- Table 5: Global Network Performance Monitoring and Diagnostic Software Revenue million Forecast, by Application 2019 & 2032
- Table 6: Global Network Performance Monitoring and Diagnostic Software Revenue million Forecast, by Types 2019 & 2032
- Table 7: Global Network Performance Monitoring and Diagnostic Software Revenue million Forecast, by Country 2019 & 2032
- Table 8: United States Network Performance Monitoring and Diagnostic Software Revenue (million) Forecast, by Application 2019 & 2032
- Table 9: Canada Network Performance Monitoring and Diagnostic Software Revenue (million) Forecast, by Application 2019 & 2032
- Table 10: Mexico Network Performance Monitoring and Diagnostic Software Revenue (million) Forecast, by Application 2019 & 2032
- Table 11: Global Network Performance Monitoring and Diagnostic Software Revenue million Forecast, by Application 2019 & 2032
- Table 12: Global Network Performance Monitoring and Diagnostic Software Revenue million Forecast, by Types 2019 & 2032
- Table 13: Global Network Performance Monitoring and Diagnostic Software Revenue million Forecast, by Country 2019 & 2032
- Table 14: Brazil Network Performance Monitoring and Diagnostic Software Revenue (million) Forecast, by Application 2019 & 2032
- Table 15: Argentina Network Performance Monitoring and Diagnostic Software Revenue (million) Forecast, by Application 2019 & 2032
- Table 16: Rest of South America Network Performance Monitoring and Diagnostic Software Revenue (million) Forecast, by Application 2019 & 2032
- Table 17: Global Network Performance Monitoring and Diagnostic Software Revenue million Forecast, by Application 2019 & 2032
- Table 18: Global Network Performance Monitoring and Diagnostic Software Revenue million Forecast, by Types 2019 & 2032
- Table 19: Global Network Performance Monitoring and Diagnostic Software Revenue million Forecast, by Country 2019 & 2032
- Table 20: United Kingdom Network Performance Monitoring and Diagnostic Software Revenue (million) Forecast, by Application 2019 & 2032
- Table 21: Germany Network Performance Monitoring and Diagnostic Software Revenue (million) Forecast, by Application 2019 & 2032
- Table 22: France Network Performance Monitoring and Diagnostic Software Revenue (million) Forecast, by Application 2019 & 2032
- Table 23: Italy Network Performance Monitoring and Diagnostic Software Revenue (million) Forecast, by Application 2019 & 2032
- Table 24: Spain Network Performance Monitoring and Diagnostic Software Revenue (million) Forecast, by Application 2019 & 2032
- Table 25: Russia Network Performance Monitoring and Diagnostic Software Revenue (million) Forecast, by Application 2019 & 2032
- Table 26: Benelux Network Performance Monitoring and Diagnostic Software Revenue (million) Forecast, by Application 2019 & 2032
- Table 27: Nordics Network Performance Monitoring and Diagnostic Software Revenue (million) Forecast, by Application 2019 & 2032
- Table 28: Rest of Europe Network Performance Monitoring and Diagnostic Software Revenue (million) Forecast, by Application 2019 & 2032
- Table 29: Global Network Performance Monitoring and Diagnostic Software Revenue million Forecast, by Application 2019 & 2032
- Table 30: Global Network Performance Monitoring and Diagnostic Software Revenue million Forecast, by Types 2019 & 2032
- Table 31: Global Network Performance Monitoring and Diagnostic Software Revenue million Forecast, by Country 2019 & 2032
- Table 32: Turkey Network Performance Monitoring and Diagnostic Software Revenue (million) Forecast, by Application 2019 & 2032
- Table 33: Israel Network Performance Monitoring and Diagnostic Software Revenue (million) Forecast, by Application 2019 & 2032
- Table 34: GCC Network Performance Monitoring and Diagnostic Software Revenue (million) Forecast, by Application 2019 & 2032
- Table 35: North Africa Network Performance Monitoring and Diagnostic Software Revenue (million) Forecast, by Application 2019 & 2032
- Table 36: South Africa Network Performance Monitoring and Diagnostic Software Revenue (million) Forecast, by Application 2019 & 2032
- Table 37: Rest of Middle East & Africa Network Performance Monitoring and Diagnostic Software Revenue (million) Forecast, by Application 2019 & 2032
- Table 38: Global Network Performance Monitoring and Diagnostic Software Revenue million Forecast, by Application 2019 & 2032
- Table 39: Global Network Performance Monitoring and Diagnostic Software Revenue million Forecast, by Types 2019 & 2032
- Table 40: Global Network Performance Monitoring and Diagnostic Software Revenue million Forecast, by Country 2019 & 2032
- Table 41: China Network Performance Monitoring and Diagnostic Software Revenue (million) Forecast, by Application 2019 & 2032
- Table 42: India Network Performance Monitoring and Diagnostic Software Revenue (million) Forecast, by Application 2019 & 2032
- Table 43: Japan Network Performance Monitoring and Diagnostic Software Revenue (million) Forecast, by Application 2019 & 2032
- Table 44: South Korea Network Performance Monitoring and Diagnostic Software Revenue (million) Forecast, by Application 2019 & 2032
- Table 45: ASEAN Network Performance Monitoring and Diagnostic Software Revenue (million) Forecast, by Application 2019 & 2032
- Table 46: Oceania Network Performance Monitoring and Diagnostic Software Revenue (million) Forecast, by Application 2019 & 2032
- Table 47: Rest of Asia Pacific Network Performance Monitoring and Diagnostic Software Revenue (million) Forecast, by Application 2019 & 2032
Frequently Asked Questions
1. What is the projected Compound Annual Growth Rate (CAGR) of the Network Performance Monitoring and Diagnostic Software?
The projected CAGR is approximately XX%.
2. Which companies are prominent players in the Network Performance Monitoring and Diagnostic Software?
Key companies in the market include Solar Winds, Extra Hop, Paessler, Broadcom, Manage Engine, Cisco, Live Action, Ipswitch, Riverbed, Corvil, Net Brain, Thous and Eyes, LogicMonitor, Viavi, App Neta, Micro Focus, Flowmon Networks.
3. What are the main segments of the Network Performance Monitoring and Diagnostic Software?
The market segments include Application, Types.
4. Can you provide details about the market size?
The market size is estimated to be USD XXX million as of 2022.
5. What are some drivers contributing to market growth?
N/A
6. What are the notable trends driving market growth?
N/A
7. Are there any restraints impacting market growth?
N/A
8. Can you provide examples of recent developments in the market?
N/A
9. What pricing options are available for accessing the report?
Pricing options include single-user, multi-user, and enterprise licenses priced at USD 2900.00, USD 4350.00, and USD 5800.00 respectively.
10. Is the market size provided in terms of value or volume?
The market size is provided in terms of value, measured in million.
11. Are there any specific market keywords associated with the report?
Yes, the market keyword associated with the report is "Network Performance Monitoring and Diagnostic Software," which aids in identifying and referencing the specific market segment covered.
12. How do I determine which pricing option suits my needs best?
The pricing options vary based on user requirements and access needs. Individual users may opt for single-user licenses, while businesses requiring broader access may choose multi-user or enterprise licenses for cost-effective access to the report.
13. Are there any additional resources or data provided in the Network Performance Monitoring and Diagnostic Software report?
While the report offers comprehensive insights, it's advisable to review the specific contents or supplementary materials provided to ascertain if additional resources or data are available.
14. How can I stay updated on further developments or reports in the Network Performance Monitoring and Diagnostic Software?
To stay informed about further developments, trends, and reports in the Network Performance Monitoring and Diagnostic Software, consider subscribing to industry newsletters, following relevant companies and organizations, or regularly checking reputable industry news sources and publications.
Methodology
Step 1 - Identification of Relevant Samples Size from Population Database


Step 2 - Approaches for Defining Global Market Size (Value, Volume* & Price*)

Note*: In applicable scenarios
Step 3 - Data Sources
Primary Research
- Web Analytics
- Survey Reports
- Research Institute
- Latest Research Reports
- Opinion Leaders
Secondary Research
- Annual Reports
- White Paper
- Latest Press Release
- Industry Association
- Paid Database
- Investor Presentations

Step 4 - Data Triangulation
Involves using different sources of information in order to increase the validity of a study
These sources are likely to be stakeholders in a program - participants, other researchers, program staff, other community members, and so on.
Then we put all data in single framework & apply various statistical tools to find out the dynamic on the market.
During the analysis stage, feedback from the stakeholder groups would be compared to determine areas of agreement as well as areas of divergence
