

Key Insights
The Network as a Service (NaaS) market is experiencing robust growth, fueled by the increasing adoption of cloud computing, the demand for enhanced network agility and scalability, and the rising need for improved security solutions. The market's compound annual growth rate (CAGR) of 32.36% from 2019 to 2024 suggests a significant expansion, projecting substantial market value by 2033. Key drivers include the shift towards hybrid and multi-cloud environments, necessitating flexible and cost-effective networking solutions. Businesses across various sectors, including healthcare, BFSI, and retail, are increasingly adopting NaaS to optimize their IT infrastructure, reduce capital expenditure, and improve operational efficiency. The diverse service offerings, encompassing LAN-as-a-Service, WAN-as-a-Service, and integrated security solutions, cater to a wide range of organizational needs. The market segmentation by application (vCPE, Bandwidth on Demand, etc.) and industry vertical highlights the pervasive nature of NaaS adoption across different business models and technological landscapes.
While the market presents significant opportunities, certain challenges exist. These include concerns related to security vulnerabilities, the need for robust service level agreements (SLAs), and the potential complexity of integrating NaaS with existing IT infrastructure. Despite these restraints, the long-term outlook for the NaaS market remains positive. The continued evolution of cloud technologies, coupled with growing awareness of NaaS benefits, is expected to drive further market expansion. Competition amongst established players like Telstra, AT&T, Cisco, and newer entrants is fostering innovation and driving down costs, thereby making NaaS accessible to a wider range of organizations. Geographic expansion, particularly in developing economies with burgeoning digital infrastructure needs, also presents considerable growth potential. Strategic partnerships and mergers & acquisitions are likely to further shape the competitive landscape in the coming years.
Network as a Service (NaaS) Market: A Comprehensive Report (2019-2033)
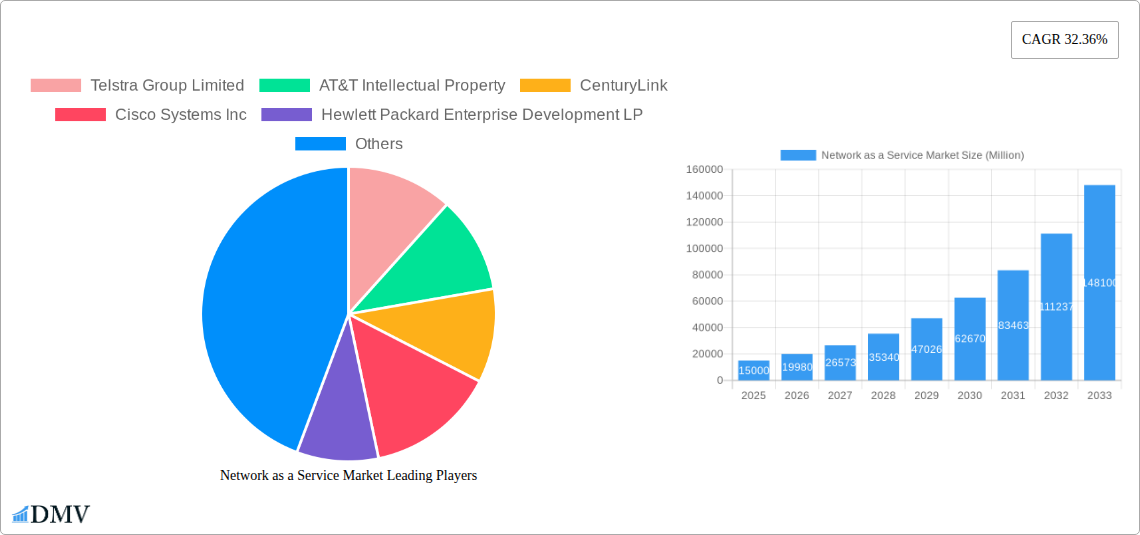
This insightful report provides a detailed analysis of the Network as a Service (NaaS) market, offering invaluable perspectives for stakeholders seeking to navigate this rapidly evolving landscape. The study covers the period from 2019 to 2033, with 2025 serving as the base and estimated year. The market is segmented by type (LAN-as-a-Service, WAN-as-a-Service), application (Cloud-based Services (vCPE), Bandwidth on Demand (BoD), Integrated Network Security-as-a-Service, Wide Area Network (WAN), Virtual Private Network (VPN)), and industry vertical (Healthcare, BFSI, Retail and E-commerce, IT and Telecom, Manufacturing, Transportation and Logistics, Public Sector). Key players analyzed include Telstra Group Limited, AT&T Intellectual Property, CenturyLink, Cisco Systems Inc, Hewlett Packard Enterprise Development LP, GTT Communications Inc, Juniper Networks Inc, Masergy Communications Inc, DXC Technology Company, NEC Corporation, Broadcom, Meta Networks Ltd (Proofpoint), TD SYNNEX Corporation, VMware Inc, Akamai Technologies, Oracle, Verizon, Nokia (Alcatel Lucent), and IBM. The report projects a market value of xx Million by 2033.
Network as a Service Market Composition & Trends
The NaaS market exhibits a moderately concentrated structure, with a few dominant players holding significant market share. However, the market is also characterized by a high degree of innovation, driven by advancements in cloud computing, software-defined networking (SDN), and network function virtualization (NFV). Regulatory landscapes vary across regions, influencing market adoption rates. Substitute products, such as traditional on-premise network solutions, pose a competitive challenge, while the increasing demand for agility and scalability fuels NaaS adoption. End-user profiles range from small and medium-sized enterprises (SMEs) to large multinational corporations. Mergers and acquisitions (M&A) activity is significant, with deal values exceeding xx Million in recent years, reflecting the strategic importance of NaaS within the broader technology sector.
- Market Concentration: Moderately concentrated, with top 5 players holding approximately xx% market share in 2024.
- Innovation Catalysts: Cloud computing, SDN, NFV, and AI-driven network management.
- Regulatory Landscape: Varies by region; some regions have supportive policies, others face regulatory hurdles.
- Substitute Products: Traditional on-premise network infrastructure.
- M&A Activity: Significant, with total deal values exceeding xx Million in the past 5 years. Examples include Akamai's acquisition of Ondat (March 2023).
Network as a Service Market Industry Evolution
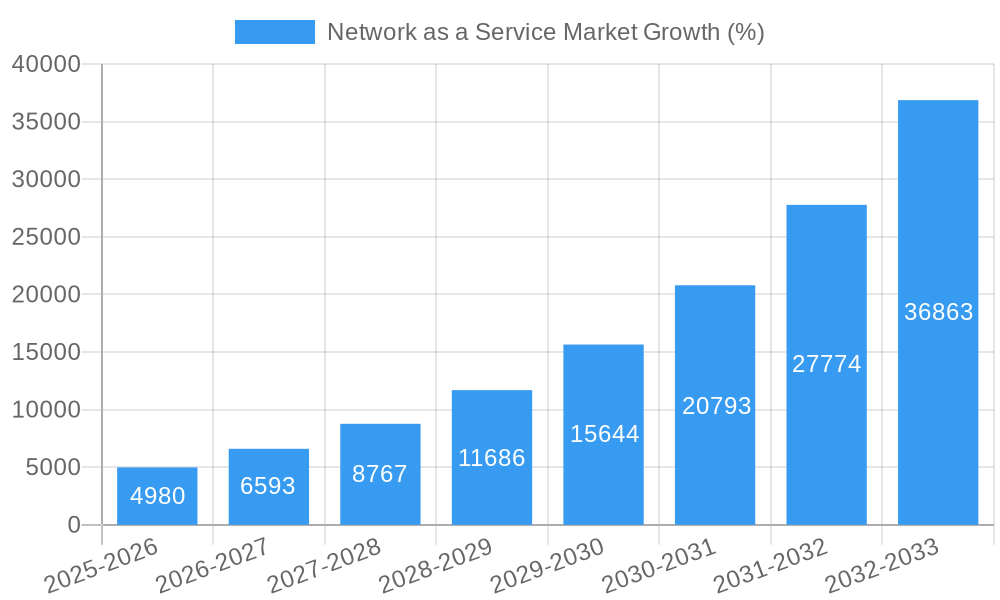
The NaaS market has experienced robust growth, with a Compound Annual Growth Rate (CAGR) of xx% during the historical period (2019-2024). This growth is fueled by the increasing adoption of cloud-based services, the rise of remote work, and the need for scalable and flexible network solutions. Technological advancements such as SDN, NFV, and edge computing are driving innovation and expanding the capabilities of NaaS offerings. Consumer demand is shifting towards more agile, secure, and cost-effective networking solutions, which aligns perfectly with the value proposition of NaaS. The market is expected to maintain strong growth during the forecast period (2025-2033), driven by continued digital transformation across various industries and increasing adoption of 5G technology. The adoption rate of NaaS among SMEs is increasing rapidly, exceeding xx% in 2024.
Leading Regions, Countries, or Segments in Network as a Service Market
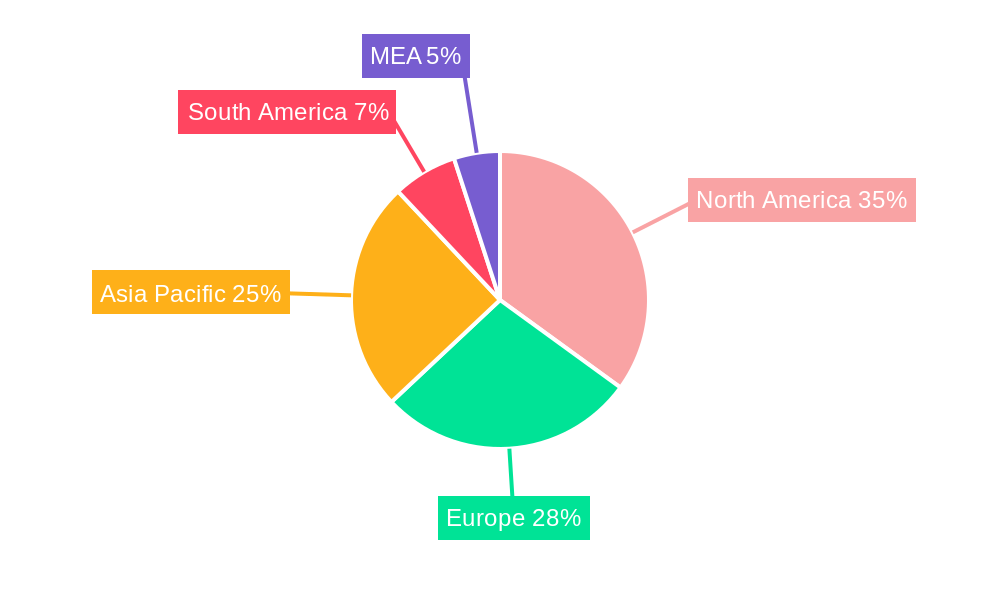
- Dominant Region: North America holds the largest market share due to high cloud adoption rates and advanced digital infrastructure. Europe follows closely.
- Leading Segments:
- By Type: WAN-as-a-Service is currently the leading segment due to the high demand for connecting geographically dispersed locations.
- By Application: Cloud-based Services (vCPE) dominates, driven by the increasing shift to cloud-native applications and infrastructure.
- By Industry Vertical: The IT and Telecom sector leads, followed by the BFSI and Healthcare sectors.
Key Drivers:
- North America: High technological advancement, robust IT infrastructure, and significant investments in cloud computing.
- Europe: Strong government support for digital transformation initiatives and increasing adoption of cloud-based services.
- Asia-Pacific: Rapid economic growth, rising adoption of digital technologies, and a large pool of potential users.
The dominance of specific regions and segments stems from factors like higher levels of digital transformation, increased investment in technological infrastructure, government support for technological advancements, and a strong business environment that facilitates the adoption and implementation of NaaS solutions.
Network as a Service Market Product Innovations
Recent innovations include the integration of AI and ML for enhanced network management, automation, and security. Advanced security features such as zero-trust network access (ZTNA) are increasingly integrated into NaaS offerings. The development of edge computing capabilities within NaaS platforms is another key innovation, enabling lower latency and improved performance for applications requiring real-time processing. These advancements lead to increased efficiency, improved security, and optimized cost-effectiveness for businesses.
Propelling Factors for Network as a Service Market Growth
Technological advancements like SDN, NFV, and edge computing are key growth drivers. The rising adoption of cloud-based applications and services is another significant factor. Furthermore, government initiatives promoting digital transformation and favorable regulatory environments are accelerating market growth. The cost-effectiveness and scalability of NaaS solutions are also attracting businesses. The increasing demand for improved network security is a crucial element driving the adoption of secure NaaS solutions.
Obstacles in the Network as a Service Market
Security concerns remain a significant barrier, with potential vulnerabilities in cloud-based networks posing a challenge. The complexity of integrating NaaS solutions with existing infrastructure can also hinder adoption. Supply chain disruptions and the rising costs of network infrastructure may limit the market's expansion. Furthermore, competitive pressure among NaaS providers and the lack of standardization could impact market growth. The lack of skilled professionals and the high upfront costs involved in implementing NaaS solutions can serve as an obstacle for many businesses.
Future Opportunities in Network as a Service Market
The expansion of 5G and other next-generation wireless technologies will unlock significant growth opportunities. The increasing demand for edge computing capabilities within NaaS solutions will drive innovation. The integration of AI/ML for network optimization and automation will enhance the overall value proposition. The growth of IoT will also fuel demand for secure and scalable NaaS solutions. New market opportunities lie in the expansion into emerging economies and untapped industry verticals.
Major Players in the Network as a Service Market Ecosystem
- Telstra Group Limited
- AT&T Intellectual Property
- CenturyLink
- Cisco Systems Inc
- Hewlett Packard Enterprise Development LP
- GTT Communications Inc
- Juniper Networks Inc
- Masergy Communications Inc
- DXC Technology Company
- NEC Corporation
- Broadcom
- Meta Networks Ltd (Proofpoint)
- TD SYNNEX Corporation
- VMware Inc
- Akamai Technologies
- Oracle
- Verizon
- Nokia (Alcatel Lucent)
- IBM
Key Developments in Network as a Service Market Industry
- March 2023: Akamai Technologies acquired Ondat, strengthening its cloud computing offerings. This acquisition signals a consolidation trend within the NaaS space, with larger players acquiring smaller companies with specialized technologies.
- November 2022: GDS partnered with DCConnect, expanding its network automation solutions in Asia. This highlights the growing importance of SDN and automation in the NaaS market.
- August 2022: Nokia partnered with Furukawa Electric LatAm to expand its optical LAN offerings. This signifies the increasing demand for high-bandwidth solutions in enterprise networks.
Strategic Network as a Service Market Forecast
The NaaS market is poised for continued robust growth, driven by technological advancements, increasing cloud adoption, and rising demand for secure and scalable networking solutions. The expansion of 5G and edge computing will further fuel market expansion. The market is expected to see significant consolidation as larger players acquire smaller companies to expand their product portfolios and geographic reach. The forecast anticipates a considerable increase in market value over the next decade, presenting substantial opportunities for established players and new entrants alike.
Network as a Service Market Segmentation
-
1. Type
- 1.1. LaaS
- 1.2. WaaS
- 1.3. cloud-based services (vCPE)
- 1.4. BoD
- 1.5. managed network security services
-
2. Application
- 2.1. Cloud-based services
- 2.2. mobility
- 2.3. IoT
- 2.4. security
- 2.5. WAN optimization
-
3. Industry Vertical
- 3.1. Healthcare
- 3.2. BFSI
- 3.3. Retail and E-commerce
- 3.4. IT and Telecom
- 3.5. Manufacturing
- 3.6. Transportation and Logistics
- 3.7. Public Sector
Network as a Service Market Segmentation By Geography
-
1. North America
- 1.1. United States
- 1.2. Canada
-
2. Europe
- 2.1. United Kingdom
- 2.2. Germany
- 2.3. France
- 2.4. Rest of Europe
-
3. Asia Pacific
- 3.1. China
- 3.2. Japan
- 3.3. India
- 3.4. Rest of Asia Pacific
-
4. Latin America
- 4.1. Brazil
- 4.2. Argentina
- 4.3. Mexico
- 4.4. Rest of Latin America
-
5. Middle East and Africa
- 5.1. United Arab Emirates
- 5.2. Saudi Arabia
- 5.3. Rest of Middle East and Africa
Network as a Service Market REPORT HIGHLIGHTS
| Aspects | Details |
|---|---|
| Study Period | 2019-2033 |
| Base Year | 2024 |
| Estimated Year | 2025 |
| Forecast Period | 2025-2033 |
| Historical Period | 2019-2024 |
| Growth Rate | CAGR of 32.36% from 2019-2033 |
| Segmentation |
|
Table of Contents
- 1. Introduction
- 1.1. Research Scope
- 1.2. Market Segmentation
- 1.3. Research Methodology
- 1.4. Definitions and Assumptions
- 2. Executive Summary
- 2.1. Introduction
- 3. Market Dynamics
- 3.1. Introduction
- 3.2. Market Drivers
- 3.2.1. Increased Adoption of Cloud Services among Enterprises; Augmentation in Software-defined Networking (SDN) Integration with Existing Network Infrastructure
- 3.3. Market Restrains
- 3.3.1. Privacy and Data Security Concerns
- 3.4. Market Trends
- 3.4.1. Increased Adoption of Cloud Services among Enterprises to Drive the Market
- 4. Market Factor Analysis
- 4.1. Porters Five Forces
- 4.2. Supply/Value Chain
- 4.3. PESTEL analysis
- 4.4. Market Entropy
- 4.5. Patent/Trademark Analysis
- 5. Global Network as a Service Market Analysis, Insights and Forecast, 2019-2031
- 5.1. Market Analysis, Insights and Forecast - by Type
- 5.1.1. LaaS
- 5.1.2. WaaS
- 5.1.3. cloud-based services (vCPE)
- 5.1.4. BoD
- 5.1.5. managed network security services
- 5.2. Market Analysis, Insights and Forecast - by Application
- 5.2.1. Cloud-based services
- 5.2.2. mobility
- 5.2.3. IoT
- 5.2.4. security
- 5.2.5. WAN optimization
- 5.3. Market Analysis, Insights and Forecast - by Industry Vertical
- 5.3.1. Healthcare
- 5.3.2. BFSI
- 5.3.3. Retail and E-commerce
- 5.3.4. IT and Telecom
- 5.3.5. Manufacturing
- 5.3.6. Transportation and Logistics
- 5.3.7. Public Sector
- 5.4. Market Analysis, Insights and Forecast - by Region
- 5.4.1. North America
- 5.4.2. Europe
- 5.4.3. Asia Pacific
- 5.4.4. Latin America
- 5.4.5. Middle East and Africa
- 5.1. Market Analysis, Insights and Forecast - by Type
- 6. North America Network as a Service Market Analysis, Insights and Forecast, 2019-2031
- 6.1. Market Analysis, Insights and Forecast - by Type
- 6.1.1. LaaS
- 6.1.2. WaaS
- 6.1.3. cloud-based services (vCPE)
- 6.1.4. BoD
- 6.1.5. managed network security services
- 6.2. Market Analysis, Insights and Forecast - by Application
- 6.2.1. Cloud-based services
- 6.2.2. mobility
- 6.2.3. IoT
- 6.2.4. security
- 6.2.5. WAN optimization
- 6.3. Market Analysis, Insights and Forecast - by Industry Vertical
- 6.3.1. Healthcare
- 6.3.2. BFSI
- 6.3.3. Retail and E-commerce
- 6.3.4. IT and Telecom
- 6.3.5. Manufacturing
- 6.3.6. Transportation and Logistics
- 6.3.7. Public Sector
- 6.1. Market Analysis, Insights and Forecast - by Type
- 7. Europe Network as a Service Market Analysis, Insights and Forecast, 2019-2031
- 7.1. Market Analysis, Insights and Forecast - by Type
- 7.1.1. LaaS
- 7.1.2. WaaS
- 7.1.3. cloud-based services (vCPE)
- 7.1.4. BoD
- 7.1.5. managed network security services
- 7.2. Market Analysis, Insights and Forecast - by Application
- 7.2.1. Cloud-based services
- 7.2.2. mobility
- 7.2.3. IoT
- 7.2.4. security
- 7.2.5. WAN optimization
- 7.3. Market Analysis, Insights and Forecast - by Industry Vertical
- 7.3.1. Healthcare
- 7.3.2. BFSI
- 7.3.3. Retail and E-commerce
- 7.3.4. IT and Telecom
- 7.3.5. Manufacturing
- 7.3.6. Transportation and Logistics
- 7.3.7. Public Sector
- 7.1. Market Analysis, Insights and Forecast - by Type
- 8. Asia Pacific Network as a Service Market Analysis, Insights and Forecast, 2019-2031
- 8.1. Market Analysis, Insights and Forecast - by Type
- 8.1.1. LaaS
- 8.1.2. WaaS
- 8.1.3. cloud-based services (vCPE)
- 8.1.4. BoD
- 8.1.5. managed network security services
- 8.2. Market Analysis, Insights and Forecast - by Application
- 8.2.1. Cloud-based services
- 8.2.2. mobility
- 8.2.3. IoT
- 8.2.4. security
- 8.2.5. WAN optimization
- 8.3. Market Analysis, Insights and Forecast - by Industry Vertical
- 8.3.1. Healthcare
- 8.3.2. BFSI
- 8.3.3. Retail and E-commerce
- 8.3.4. IT and Telecom
- 8.3.5. Manufacturing
- 8.3.6. Transportation and Logistics
- 8.3.7. Public Sector
- 8.1. Market Analysis, Insights and Forecast - by Type
- 9. Latin America Network as a Service Market Analysis, Insights and Forecast, 2019-2031
- 9.1. Market Analysis, Insights and Forecast - by Type
- 9.1.1. LaaS
- 9.1.2. WaaS
- 9.1.3. cloud-based services (vCPE)
- 9.1.4. BoD
- 9.1.5. managed network security services
- 9.2. Market Analysis, Insights and Forecast - by Application
- 9.2.1. Cloud-based services
- 9.2.2. mobility
- 9.2.3. IoT
- 9.2.4. security
- 9.2.5. WAN optimization
- 9.3. Market Analysis, Insights and Forecast - by Industry Vertical
- 9.3.1. Healthcare
- 9.3.2. BFSI
- 9.3.3. Retail and E-commerce
- 9.3.4. IT and Telecom
- 9.3.5. Manufacturing
- 9.3.6. Transportation and Logistics
- 9.3.7. Public Sector
- 9.1. Market Analysis, Insights and Forecast - by Type
- 10. Middle East and Africa Network as a Service Market Analysis, Insights and Forecast, 2019-2031
- 10.1. Market Analysis, Insights and Forecast - by Type
- 10.1.1. LaaS
- 10.1.2. WaaS
- 10.1.3. cloud-based services (vCPE)
- 10.1.4. BoD
- 10.1.5. managed network security services
- 10.2. Market Analysis, Insights and Forecast - by Application
- 10.2.1. Cloud-based services
- 10.2.2. mobility
- 10.2.3. IoT
- 10.2.4. security
- 10.2.5. WAN optimization
- 10.3. Market Analysis, Insights and Forecast - by Industry Vertical
- 10.3.1. Healthcare
- 10.3.2. BFSI
- 10.3.3. Retail and E-commerce
- 10.3.4. IT and Telecom
- 10.3.5. Manufacturing
- 10.3.6. Transportation and Logistics
- 10.3.7. Public Sector
- 10.1. Market Analysis, Insights and Forecast - by Type
- 11. North America Network as a Service Market Analysis, Insights and Forecast, 2019-2031
- 11.1. Market Analysis, Insights and Forecast - By Country/Sub-region
- 11.1.1 United States
- 11.1.2 Canada
- 11.1.3 Mexico
- 12. Europe Network as a Service Market Analysis, Insights and Forecast, 2019-2031
- 12.1. Market Analysis, Insights and Forecast - By Country/Sub-region
- 12.1.1 Germany
- 12.1.2 United Kingdom
- 12.1.3 France
- 12.1.4 Spain
- 12.1.5 Italy
- 12.1.6 Spain
- 12.1.7 Belgium
- 12.1.8 Netherland
- 12.1.9 Nordics
- 12.1.10 Rest of Europe
- 13. Asia Pacific Network as a Service Market Analysis, Insights and Forecast, 2019-2031
- 13.1. Market Analysis, Insights and Forecast - By Country/Sub-region
- 13.1.1 China
- 13.1.2 Japan
- 13.1.3 India
- 13.1.4 South Korea
- 13.1.5 Southeast Asia
- 13.1.6 Australia
- 13.1.7 Indonesia
- 13.1.8 Phillipes
- 13.1.9 Singapore
- 13.1.10 Thailandc
- 13.1.11 Rest of Asia Pacific
- 14. South America Network as a Service Market Analysis, Insights and Forecast, 2019-2031
- 14.1. Market Analysis, Insights and Forecast - By Country/Sub-region
- 14.1.1 Brazil
- 14.1.2 Argentina
- 14.1.3 Peru
- 14.1.4 Chile
- 14.1.5 Colombia
- 14.1.6 Ecuador
- 14.1.7 Venezuela
- 14.1.8 Rest of South America
- 15. North America Network as a Service Market Analysis, Insights and Forecast, 2019-2031
- 15.1. Market Analysis, Insights and Forecast - By Country/Sub-region
- 15.1.1 United States
- 15.1.2 Canada
- 15.1.3 Mexico
- 16. MEA Network as a Service Market Analysis, Insights and Forecast, 2019-2031
- 16.1. Market Analysis, Insights and Forecast - By Country/Sub-region
- 16.1.1 United Arab Emirates
- 16.1.2 Saudi Arabia
- 16.1.3 South Africa
- 16.1.4 Rest of Middle East and Africa
- 17. Competitive Analysis
- 17.1. Global Market Share Analysis 2024
- 17.2. Company Profiles
- 17.2.1 Telstra Group Limited
- 17.2.1.1. Overview
- 17.2.1.2. Products
- 17.2.1.3. SWOT Analysis
- 17.2.1.4. Recent Developments
- 17.2.1.5. Financials (Based on Availability)
- 17.2.2 AT&T Intellectual Property
- 17.2.2.1. Overview
- 17.2.2.2. Products
- 17.2.2.3. SWOT Analysis
- 17.2.2.4. Recent Developments
- 17.2.2.5. Financials (Based on Availability)
- 17.2.3 CenturyLink
- 17.2.3.1. Overview
- 17.2.3.2. Products
- 17.2.3.3. SWOT Analysis
- 17.2.3.4. Recent Developments
- 17.2.3.5. Financials (Based on Availability)
- 17.2.4 Cisco Systems Inc
- 17.2.4.1. Overview
- 17.2.4.2. Products
- 17.2.4.3. SWOT Analysis
- 17.2.4.4. Recent Developments
- 17.2.4.5. Financials (Based on Availability)
- 17.2.5 Hewlett Packard Enterprise Development LP
- 17.2.5.1. Overview
- 17.2.5.2. Products
- 17.2.5.3. SWOT Analysis
- 17.2.5.4. Recent Developments
- 17.2.5.5. Financials (Based on Availability)
- 17.2.6 GTT Communications Inc
- 17.2.6.1. Overview
- 17.2.6.2. Products
- 17.2.6.3. SWOT Analysis
- 17.2.6.4. Recent Developments
- 17.2.6.5. Financials (Based on Availability)
- 17.2.7 Juniper Networks Inc
- 17.2.7.1. Overview
- 17.2.7.2. Products
- 17.2.7.3. SWOT Analysis
- 17.2.7.4. Recent Developments
- 17.2.7.5. Financials (Based on Availability)
- 17.2.8 Masergy Communications Inc
- 17.2.8.1. Overview
- 17.2.8.2. Products
- 17.2.8.3. SWOT Analysis
- 17.2.8.4. Recent Developments
- 17.2.8.5. Financials (Based on Availability)
- 17.2.9 DXC Technology Company
- 17.2.9.1. Overview
- 17.2.9.2. Products
- 17.2.9.3. SWOT Analysis
- 17.2.9.4. Recent Developments
- 17.2.9.5. Financials (Based on Availability)
- 17.2.10 NEC Corporation
- 17.2.10.1. Overview
- 17.2.10.2. Products
- 17.2.10.3. SWOT Analysis
- 17.2.10.4. Recent Developments
- 17.2.10.5. Financials (Based on Availability)
- 17.2.11 Broadcom
- 17.2.11.1. Overview
- 17.2.11.2. Products
- 17.2.11.3. SWOT Analysis
- 17.2.11.4. Recent Developments
- 17.2.11.5. Financials (Based on Availability)
- 17.2.12 Meta Networks Ltd (Proofpoint)
- 17.2.12.1. Overview
- 17.2.12.2. Products
- 17.2.12.3. SWOT Analysis
- 17.2.12.4. Recent Developments
- 17.2.12.5. Financials (Based on Availability)
- 17.2.13 TD SYNNEX Corporation
- 17.2.13.1. Overview
- 17.2.13.2. Products
- 17.2.13.3. SWOT Analysis
- 17.2.13.4. Recent Developments
- 17.2.13.5. Financials (Based on Availability)
- 17.2.14 VMware Inc
- 17.2.14.1. Overview
- 17.2.14.2. Products
- 17.2.14.3. SWOT Analysis
- 17.2.14.4. Recent Developments
- 17.2.14.5. Financials (Based on Availability)
- 17.2.15 Akamai Technologie
- 17.2.15.1. Overview
- 17.2.15.2. Products
- 17.2.15.3. SWOT Analysis
- 17.2.15.4. Recent Developments
- 17.2.15.5. Financials (Based on Availability)
- 17.2.16 Oracle
- 17.2.16.1. Overview
- 17.2.16.2. Products
- 17.2.16.3. SWOT Analysis
- 17.2.16.4. Recent Developments
- 17.2.16.5. Financials (Based on Availability)
- 17.2.17 Verizon
- 17.2.17.1. Overview
- 17.2.17.2. Products
- 17.2.17.3. SWOT Analysis
- 17.2.17.4. Recent Developments
- 17.2.17.5. Financials (Based on Availability)
- 17.2.18 Nokia (Alcatel Lucent)
- 17.2.18.1. Overview
- 17.2.18.2. Products
- 17.2.18.3. SWOT Analysis
- 17.2.18.4. Recent Developments
- 17.2.18.5. Financials (Based on Availability)
- 17.2.19 IBM
- 17.2.19.1. Overview
- 17.2.19.2. Products
- 17.2.19.3. SWOT Analysis
- 17.2.19.4. Recent Developments
- 17.2.19.5. Financials (Based on Availability)
- 17.2.1 Telstra Group Limited
List of Figures
- Figure 1: Global Network as a Service Market Revenue Breakdown (Million, %) by Region 2024 & 2032
- Figure 2: Global Network as a Service Market Volume Breakdown (K Unit, %) by Region 2024 & 2032
- Figure 3: North America Network as a Service Market Revenue (Million), by Country 2024 & 2032
- Figure 4: North America Network as a Service Market Volume (K Unit), by Country 2024 & 2032
- Figure 5: North America Network as a Service Market Revenue Share (%), by Country 2024 & 2032
- Figure 6: North America Network as a Service Market Volume Share (%), by Country 2024 & 2032
- Figure 7: Europe Network as a Service Market Revenue (Million), by Country 2024 & 2032
- Figure 8: Europe Network as a Service Market Volume (K Unit), by Country 2024 & 2032
- Figure 9: Europe Network as a Service Market Revenue Share (%), by Country 2024 & 2032
- Figure 10: Europe Network as a Service Market Volume Share (%), by Country 2024 & 2032
- Figure 11: Asia Pacific Network as a Service Market Revenue (Million), by Country 2024 & 2032
- Figure 12: Asia Pacific Network as a Service Market Volume (K Unit), by Country 2024 & 2032
- Figure 13: Asia Pacific Network as a Service Market Revenue Share (%), by Country 2024 & 2032
- Figure 14: Asia Pacific Network as a Service Market Volume Share (%), by Country 2024 & 2032
- Figure 15: South America Network as a Service Market Revenue (Million), by Country 2024 & 2032
- Figure 16: South America Network as a Service Market Volume (K Unit), by Country 2024 & 2032
- Figure 17: South America Network as a Service Market Revenue Share (%), by Country 2024 & 2032
- Figure 18: South America Network as a Service Market Volume Share (%), by Country 2024 & 2032
- Figure 19: North America Network as a Service Market Revenue (Million), by Country 2024 & 2032
- Figure 20: North America Network as a Service Market Volume (K Unit), by Country 2024 & 2032
- Figure 21: North America Network as a Service Market Revenue Share (%), by Country 2024 & 2032
- Figure 22: North America Network as a Service Market Volume Share (%), by Country 2024 & 2032
- Figure 23: MEA Network as a Service Market Revenue (Million), by Country 2024 & 2032
- Figure 24: MEA Network as a Service Market Volume (K Unit), by Country 2024 & 2032
- Figure 25: MEA Network as a Service Market Revenue Share (%), by Country 2024 & 2032
- Figure 26: MEA Network as a Service Market Volume Share (%), by Country 2024 & 2032
- Figure 27: North America Network as a Service Market Revenue (Million), by Type 2024 & 2032
- Figure 28: North America Network as a Service Market Volume (K Unit), by Type 2024 & 2032
- Figure 29: North America Network as a Service Market Revenue Share (%), by Type 2024 & 2032
- Figure 30: North America Network as a Service Market Volume Share (%), by Type 2024 & 2032
- Figure 31: North America Network as a Service Market Revenue (Million), by Application 2024 & 2032
- Figure 32: North America Network as a Service Market Volume (K Unit), by Application 2024 & 2032
- Figure 33: North America Network as a Service Market Revenue Share (%), by Application 2024 & 2032
- Figure 34: North America Network as a Service Market Volume Share (%), by Application 2024 & 2032
- Figure 35: North America Network as a Service Market Revenue (Million), by Industry Vertical 2024 & 2032
- Figure 36: North America Network as a Service Market Volume (K Unit), by Industry Vertical 2024 & 2032
- Figure 37: North America Network as a Service Market Revenue Share (%), by Industry Vertical 2024 & 2032
- Figure 38: North America Network as a Service Market Volume Share (%), by Industry Vertical 2024 & 2032
- Figure 39: North America Network as a Service Market Revenue (Million), by Country 2024 & 2032
- Figure 40: North America Network as a Service Market Volume (K Unit), by Country 2024 & 2032
- Figure 41: North America Network as a Service Market Revenue Share (%), by Country 2024 & 2032
- Figure 42: North America Network as a Service Market Volume Share (%), by Country 2024 & 2032
- Figure 43: Europe Network as a Service Market Revenue (Million), by Type 2024 & 2032
- Figure 44: Europe Network as a Service Market Volume (K Unit), by Type 2024 & 2032
- Figure 45: Europe Network as a Service Market Revenue Share (%), by Type 2024 & 2032
- Figure 46: Europe Network as a Service Market Volume Share (%), by Type 2024 & 2032
- Figure 47: Europe Network as a Service Market Revenue (Million), by Application 2024 & 2032
- Figure 48: Europe Network as a Service Market Volume (K Unit), by Application 2024 & 2032
- Figure 49: Europe Network as a Service Market Revenue Share (%), by Application 2024 & 2032
- Figure 50: Europe Network as a Service Market Volume Share (%), by Application 2024 & 2032
- Figure 51: Europe Network as a Service Market Revenue (Million), by Industry Vertical 2024 & 2032
- Figure 52: Europe Network as a Service Market Volume (K Unit), by Industry Vertical 2024 & 2032
- Figure 53: Europe Network as a Service Market Revenue Share (%), by Industry Vertical 2024 & 2032
- Figure 54: Europe Network as a Service Market Volume Share (%), by Industry Vertical 2024 & 2032
- Figure 55: Europe Network as a Service Market Revenue (Million), by Country 2024 & 2032
- Figure 56: Europe Network as a Service Market Volume (K Unit), by Country 2024 & 2032
- Figure 57: Europe Network as a Service Market Revenue Share (%), by Country 2024 & 2032
- Figure 58: Europe Network as a Service Market Volume Share (%), by Country 2024 & 2032
- Figure 59: Asia Pacific Network as a Service Market Revenue (Million), by Type 2024 & 2032
- Figure 60: Asia Pacific Network as a Service Market Volume (K Unit), by Type 2024 & 2032
- Figure 61: Asia Pacific Network as a Service Market Revenue Share (%), by Type 2024 & 2032
- Figure 62: Asia Pacific Network as a Service Market Volume Share (%), by Type 2024 & 2032
- Figure 63: Asia Pacific Network as a Service Market Revenue (Million), by Application 2024 & 2032
- Figure 64: Asia Pacific Network as a Service Market Volume (K Unit), by Application 2024 & 2032
- Figure 65: Asia Pacific Network as a Service Market Revenue Share (%), by Application 2024 & 2032
- Figure 66: Asia Pacific Network as a Service Market Volume Share (%), by Application 2024 & 2032
- Figure 67: Asia Pacific Network as a Service Market Revenue (Million), by Industry Vertical 2024 & 2032
- Figure 68: Asia Pacific Network as a Service Market Volume (K Unit), by Industry Vertical 2024 & 2032
- Figure 69: Asia Pacific Network as a Service Market Revenue Share (%), by Industry Vertical 2024 & 2032
- Figure 70: Asia Pacific Network as a Service Market Volume Share (%), by Industry Vertical 2024 & 2032
- Figure 71: Asia Pacific Network as a Service Market Revenue (Million), by Country 2024 & 2032
- Figure 72: Asia Pacific Network as a Service Market Volume (K Unit), by Country 2024 & 2032
- Figure 73: Asia Pacific Network as a Service Market Revenue Share (%), by Country 2024 & 2032
- Figure 74: Asia Pacific Network as a Service Market Volume Share (%), by Country 2024 & 2032
- Figure 75: Latin America Network as a Service Market Revenue (Million), by Type 2024 & 2032
- Figure 76: Latin America Network as a Service Market Volume (K Unit), by Type 2024 & 2032
- Figure 77: Latin America Network as a Service Market Revenue Share (%), by Type 2024 & 2032
- Figure 78: Latin America Network as a Service Market Volume Share (%), by Type 2024 & 2032
- Figure 79: Latin America Network as a Service Market Revenue (Million), by Application 2024 & 2032
- Figure 80: Latin America Network as a Service Market Volume (K Unit), by Application 2024 & 2032
- Figure 81: Latin America Network as a Service Market Revenue Share (%), by Application 2024 & 2032
- Figure 82: Latin America Network as a Service Market Volume Share (%), by Application 2024 & 2032
- Figure 83: Latin America Network as a Service Market Revenue (Million), by Industry Vertical 2024 & 2032
- Figure 84: Latin America Network as a Service Market Volume (K Unit), by Industry Vertical 2024 & 2032
- Figure 85: Latin America Network as a Service Market Revenue Share (%), by Industry Vertical 2024 & 2032
- Figure 86: Latin America Network as a Service Market Volume Share (%), by Industry Vertical 2024 & 2032
- Figure 87: Latin America Network as a Service Market Revenue (Million), by Country 2024 & 2032
- Figure 88: Latin America Network as a Service Market Volume (K Unit), by Country 2024 & 2032
- Figure 89: Latin America Network as a Service Market Revenue Share (%), by Country 2024 & 2032
- Figure 90: Latin America Network as a Service Market Volume Share (%), by Country 2024 & 2032
- Figure 91: Middle East and Africa Network as a Service Market Revenue (Million), by Type 2024 & 2032
- Figure 92: Middle East and Africa Network as a Service Market Volume (K Unit), by Type 2024 & 2032
- Figure 93: Middle East and Africa Network as a Service Market Revenue Share (%), by Type 2024 & 2032
- Figure 94: Middle East and Africa Network as a Service Market Volume Share (%), by Type 2024 & 2032
- Figure 95: Middle East and Africa Network as a Service Market Revenue (Million), by Application 2024 & 2032
- Figure 96: Middle East and Africa Network as a Service Market Volume (K Unit), by Application 2024 & 2032
- Figure 97: Middle East and Africa Network as a Service Market Revenue Share (%), by Application 2024 & 2032
- Figure 98: Middle East and Africa Network as a Service Market Volume Share (%), by Application 2024 & 2032
- Figure 99: Middle East and Africa Network as a Service Market Revenue (Million), by Industry Vertical 2024 & 2032
- Figure 100: Middle East and Africa Network as a Service Market Volume (K Unit), by Industry Vertical 2024 & 2032
- Figure 101: Middle East and Africa Network as a Service Market Revenue Share (%), by Industry Vertical 2024 & 2032
- Figure 102: Middle East and Africa Network as a Service Market Volume Share (%), by Industry Vertical 2024 & 2032
- Figure 103: Middle East and Africa Network as a Service Market Revenue (Million), by Country 2024 & 2032
- Figure 104: Middle East and Africa Network as a Service Market Volume (K Unit), by Country 2024 & 2032
- Figure 105: Middle East and Africa Network as a Service Market Revenue Share (%), by Country 2024 & 2032
- Figure 106: Middle East and Africa Network as a Service Market Volume Share (%), by Country 2024 & 2032
List of Tables
- Table 1: Global Network as a Service Market Revenue Million Forecast, by Region 2019 & 2032
- Table 2: Global Network as a Service Market Volume K Unit Forecast, by Region 2019 & 2032
- Table 3: Global Network as a Service Market Revenue Million Forecast, by Type 2019 & 2032
- Table 4: Global Network as a Service Market Volume K Unit Forecast, by Type 2019 & 2032
- Table 5: Global Network as a Service Market Revenue Million Forecast, by Application 2019 & 2032
- Table 6: Global Network as a Service Market Volume K Unit Forecast, by Application 2019 & 2032
- Table 7: Global Network as a Service Market Revenue Million Forecast, by Industry Vertical 2019 & 2032
- Table 8: Global Network as a Service Market Volume K Unit Forecast, by Industry Vertical 2019 & 2032
- Table 9: Global Network as a Service Market Revenue Million Forecast, by Region 2019 & 2032
- Table 10: Global Network as a Service Market Volume K Unit Forecast, by Region 2019 & 2032
- Table 11: Global Network as a Service Market Revenue Million Forecast, by Country 2019 & 2032
- Table 12: Global Network as a Service Market Volume K Unit Forecast, by Country 2019 & 2032
- Table 13: United States Network as a Service Market Revenue (Million) Forecast, by Application 2019 & 2032
- Table 14: United States Network as a Service Market Volume (K Unit) Forecast, by Application 2019 & 2032
- Table 15: Canada Network as a Service Market Revenue (Million) Forecast, by Application 2019 & 2032
- Table 16: Canada Network as a Service Market Volume (K Unit) Forecast, by Application 2019 & 2032
- Table 17: Mexico Network as a Service Market Revenue (Million) Forecast, by Application 2019 & 2032
- Table 18: Mexico Network as a Service Market Volume (K Unit) Forecast, by Application 2019 & 2032
- Table 19: Global Network as a Service Market Revenue Million Forecast, by Country 2019 & 2032
- Table 20: Global Network as a Service Market Volume K Unit Forecast, by Country 2019 & 2032
- Table 21: Germany Network as a Service Market Revenue (Million) Forecast, by Application 2019 & 2032
- Table 22: Germany Network as a Service Market Volume (K Unit) Forecast, by Application 2019 & 2032
- Table 23: United Kingdom Network as a Service Market Revenue (Million) Forecast, by Application 2019 & 2032
- Table 24: United Kingdom Network as a Service Market Volume (K Unit) Forecast, by Application 2019 & 2032
- Table 25: France Network as a Service Market Revenue (Million) Forecast, by Application 2019 & 2032
- Table 26: France Network as a Service Market Volume (K Unit) Forecast, by Application 2019 & 2032
- Table 27: Spain Network as a Service Market Revenue (Million) Forecast, by Application 2019 & 2032
- Table 28: Spain Network as a Service Market Volume (K Unit) Forecast, by Application 2019 & 2032
- Table 29: Italy Network as a Service Market Revenue (Million) Forecast, by Application 2019 & 2032
- Table 30: Italy Network as a Service Market Volume (K Unit) Forecast, by Application 2019 & 2032
- Table 31: Spain Network as a Service Market Revenue (Million) Forecast, by Application 2019 & 2032
- Table 32: Spain Network as a Service Market Volume (K Unit) Forecast, by Application 2019 & 2032
- Table 33: Belgium Network as a Service Market Revenue (Million) Forecast, by Application 2019 & 2032
- Table 34: Belgium Network as a Service Market Volume (K Unit) Forecast, by Application 2019 & 2032
- Table 35: Netherland Network as a Service Market Revenue (Million) Forecast, by Application 2019 & 2032
- Table 36: Netherland Network as a Service Market Volume (K Unit) Forecast, by Application 2019 & 2032
- Table 37: Nordics Network as a Service Market Revenue (Million) Forecast, by Application 2019 & 2032
- Table 38: Nordics Network as a Service Market Volume (K Unit) Forecast, by Application 2019 & 2032
- Table 39: Rest of Europe Network as a Service Market Revenue (Million) Forecast, by Application 2019 & 2032
- Table 40: Rest of Europe Network as a Service Market Volume (K Unit) Forecast, by Application 2019 & 2032
- Table 41: Global Network as a Service Market Revenue Million Forecast, by Country 2019 & 2032
- Table 42: Global Network as a Service Market Volume K Unit Forecast, by Country 2019 & 2032
- Table 43: China Network as a Service Market Revenue (Million) Forecast, by Application 2019 & 2032
- Table 44: China Network as a Service Market Volume (K Unit) Forecast, by Application 2019 & 2032
- Table 45: Japan Network as a Service Market Revenue (Million) Forecast, by Application 2019 & 2032
- Table 46: Japan Network as a Service Market Volume (K Unit) Forecast, by Application 2019 & 2032
- Table 47: India Network as a Service Market Revenue (Million) Forecast, by Application 2019 & 2032
- Table 48: India Network as a Service Market Volume (K Unit) Forecast, by Application 2019 & 2032
- Table 49: South Korea Network as a Service Market Revenue (Million) Forecast, by Application 2019 & 2032
- Table 50: South Korea Network as a Service Market Volume (K Unit) Forecast, by Application 2019 & 2032
- Table 51: Southeast Asia Network as a Service Market Revenue (Million) Forecast, by Application 2019 & 2032
- Table 52: Southeast Asia Network as a Service Market Volume (K Unit) Forecast, by Application 2019 & 2032
- Table 53: Australia Network as a Service Market Revenue (Million) Forecast, by Application 2019 & 2032
- Table 54: Australia Network as a Service Market Volume (K Unit) Forecast, by Application 2019 & 2032
- Table 55: Indonesia Network as a Service Market Revenue (Million) Forecast, by Application 2019 & 2032
- Table 56: Indonesia Network as a Service Market Volume (K Unit) Forecast, by Application 2019 & 2032
- Table 57: Phillipes Network as a Service Market Revenue (Million) Forecast, by Application 2019 & 2032
- Table 58: Phillipes Network as a Service Market Volume (K Unit) Forecast, by Application 2019 & 2032
- Table 59: Singapore Network as a Service Market Revenue (Million) Forecast, by Application 2019 & 2032
- Table 60: Singapore Network as a Service Market Volume (K Unit) Forecast, by Application 2019 & 2032
- Table 61: Thailandc Network as a Service Market Revenue (Million) Forecast, by Application 2019 & 2032
- Table 62: Thailandc Network as a Service Market Volume (K Unit) Forecast, by Application 2019 & 2032
- Table 63: Rest of Asia Pacific Network as a Service Market Revenue (Million) Forecast, by Application 2019 & 2032
- Table 64: Rest of Asia Pacific Network as a Service Market Volume (K Unit) Forecast, by Application 2019 & 2032
- Table 65: Global Network as a Service Market Revenue Million Forecast, by Country 2019 & 2032
- Table 66: Global Network as a Service Market Volume K Unit Forecast, by Country 2019 & 2032
- Table 67: Brazil Network as a Service Market Revenue (Million) Forecast, by Application 2019 & 2032
- Table 68: Brazil Network as a Service Market Volume (K Unit) Forecast, by Application 2019 & 2032
- Table 69: Argentina Network as a Service Market Revenue (Million) Forecast, by Application 2019 & 2032
- Table 70: Argentina Network as a Service Market Volume (K Unit) Forecast, by Application 2019 & 2032
- Table 71: Peru Network as a Service Market Revenue (Million) Forecast, by Application 2019 & 2032
- Table 72: Peru Network as a Service Market Volume (K Unit) Forecast, by Application 2019 & 2032
- Table 73: Chile Network as a Service Market Revenue (Million) Forecast, by Application 2019 & 2032
- Table 74: Chile Network as a Service Market Volume (K Unit) Forecast, by Application 2019 & 2032
- Table 75: Colombia Network as a Service Market Revenue (Million) Forecast, by Application 2019 & 2032
- Table 76: Colombia Network as a Service Market Volume (K Unit) Forecast, by Application 2019 & 2032
- Table 77: Ecuador Network as a Service Market Revenue (Million) Forecast, by Application 2019 & 2032
- Table 78: Ecuador Network as a Service Market Volume (K Unit) Forecast, by Application 2019 & 2032
- Table 79: Venezuela Network as a Service Market Revenue (Million) Forecast, by Application 2019 & 2032
- Table 80: Venezuela Network as a Service Market Volume (K Unit) Forecast, by Application 2019 & 2032
- Table 81: Rest of South America Network as a Service Market Revenue (Million) Forecast, by Application 2019 & 2032
- Table 82: Rest of South America Network as a Service Market Volume (K Unit) Forecast, by Application 2019 & 2032
- Table 83: Global Network as a Service Market Revenue Million Forecast, by Country 2019 & 2032
- Table 84: Global Network as a Service Market Volume K Unit Forecast, by Country 2019 & 2032
- Table 85: United States Network as a Service Market Revenue (Million) Forecast, by Application 2019 & 2032
- Table 86: United States Network as a Service Market Volume (K Unit) Forecast, by Application 2019 & 2032
- Table 87: Canada Network as a Service Market Revenue (Million) Forecast, by Application 2019 & 2032
- Table 88: Canada Network as a Service Market Volume (K Unit) Forecast, by Application 2019 & 2032
- Table 89: Mexico Network as a Service Market Revenue (Million) Forecast, by Application 2019 & 2032
- Table 90: Mexico Network as a Service Market Volume (K Unit) Forecast, by Application 2019 & 2032
- Table 91: Global Network as a Service Market Revenue Million Forecast, by Country 2019 & 2032
- Table 92: Global Network as a Service Market Volume K Unit Forecast, by Country 2019 & 2032
- Table 93: United Arab Emirates Network as a Service Market Revenue (Million) Forecast, by Application 2019 & 2032
- Table 94: United Arab Emirates Network as a Service Market Volume (K Unit) Forecast, by Application 2019 & 2032
- Table 95: Saudi Arabia Network as a Service Market Revenue (Million) Forecast, by Application 2019 & 2032
- Table 96: Saudi Arabia Network as a Service Market Volume (K Unit) Forecast, by Application 2019 & 2032
- Table 97: South Africa Network as a Service Market Revenue (Million) Forecast, by Application 2019 & 2032
- Table 98: South Africa Network as a Service Market Volume (K Unit) Forecast, by Application 2019 & 2032
- Table 99: Rest of Middle East and Africa Network as a Service Market Revenue (Million) Forecast, by Application 2019 & 2032
- Table 100: Rest of Middle East and Africa Network as a Service Market Volume (K Unit) Forecast, by Application 2019 & 2032
- Table 101: Global Network as a Service Market Revenue Million Forecast, by Type 2019 & 2032
- Table 102: Global Network as a Service Market Volume K Unit Forecast, by Type 2019 & 2032
- Table 103: Global Network as a Service Market Revenue Million Forecast, by Application 2019 & 2032
- Table 104: Global Network as a Service Market Volume K Unit Forecast, by Application 2019 & 2032
- Table 105: Global Network as a Service Market Revenue Million Forecast, by Industry Vertical 2019 & 2032
- Table 106: Global Network as a Service Market Volume K Unit Forecast, by Industry Vertical 2019 & 2032
- Table 107: Global Network as a Service Market Revenue Million Forecast, by Country 2019 & 2032
- Table 108: Global Network as a Service Market Volume K Unit Forecast, by Country 2019 & 2032
- Table 109: United States Network as a Service Market Revenue (Million) Forecast, by Application 2019 & 2032
- Table 110: United States Network as a Service Market Volume (K Unit) Forecast, by Application 2019 & 2032
- Table 111: Canada Network as a Service Market Revenue (Million) Forecast, by Application 2019 & 2032
- Table 112: Canada Network as a Service Market Volume (K Unit) Forecast, by Application 2019 & 2032
- Table 113: Global Network as a Service Market Revenue Million Forecast, by Type 2019 & 2032
- Table 114: Global Network as a Service Market Volume K Unit Forecast, by Type 2019 & 2032
- Table 115: Global Network as a Service Market Revenue Million Forecast, by Application 2019 & 2032
- Table 116: Global Network as a Service Market Volume K Unit Forecast, by Application 2019 & 2032
- Table 117: Global Network as a Service Market Revenue Million Forecast, by Industry Vertical 2019 & 2032
- Table 118: Global Network as a Service Market Volume K Unit Forecast, by Industry Vertical 2019 & 2032
- Table 119: Global Network as a Service Market Revenue Million Forecast, by Country 2019 & 2032
- Table 120: Global Network as a Service Market Volume K Unit Forecast, by Country 2019 & 2032
- Table 121: United Kingdom Network as a Service Market Revenue (Million) Forecast, by Application 2019 & 2032
- Table 122: United Kingdom Network as a Service Market Volume (K Unit) Forecast, by Application 2019 & 2032
- Table 123: Germany Network as a Service Market Revenue (Million) Forecast, by Application 2019 & 2032
- Table 124: Germany Network as a Service Market Volume (K Unit) Forecast, by Application 2019 & 2032
- Table 125: France Network as a Service Market Revenue (Million) Forecast, by Application 2019 & 2032
- Table 126: France Network as a Service Market Volume (K Unit) Forecast, by Application 2019 & 2032
- Table 127: Rest of Europe Network as a Service Market Revenue (Million) Forecast, by Application 2019 & 2032
- Table 128: Rest of Europe Network as a Service Market Volume (K Unit) Forecast, by Application 2019 & 2032
- Table 129: Global Network as a Service Market Revenue Million Forecast, by Type 2019 & 2032
- Table 130: Global Network as a Service Market Volume K Unit Forecast, by Type 2019 & 2032
- Table 131: Global Network as a Service Market Revenue Million Forecast, by Application 2019 & 2032
- Table 132: Global Network as a Service Market Volume K Unit Forecast, by Application 2019 & 2032
- Table 133: Global Network as a Service Market Revenue Million Forecast, by Industry Vertical 2019 & 2032
- Table 134: Global Network as a Service Market Volume K Unit Forecast, by Industry Vertical 2019 & 2032
- Table 135: Global Network as a Service Market Revenue Million Forecast, by Country 2019 & 2032
- Table 136: Global Network as a Service Market Volume K Unit Forecast, by Country 2019 & 2032
- Table 137: China Network as a Service Market Revenue (Million) Forecast, by Application 2019 & 2032
- Table 138: China Network as a Service Market Volume (K Unit) Forecast, by Application 2019 & 2032
- Table 139: Japan Network as a Service Market Revenue (Million) Forecast, by Application 2019 & 2032
- Table 140: Japan Network as a Service Market Volume (K Unit) Forecast, by Application 2019 & 2032
- Table 141: India Network as a Service Market Revenue (Million) Forecast, by Application 2019 & 2032
- Table 142: India Network as a Service Market Volume (K Unit) Forecast, by Application 2019 & 2032
- Table 143: Rest of Asia Pacific Network as a Service Market Revenue (Million) Forecast, by Application 2019 & 2032
- Table 144: Rest of Asia Pacific Network as a Service Market Volume (K Unit) Forecast, by Application 2019 & 2032
- Table 145: Global Network as a Service Market Revenue Million Forecast, by Type 2019 & 2032
- Table 146: Global Network as a Service Market Volume K Unit Forecast, by Type 2019 & 2032
- Table 147: Global Network as a Service Market Revenue Million Forecast, by Application 2019 & 2032
- Table 148: Global Network as a Service Market Volume K Unit Forecast, by Application 2019 & 2032
- Table 149: Global Network as a Service Market Revenue Million Forecast, by Industry Vertical 2019 & 2032
- Table 150: Global Network as a Service Market Volume K Unit Forecast, by Industry Vertical 2019 & 2032
- Table 151: Global Network as a Service Market Revenue Million Forecast, by Country 2019 & 2032
- Table 152: Global Network as a Service Market Volume K Unit Forecast, by Country 2019 & 2032
- Table 153: Brazil Network as a Service Market Revenue (Million) Forecast, by Application 2019 & 2032
- Table 154: Brazil Network as a Service Market Volume (K Unit) Forecast, by Application 2019 & 2032
- Table 155: Argentina Network as a Service Market Revenue (Million) Forecast, by Application 2019 & 2032
- Table 156: Argentina Network as a Service Market Volume (K Unit) Forecast, by Application 2019 & 2032
- Table 157: Mexico Network as a Service Market Revenue (Million) Forecast, by Application 2019 & 2032
- Table 158: Mexico Network as a Service Market Volume (K Unit) Forecast, by Application 2019 & 2032
- Table 159: Rest of Latin America Network as a Service Market Revenue (Million) Forecast, by Application 2019 & 2032
- Table 160: Rest of Latin America Network as a Service Market Volume (K Unit) Forecast, by Application 2019 & 2032
- Table 161: Global Network as a Service Market Revenue Million Forecast, by Type 2019 & 2032
- Table 162: Global Network as a Service Market Volume K Unit Forecast, by Type 2019 & 2032
- Table 163: Global Network as a Service Market Revenue Million Forecast, by Application 2019 & 2032
- Table 164: Global Network as a Service Market Volume K Unit Forecast, by Application 2019 & 2032
- Table 165: Global Network as a Service Market Revenue Million Forecast, by Industry Vertical 2019 & 2032
- Table 166: Global Network as a Service Market Volume K Unit Forecast, by Industry Vertical 2019 & 2032
- Table 167: Global Network as a Service Market Revenue Million Forecast, by Country 2019 & 2032
- Table 168: Global Network as a Service Market Volume K Unit Forecast, by Country 2019 & 2032
- Table 169: United Arab Emirates Network as a Service Market Revenue (Million) Forecast, by Application 2019 & 2032
- Table 170: United Arab Emirates Network as a Service Market Volume (K Unit) Forecast, by Application 2019 & 2032
- Table 171: Saudi Arabia Network as a Service Market Revenue (Million) Forecast, by Application 2019 & 2032
- Table 172: Saudi Arabia Network as a Service Market Volume (K Unit) Forecast, by Application 2019 & 2032
- Table 173: Rest of Middle East and Africa Network as a Service Market Revenue (Million) Forecast, by Application 2019 & 2032
- Table 174: Rest of Middle East and Africa Network as a Service Market Volume (K Unit) Forecast, by Application 2019 & 2032
Frequently Asked Questions
1. What is the projected Compound Annual Growth Rate (CAGR) of the Network as a Service Market?
The projected CAGR is approximately 32.36%.
2. Which companies are prominent players in the Network as a Service Market?
Key companies in the market include Telstra Group Limited, AT&T Intellectual Property, CenturyLink, Cisco Systems Inc, Hewlett Packard Enterprise Development LP, GTT Communications Inc, Juniper Networks Inc, Masergy Communications Inc, DXC Technology Company, NEC Corporation, Broadcom , Meta Networks Ltd (Proofpoint), TD SYNNEX Corporation, VMware Inc, Akamai Technologie, Oracle, Verizon, Nokia (Alcatel Lucent), IBM.
3. What are the main segments of the Network as a Service Market?
The market segments include Type, Application, Industry Vertical.
4. Can you provide details about the market size?
The market size is estimated to be USD XX Million as of 2022.
5. What are some drivers contributing to market growth?
Increased Adoption of Cloud Services among Enterprises; Augmentation in Software-defined Networking (SDN) Integration with Existing Network Infrastructure.
6. What are the notable trends driving market growth?
Increased Adoption of Cloud Services among Enterprises to Drive the Market.
7. Are there any restraints impacting market growth?
Privacy and Data Security Concerns.
8. Can you provide examples of recent developments in the market?
March 2023 - Akamai Technologies announced an agreement to acquire Ondat, a cloud-based storage technology provider with a Kubernetes-native platform for running stateful applications anywhere at scale. Acquiring Ondat's cloud storage technology and industry-recognized talent will strengthen Akamai's cloud computing offerings.
9. What pricing options are available for accessing the report?
Pricing options include single-user, multi-user, and enterprise licenses priced at USD 4750, USD 5250, and USD 8750 respectively.
10. Is the market size provided in terms of value or volume?
The market size is provided in terms of value, measured in Million and volume, measured in K Unit.
11. Are there any specific market keywords associated with the report?
Yes, the market keyword associated with the report is "Network as a Service Market," which aids in identifying and referencing the specific market segment covered.
12. How do I determine which pricing option suits my needs best?
The pricing options vary based on user requirements and access needs. Individual users may opt for single-user licenses, while businesses requiring broader access may choose multi-user or enterprise licenses for cost-effective access to the report.
13. Are there any additional resources or data provided in the Network as a Service Market report?
While the report offers comprehensive insights, it's advisable to review the specific contents or supplementary materials provided to ascertain if additional resources or data are available.
14. How can I stay updated on further developments or reports in the Network as a Service Market?
To stay informed about further developments, trends, and reports in the Network as a Service Market, consider subscribing to industry newsletters, following relevant companies and organizations, or regularly checking reputable industry news sources and publications.
Methodology
Step 1 - Identification of Relevant Samples Size from Population Database


Step 2 - Approaches for Defining Global Market Size (Value, Volume* & Price*)

Note*: In applicable scenarios
Step 3 - Data Sources
Primary Research
- Web Analytics
- Survey Reports
- Research Institute
- Latest Research Reports
- Opinion Leaders
Secondary Research
- Annual Reports
- White Paper
- Latest Press Release
- Industry Association
- Paid Database
- Investor Presentations

Step 4 - Data Triangulation
Involves using different sources of information in order to increase the validity of a study
These sources are likely to be stakeholders in a program - participants, other researchers, program staff, other community members, and so on.
Then we put all data in single framework & apply various statistical tools to find out the dynamic on the market.
During the analysis stage, feedback from the stakeholder groups would be compared to determine areas of agreement as well as areas of divergence
