

Key Insights
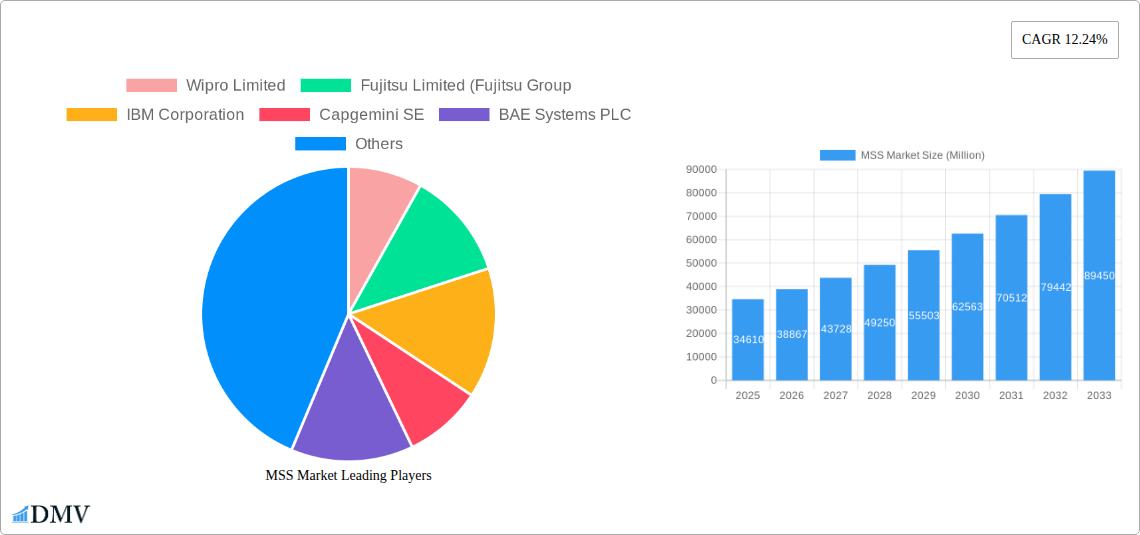
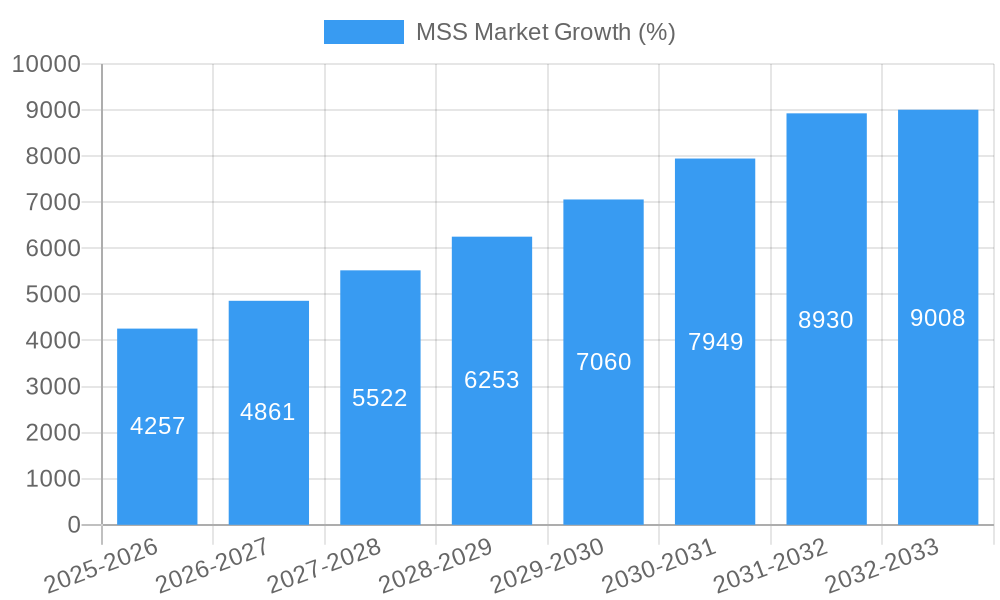
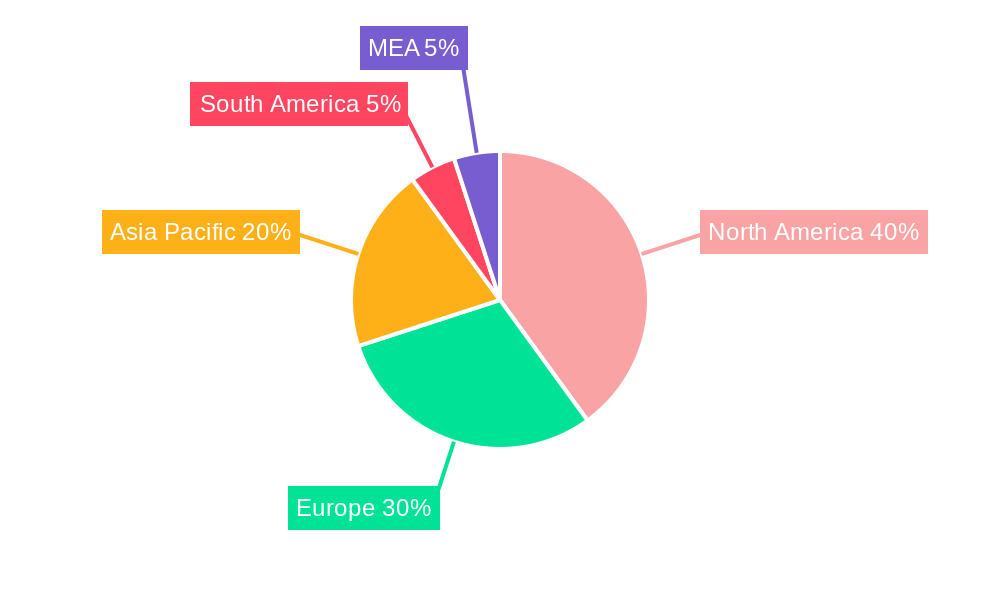
The Managed Security Services (MSS) market is experiencing robust growth, projected to reach \$34.61 billion in 2025 and exhibiting a Compound Annual Growth Rate (CAGR) of 12.24% from 2025 to 2033. This expansion is driven by several key factors. The increasing prevalence of sophisticated cyber threats, coupled with the growing reliance on cloud computing and the Internet of Things (IoT), necessitates robust security solutions. Organizations across various sectors, including BFSI, government and defense, and healthcare, are increasingly outsourcing their security functions to specialized MSS providers to benefit from their expertise, advanced technologies, and cost efficiencies. The adoption of cloud-based MSS solutions is a significant trend, offering scalability, flexibility, and reduced infrastructure costs. However, factors like the complexity of integrating MSS solutions with existing infrastructure and concerns regarding data privacy and security pose challenges to market growth. The market is segmented by end-user industry, deployment type (on-premise vs. cloud), solution type (intrusion detection, threat prevention, etc.), and managed security service provider. The North American market currently holds a significant share, but the Asia-Pacific region is expected to witness substantial growth fueled by increasing digitalization and infrastructure development.
The competitive landscape is characterized by a mix of established IT giants like IBM and Wipro, along with specialized MSS providers such as Secureworks and Trustwave. These companies are strategically investing in research and development, expanding their service offerings, and forging strategic partnerships to strengthen their market position. The market's future growth will be significantly impacted by advancements in artificial intelligence (AI) and machine learning (ML) for threat detection and response, the increasing adoption of zero-trust security models, and the growing demand for proactive security measures to prevent breaches rather than solely reacting to them. The continued evolution of cyber threats and the increasing regulatory pressure on data protection will further fuel the demand for advanced MSS solutions in the coming years.
MSS Market: A Comprehensive Report (2019-2033)
This insightful report provides a detailed analysis of the Managed Security Services (MSS) market, projecting a robust expansion from 2025 to 2033. The study encompasses a thorough examination of market composition, industry evolution, leading segments, technological innovations, and key players, offering valuable insights for stakeholders seeking to navigate this dynamic landscape. The report covers the period from 2019 to 2033, with 2025 as the base and estimated year. The forecast period is 2025-2033, and the historical period is 2019-2024. The global MSS market is estimated to reach xx Million by 2033.
MSS Market Composition & Trends
The MSS market exhibits a moderately concentrated landscape, with several major players vying for market share. The market share distribution is currently skewed towards established IT service providers, but increasing participation from specialized managed security service providers is anticipated. Innovation is driven by advancements in AI, automation, and cloud technologies. Stringent data privacy regulations, such as GDPR and CCPA, are significantly impacting market dynamics, driving demand for robust security solutions. Substitute products include in-house security teams, but the cost-effectiveness and expertise offered by MSS providers maintain a competitive advantage. End-users span diverse industries, from BFSI and Government & Defense to Retail, Manufacturing, Healthcare, and IT & Telecom. M&A activity is expected to intensify in the coming years, with deal values projected to reach xx Million annually by 2030.
- Market Concentration: Moderately concentrated, with a few large players holding significant shares.
- Innovation Catalysts: AI, automation, cloud computing, and threat intelligence platforms.
- Regulatory Landscape: GDPR, CCPA, and other data privacy regulations driving demand.
- Substitute Products: In-house security teams, but MSS offers cost-effectiveness and specialized expertise.
- End-User Profiles: Diversified, including BFSI, Government & Defense, Retail, Manufacturing, Healthcare, IT & Telecom, and other verticals.
- M&A Activity: Increasing, with projected annual deal values reaching xx Million by 2030.
MSS Market Industry Evolution
The MSS market has witnessed consistent growth throughout the historical period (2019-2024), driven by factors such as the increasing sophistication of cyber threats and rising concerns regarding data breaches. The adoption of cloud-based solutions, as well as the growth of IoT devices, has further accelerated market expansion. Technological advancements are continuously shaping the MSS landscape, with AI-powered threat detection, proactive security measures, and automated incident response becoming increasingly prevalent. Consumer demands are evolving, with a growing preference for managed services that offer comprehensive protection, reduced operational overhead, and enhanced visibility into security posture. The CAGR during the forecast period (2025-2033) is projected to be xx%. This growth is primarily due to increased adoption of cloud-based solutions and growing awareness of cybersecurity risks among businesses of all sizes.
Leading Regions, Countries, or Segments in MSS Market
The North American region currently holds the dominant position in the MSS market, driven by high levels of technological advancement, robust IT infrastructure, and a strong regulatory environment. However, other regions are expected to witness significant growth in the coming years.
By End-user Industry: BFSI and Government & Defense sectors are currently leading in MSS adoption due to stringent regulatory requirements and significant digital assets. However, growth is also expected in other sectors such as Healthcare, Manufacturing, Retail and IT and Telecom, driven by increasing digitalization.
By Deployment Type: Cloud-based deployment is witnessing higher growth rates compared to on-premise solutions owing to its scalability, cost-effectiveness, and enhanced accessibility.
By Solution Type: Intrusion Detection and Prevention, Threat Prevention, and End-point Security solutions represent significant market segments, driven by the evolving nature of cyber threats and growing need for comprehensive security measures.
Key Drivers: High levels of technological advancement (North America), stringent regulatory frameworks (Government & Defense), and the adoption of cloud technology (Cloud Deployment).
MSS Market Product Innovations
Recent innovations include AI-driven threat detection, automated incident response systems, and enhanced threat intelligence platforms. These advancements provide greater efficiency, accuracy, and scalability in managing security operations, offering unique selling propositions such as reduced alert fatigue, faster incident response times, and improved overall security posture.
Propelling Factors for MSS Market Growth
The growth of the MSS market is fueled by several factors. The rising frequency and severity of cyberattacks are compelling businesses to seek professional security expertise. The escalating adoption of cloud computing and the proliferation of IoT devices increase the attack surface, creating a heightened need for sophisticated security solutions. Favorable regulatory policies aimed at improving data privacy and security standards further drive market expansion.
Obstacles in the MSS Market Market
The MSS market faces challenges, including the high cost of implementation and maintenance. Skilled cybersecurity professionals are in short supply, limiting the availability of expertise. Supply chain disruptions can hinder service delivery. Intense competition from established players and new entrants puts pressure on pricing and profit margins.
Future Opportunities in MSS Market
Emerging opportunities lie in expanding into new geographical markets, particularly in developing economies. The integration of advanced technologies like blockchain and quantum computing presents potential for enhanced security solutions. Growing demand for security solutions tailored to specific industries, such as healthcare and finance, offers significant growth potential.
Major Players in the MSS Market Ecosystem
- Wipro Limited
- Fujitsu Limited
- IBM Corporation
- Capgemini SE
- BAE Systems PLC
- Verizon Communications Inc
- Broadcom Inc
- Secureworks Corp
- Atos SE
- Trustwave Holdings Inc (the Chertoff Group)
- Lumen Technologies Inc
- Fortra LLC
- AT&T Inc
Key Developments in MSS Market Industry
- September 2023: MicroAge launched MicroAge Managed Security Services (MSS), offering 24/7 cybersecurity monitoring and support.
- January 2024: Atturra partnered with MyCISO to enhance its managed security service for education and commercial sectors.
Strategic MSS Market Forecast
The MSS market is poised for continued growth, driven by persistent cybersecurity threats, increasing adoption of cloud services, and the ongoing demand for robust security solutions across various sectors. The market's future prospects remain positive, with significant growth opportunities in emerging technologies and expanding markets.
MSS Market Segmentation
-
1. Deployment Type
- 1.1. On-premise
- 1.2. Cloud
-
2. Solution Type
- 2.1. Intrusion Detection and Prevention
- 2.2. Threat Prevention
- 2.3. Distributed Denial of Services
- 2.4. Firewall Management
- 2.5. End-point Security
- 2.6. Risk Assessment
-
3. Managed Security Service Provider
- 3.1. IT Service Providers
- 3.2. Managed Security Specialist
- 3.3. Telecom Service Provider
-
4. End-user Industry
- 4.1. BFSI
- 4.2. Government and Defense
- 4.3. Retail
- 4.4. Manufacturing
- 4.5. Healthcare and Life Sciences
- 4.6. IT and Telecom
- 4.7. Other End-user Verticals
MSS Market Segmentation By Geography
- 1. North America
- 2. Europe
- 3. Asia
- 4. Australia and New Zealand
- 5. Latin America
- 6. Middle East and Africa
MSS Market REPORT HIGHLIGHTS
| Aspects | Details |
|---|---|
| Study Period | 2019-2033 |
| Base Year | 2024 |
| Estimated Year | 2025 |
| Forecast Period | 2025-2033 |
| Historical Period | 2019-2024 |
| Growth Rate | CAGR of 12.24% from 2019-2033 |
| Segmentation |
|
Table of Contents
- 1. Introduction
- 1.1. Research Scope
- 1.2. Market Segmentation
- 1.3. Research Methodology
- 1.4. Definitions and Assumptions
- 2. Executive Summary
- 2.1. Introduction
- 3. Market Dynamics
- 3.1. Introduction
- 3.2. Market Drivers
- 3.2.1 Rising Cyber Crime
- 3.2.2 Digital Disruption
- 3.2.3 and Increased Compliance Demands; Need for Threat Detection and Intelligence at an Early Stage Driving the Market Growth
- 3.3. Market Restrains
- 3.3.1. Lack of Awareness of Security Services is Discouraging the Market Expansion
- 3.4. Market Trends
- 3.4.1. BFSI Sector to be the Fastest-growing End-user Industry
- 4. Market Factor Analysis
- 4.1. Porters Five Forces
- 4.2. Supply/Value Chain
- 4.3. PESTEL analysis
- 4.4. Market Entropy
- 4.5. Patent/Trademark Analysis
- 5. Global MSS Market Analysis, Insights and Forecast, 2019-2031
- 5.1. Market Analysis, Insights and Forecast - by Deployment Type
- 5.1.1. On-premise
- 5.1.2. Cloud
- 5.2. Market Analysis, Insights and Forecast - by Solution Type
- 5.2.1. Intrusion Detection and Prevention
- 5.2.2. Threat Prevention
- 5.2.3. Distributed Denial of Services
- 5.2.4. Firewall Management
- 5.2.5. End-point Security
- 5.2.6. Risk Assessment
- 5.3. Market Analysis, Insights and Forecast - by Managed Security Service Provider
- 5.3.1. IT Service Providers
- 5.3.2. Managed Security Specialist
- 5.3.3. Telecom Service Provider
- 5.4. Market Analysis, Insights and Forecast - by End-user Industry
- 5.4.1. BFSI
- 5.4.2. Government and Defense
- 5.4.3. Retail
- 5.4.4. Manufacturing
- 5.4.5. Healthcare and Life Sciences
- 5.4.6. IT and Telecom
- 5.4.7. Other End-user Verticals
- 5.5. Market Analysis, Insights and Forecast - by Region
- 5.5.1. North America
- 5.5.2. Europe
- 5.5.3. Asia
- 5.5.4. Australia and New Zealand
- 5.5.5. Latin America
- 5.5.6. Middle East and Africa
- 5.1. Market Analysis, Insights and Forecast - by Deployment Type
- 6. North America MSS Market Analysis, Insights and Forecast, 2019-2031
- 6.1. Market Analysis, Insights and Forecast - by Deployment Type
- 6.1.1. On-premise
- 6.1.2. Cloud
- 6.2. Market Analysis, Insights and Forecast - by Solution Type
- 6.2.1. Intrusion Detection and Prevention
- 6.2.2. Threat Prevention
- 6.2.3. Distributed Denial of Services
- 6.2.4. Firewall Management
- 6.2.5. End-point Security
- 6.2.6. Risk Assessment
- 6.3. Market Analysis, Insights and Forecast - by Managed Security Service Provider
- 6.3.1. IT Service Providers
- 6.3.2. Managed Security Specialist
- 6.3.3. Telecom Service Provider
- 6.4. Market Analysis, Insights and Forecast - by End-user Industry
- 6.4.1. BFSI
- 6.4.2. Government and Defense
- 6.4.3. Retail
- 6.4.4. Manufacturing
- 6.4.5. Healthcare and Life Sciences
- 6.4.6. IT and Telecom
- 6.4.7. Other End-user Verticals
- 6.1. Market Analysis, Insights and Forecast - by Deployment Type
- 7. Europe MSS Market Analysis, Insights and Forecast, 2019-2031
- 7.1. Market Analysis, Insights and Forecast - by Deployment Type
- 7.1.1. On-premise
- 7.1.2. Cloud
- 7.2. Market Analysis, Insights and Forecast - by Solution Type
- 7.2.1. Intrusion Detection and Prevention
- 7.2.2. Threat Prevention
- 7.2.3. Distributed Denial of Services
- 7.2.4. Firewall Management
- 7.2.5. End-point Security
- 7.2.6. Risk Assessment
- 7.3. Market Analysis, Insights and Forecast - by Managed Security Service Provider
- 7.3.1. IT Service Providers
- 7.3.2. Managed Security Specialist
- 7.3.3. Telecom Service Provider
- 7.4. Market Analysis, Insights and Forecast - by End-user Industry
- 7.4.1. BFSI
- 7.4.2. Government and Defense
- 7.4.3. Retail
- 7.4.4. Manufacturing
- 7.4.5. Healthcare and Life Sciences
- 7.4.6. IT and Telecom
- 7.4.7. Other End-user Verticals
- 7.1. Market Analysis, Insights and Forecast - by Deployment Type
- 8. Asia MSS Market Analysis, Insights and Forecast, 2019-2031
- 8.1. Market Analysis, Insights and Forecast - by Deployment Type
- 8.1.1. On-premise
- 8.1.2. Cloud
- 8.2. Market Analysis, Insights and Forecast - by Solution Type
- 8.2.1. Intrusion Detection and Prevention
- 8.2.2. Threat Prevention
- 8.2.3. Distributed Denial of Services
- 8.2.4. Firewall Management
- 8.2.5. End-point Security
- 8.2.6. Risk Assessment
- 8.3. Market Analysis, Insights and Forecast - by Managed Security Service Provider
- 8.3.1. IT Service Providers
- 8.3.2. Managed Security Specialist
- 8.3.3. Telecom Service Provider
- 8.4. Market Analysis, Insights and Forecast - by End-user Industry
- 8.4.1. BFSI
- 8.4.2. Government and Defense
- 8.4.3. Retail
- 8.4.4. Manufacturing
- 8.4.5. Healthcare and Life Sciences
- 8.4.6. IT and Telecom
- 8.4.7. Other End-user Verticals
- 8.1. Market Analysis, Insights and Forecast - by Deployment Type
- 9. Australia and New Zealand MSS Market Analysis, Insights and Forecast, 2019-2031
- 9.1. Market Analysis, Insights and Forecast - by Deployment Type
- 9.1.1. On-premise
- 9.1.2. Cloud
- 9.2. Market Analysis, Insights and Forecast - by Solution Type
- 9.2.1. Intrusion Detection and Prevention
- 9.2.2. Threat Prevention
- 9.2.3. Distributed Denial of Services
- 9.2.4. Firewall Management
- 9.2.5. End-point Security
- 9.2.6. Risk Assessment
- 9.3. Market Analysis, Insights and Forecast - by Managed Security Service Provider
- 9.3.1. IT Service Providers
- 9.3.2. Managed Security Specialist
- 9.3.3. Telecom Service Provider
- 9.4. Market Analysis, Insights and Forecast - by End-user Industry
- 9.4.1. BFSI
- 9.4.2. Government and Defense
- 9.4.3. Retail
- 9.4.4. Manufacturing
- 9.4.5. Healthcare and Life Sciences
- 9.4.6. IT and Telecom
- 9.4.7. Other End-user Verticals
- 9.1. Market Analysis, Insights and Forecast - by Deployment Type
- 10. Latin America MSS Market Analysis, Insights and Forecast, 2019-2031
- 10.1. Market Analysis, Insights and Forecast - by Deployment Type
- 10.1.1. On-premise
- 10.1.2. Cloud
- 10.2. Market Analysis, Insights and Forecast - by Solution Type
- 10.2.1. Intrusion Detection and Prevention
- 10.2.2. Threat Prevention
- 10.2.3. Distributed Denial of Services
- 10.2.4. Firewall Management
- 10.2.5. End-point Security
- 10.2.6. Risk Assessment
- 10.3. Market Analysis, Insights and Forecast - by Managed Security Service Provider
- 10.3.1. IT Service Providers
- 10.3.2. Managed Security Specialist
- 10.3.3. Telecom Service Provider
- 10.4. Market Analysis, Insights and Forecast - by End-user Industry
- 10.4.1. BFSI
- 10.4.2. Government and Defense
- 10.4.3. Retail
- 10.4.4. Manufacturing
- 10.4.5. Healthcare and Life Sciences
- 10.4.6. IT and Telecom
- 10.4.7. Other End-user Verticals
- 10.1. Market Analysis, Insights and Forecast - by Deployment Type
- 11. Middle East and Africa MSS Market Analysis, Insights and Forecast, 2019-2031
- 11.1. Market Analysis, Insights and Forecast - by Deployment Type
- 11.1.1. On-premise
- 11.1.2. Cloud
- 11.2. Market Analysis, Insights and Forecast - by Solution Type
- 11.2.1. Intrusion Detection and Prevention
- 11.2.2. Threat Prevention
- 11.2.3. Distributed Denial of Services
- 11.2.4. Firewall Management
- 11.2.5. End-point Security
- 11.2.6. Risk Assessment
- 11.3. Market Analysis, Insights and Forecast - by Managed Security Service Provider
- 11.3.1. IT Service Providers
- 11.3.2. Managed Security Specialist
- 11.3.3. Telecom Service Provider
- 11.4. Market Analysis, Insights and Forecast - by End-user Industry
- 11.4.1. BFSI
- 11.4.2. Government and Defense
- 11.4.3. Retail
- 11.4.4. Manufacturing
- 11.4.5. Healthcare and Life Sciences
- 11.4.6. IT and Telecom
- 11.4.7. Other End-user Verticals
- 11.1. Market Analysis, Insights and Forecast - by Deployment Type
- 12. North America MSS Market Analysis, Insights and Forecast, 2019-2031
- 12.1. Market Analysis, Insights and Forecast - By Country/Sub-region
- 12.1.1 United States
- 12.1.2 Canada
- 12.1.3 Mexico
- 13. Europe MSS Market Analysis, Insights and Forecast, 2019-2031
- 13.1. Market Analysis, Insights and Forecast - By Country/Sub-region
- 13.1.1 Germany
- 13.1.2 United Kingdom
- 13.1.3 France
- 13.1.4 Spain
- 13.1.5 Italy
- 13.1.6 Spain
- 13.1.7 Belgium
- 13.1.8 Netherland
- 13.1.9 Nordics
- 13.1.10 Rest of Europe
- 14. Asia Pacific MSS Market Analysis, Insights and Forecast, 2019-2031
- 14.1. Market Analysis, Insights and Forecast - By Country/Sub-region
- 14.1.1 China
- 14.1.2 Japan
- 14.1.3 India
- 14.1.4 South Korea
- 14.1.5 Southeast Asia
- 14.1.6 Australia
- 14.1.7 Indonesia
- 14.1.8 Phillipes
- 14.1.9 Singapore
- 14.1.10 Thailandc
- 14.1.11 Rest of Asia Pacific
- 15. South America MSS Market Analysis, Insights and Forecast, 2019-2031
- 15.1. Market Analysis, Insights and Forecast - By Country/Sub-region
- 15.1.1 Brazil
- 15.1.2 Argentina
- 15.1.3 Peru
- 15.1.4 Chile
- 15.1.5 Colombia
- 15.1.6 Ecuador
- 15.1.7 Venezuela
- 15.1.8 Rest of South America
- 16. North America MSS Market Analysis, Insights and Forecast, 2019-2031
- 16.1. Market Analysis, Insights and Forecast - By Country/Sub-region
- 16.1.1 United States
- 16.1.2 Canada
- 16.1.3 Mexico
- 17. MEA MSS Market Analysis, Insights and Forecast, 2019-2031
- 17.1. Market Analysis, Insights and Forecast - By Country/Sub-region
- 17.1.1 United Arab Emirates
- 17.1.2 Saudi Arabia
- 17.1.3 South Africa
- 17.1.4 Rest of Middle East and Africa
- 18. Competitive Analysis
- 18.1. Global Market Share Analysis 2024
- 18.2. Company Profiles
- 18.2.1 Wipro Limited
- 18.2.1.1. Overview
- 18.2.1.2. Products
- 18.2.1.3. SWOT Analysis
- 18.2.1.4. Recent Developments
- 18.2.1.5. Financials (Based on Availability)
- 18.2.2 Fujitsu Limited (Fujitsu Group
- 18.2.2.1. Overview
- 18.2.2.2. Products
- 18.2.2.3. SWOT Analysis
- 18.2.2.4. Recent Developments
- 18.2.2.5. Financials (Based on Availability)
- 18.2.3 IBM Corporation
- 18.2.3.1. Overview
- 18.2.3.2. Products
- 18.2.3.3. SWOT Analysis
- 18.2.3.4. Recent Developments
- 18.2.3.5. Financials (Based on Availability)
- 18.2.4 Capgemini SE
- 18.2.4.1. Overview
- 18.2.4.2. Products
- 18.2.4.3. SWOT Analysis
- 18.2.4.4. Recent Developments
- 18.2.4.5. Financials (Based on Availability)
- 18.2.5 BAE Systems PLC
- 18.2.5.1. Overview
- 18.2.5.2. Products
- 18.2.5.3. SWOT Analysis
- 18.2.5.4. Recent Developments
- 18.2.5.5. Financials (Based on Availability)
- 18.2.6 Verizon Communications Inc
- 18.2.6.1. Overview
- 18.2.6.2. Products
- 18.2.6.3. SWOT Analysis
- 18.2.6.4. Recent Developments
- 18.2.6.5. Financials (Based on Availability)
- 18.2.7 Broadcom Inc
- 18.2.7.1. Overview
- 18.2.7.2. Products
- 18.2.7.3. SWOT Analysis
- 18.2.7.4. Recent Developments
- 18.2.7.5. Financials (Based on Availability)
- 18.2.8 Secureworks Corp
- 18.2.8.1. Overview
- 18.2.8.2. Products
- 18.2.8.3. SWOT Analysis
- 18.2.8.4. Recent Developments
- 18.2.8.5. Financials (Based on Availability)
- 18.2.9 Atos SE
- 18.2.9.1. Overview
- 18.2.9.2. Products
- 18.2.9.3. SWOT Analysis
- 18.2.9.4. Recent Developments
- 18.2.9.5. Financials (Based on Availability)
- 18.2.10 Trustwave Holdings Inc (the Chertoff Group)
- 18.2.10.1. Overview
- 18.2.10.2. Products
- 18.2.10.3. SWOT Analysis
- 18.2.10.4. Recent Developments
- 18.2.10.5. Financials (Based on Availability)
- 18.2.11 Lumen Technologies Inc
- 18.2.11.1. Overview
- 18.2.11.2. Products
- 18.2.11.3. SWOT Analysis
- 18.2.11.4. Recent Developments
- 18.2.11.5. Financials (Based on Availability)
- 18.2.12 Fortra LLC
- 18.2.12.1. Overview
- 18.2.12.2. Products
- 18.2.12.3. SWOT Analysis
- 18.2.12.4. Recent Developments
- 18.2.12.5. Financials (Based on Availability)
- 18.2.13 AT&T Inc
- 18.2.13.1. Overview
- 18.2.13.2. Products
- 18.2.13.3. SWOT Analysis
- 18.2.13.4. Recent Developments
- 18.2.13.5. Financials (Based on Availability)
- 18.2.1 Wipro Limited
List of Figures
- Figure 1: Global MSS Market Revenue Breakdown (Million, %) by Region 2024 & 2032
- Figure 2: Global MSS Market Volume Breakdown (K Unit, %) by Region 2024 & 2032
- Figure 3: North America MSS Market Revenue (Million), by Country 2024 & 2032
- Figure 4: North America MSS Market Volume (K Unit), by Country 2024 & 2032
- Figure 5: North America MSS Market Revenue Share (%), by Country 2024 & 2032
- Figure 6: North America MSS Market Volume Share (%), by Country 2024 & 2032
- Figure 7: Europe MSS Market Revenue (Million), by Country 2024 & 2032
- Figure 8: Europe MSS Market Volume (K Unit), by Country 2024 & 2032
- Figure 9: Europe MSS Market Revenue Share (%), by Country 2024 & 2032
- Figure 10: Europe MSS Market Volume Share (%), by Country 2024 & 2032
- Figure 11: Asia Pacific MSS Market Revenue (Million), by Country 2024 & 2032
- Figure 12: Asia Pacific MSS Market Volume (K Unit), by Country 2024 & 2032
- Figure 13: Asia Pacific MSS Market Revenue Share (%), by Country 2024 & 2032
- Figure 14: Asia Pacific MSS Market Volume Share (%), by Country 2024 & 2032
- Figure 15: South America MSS Market Revenue (Million), by Country 2024 & 2032
- Figure 16: South America MSS Market Volume (K Unit), by Country 2024 & 2032
- Figure 17: South America MSS Market Revenue Share (%), by Country 2024 & 2032
- Figure 18: South America MSS Market Volume Share (%), by Country 2024 & 2032
- Figure 19: North America MSS Market Revenue (Million), by Country 2024 & 2032
- Figure 20: North America MSS Market Volume (K Unit), by Country 2024 & 2032
- Figure 21: North America MSS Market Revenue Share (%), by Country 2024 & 2032
- Figure 22: North America MSS Market Volume Share (%), by Country 2024 & 2032
- Figure 23: MEA MSS Market Revenue (Million), by Country 2024 & 2032
- Figure 24: MEA MSS Market Volume (K Unit), by Country 2024 & 2032
- Figure 25: MEA MSS Market Revenue Share (%), by Country 2024 & 2032
- Figure 26: MEA MSS Market Volume Share (%), by Country 2024 & 2032
- Figure 27: North America MSS Market Revenue (Million), by Deployment Type 2024 & 2032
- Figure 28: North America MSS Market Volume (K Unit), by Deployment Type 2024 & 2032
- Figure 29: North America MSS Market Revenue Share (%), by Deployment Type 2024 & 2032
- Figure 30: North America MSS Market Volume Share (%), by Deployment Type 2024 & 2032
- Figure 31: North America MSS Market Revenue (Million), by Solution Type 2024 & 2032
- Figure 32: North America MSS Market Volume (K Unit), by Solution Type 2024 & 2032
- Figure 33: North America MSS Market Revenue Share (%), by Solution Type 2024 & 2032
- Figure 34: North America MSS Market Volume Share (%), by Solution Type 2024 & 2032
- Figure 35: North America MSS Market Revenue (Million), by Managed Security Service Provider 2024 & 2032
- Figure 36: North America MSS Market Volume (K Unit), by Managed Security Service Provider 2024 & 2032
- Figure 37: North America MSS Market Revenue Share (%), by Managed Security Service Provider 2024 & 2032
- Figure 38: North America MSS Market Volume Share (%), by Managed Security Service Provider 2024 & 2032
- Figure 39: North America MSS Market Revenue (Million), by End-user Industry 2024 & 2032
- Figure 40: North America MSS Market Volume (K Unit), by End-user Industry 2024 & 2032
- Figure 41: North America MSS Market Revenue Share (%), by End-user Industry 2024 & 2032
- Figure 42: North America MSS Market Volume Share (%), by End-user Industry 2024 & 2032
- Figure 43: North America MSS Market Revenue (Million), by Country 2024 & 2032
- Figure 44: North America MSS Market Volume (K Unit), by Country 2024 & 2032
- Figure 45: North America MSS Market Revenue Share (%), by Country 2024 & 2032
- Figure 46: North America MSS Market Volume Share (%), by Country 2024 & 2032
- Figure 47: Europe MSS Market Revenue (Million), by Deployment Type 2024 & 2032
- Figure 48: Europe MSS Market Volume (K Unit), by Deployment Type 2024 & 2032
- Figure 49: Europe MSS Market Revenue Share (%), by Deployment Type 2024 & 2032
- Figure 50: Europe MSS Market Volume Share (%), by Deployment Type 2024 & 2032
- Figure 51: Europe MSS Market Revenue (Million), by Solution Type 2024 & 2032
- Figure 52: Europe MSS Market Volume (K Unit), by Solution Type 2024 & 2032
- Figure 53: Europe MSS Market Revenue Share (%), by Solution Type 2024 & 2032
- Figure 54: Europe MSS Market Volume Share (%), by Solution Type 2024 & 2032
- Figure 55: Europe MSS Market Revenue (Million), by Managed Security Service Provider 2024 & 2032
- Figure 56: Europe MSS Market Volume (K Unit), by Managed Security Service Provider 2024 & 2032
- Figure 57: Europe MSS Market Revenue Share (%), by Managed Security Service Provider 2024 & 2032
- Figure 58: Europe MSS Market Volume Share (%), by Managed Security Service Provider 2024 & 2032
- Figure 59: Europe MSS Market Revenue (Million), by End-user Industry 2024 & 2032
- Figure 60: Europe MSS Market Volume (K Unit), by End-user Industry 2024 & 2032
- Figure 61: Europe MSS Market Revenue Share (%), by End-user Industry 2024 & 2032
- Figure 62: Europe MSS Market Volume Share (%), by End-user Industry 2024 & 2032
- Figure 63: Europe MSS Market Revenue (Million), by Country 2024 & 2032
- Figure 64: Europe MSS Market Volume (K Unit), by Country 2024 & 2032
- Figure 65: Europe MSS Market Revenue Share (%), by Country 2024 & 2032
- Figure 66: Europe MSS Market Volume Share (%), by Country 2024 & 2032
- Figure 67: Asia MSS Market Revenue (Million), by Deployment Type 2024 & 2032
- Figure 68: Asia MSS Market Volume (K Unit), by Deployment Type 2024 & 2032
- Figure 69: Asia MSS Market Revenue Share (%), by Deployment Type 2024 & 2032
- Figure 70: Asia MSS Market Volume Share (%), by Deployment Type 2024 & 2032
- Figure 71: Asia MSS Market Revenue (Million), by Solution Type 2024 & 2032
- Figure 72: Asia MSS Market Volume (K Unit), by Solution Type 2024 & 2032
- Figure 73: Asia MSS Market Revenue Share (%), by Solution Type 2024 & 2032
- Figure 74: Asia MSS Market Volume Share (%), by Solution Type 2024 & 2032
- Figure 75: Asia MSS Market Revenue (Million), by Managed Security Service Provider 2024 & 2032
- Figure 76: Asia MSS Market Volume (K Unit), by Managed Security Service Provider 2024 & 2032
- Figure 77: Asia MSS Market Revenue Share (%), by Managed Security Service Provider 2024 & 2032
- Figure 78: Asia MSS Market Volume Share (%), by Managed Security Service Provider 2024 & 2032
- Figure 79: Asia MSS Market Revenue (Million), by End-user Industry 2024 & 2032
- Figure 80: Asia MSS Market Volume (K Unit), by End-user Industry 2024 & 2032
- Figure 81: Asia MSS Market Revenue Share (%), by End-user Industry 2024 & 2032
- Figure 82: Asia MSS Market Volume Share (%), by End-user Industry 2024 & 2032
- Figure 83: Asia MSS Market Revenue (Million), by Country 2024 & 2032
- Figure 84: Asia MSS Market Volume (K Unit), by Country 2024 & 2032
- Figure 85: Asia MSS Market Revenue Share (%), by Country 2024 & 2032
- Figure 86: Asia MSS Market Volume Share (%), by Country 2024 & 2032
- Figure 87: Australia and New Zealand MSS Market Revenue (Million), by Deployment Type 2024 & 2032
- Figure 88: Australia and New Zealand MSS Market Volume (K Unit), by Deployment Type 2024 & 2032
- Figure 89: Australia and New Zealand MSS Market Revenue Share (%), by Deployment Type 2024 & 2032
- Figure 90: Australia and New Zealand MSS Market Volume Share (%), by Deployment Type 2024 & 2032
- Figure 91: Australia and New Zealand MSS Market Revenue (Million), by Solution Type 2024 & 2032
- Figure 92: Australia and New Zealand MSS Market Volume (K Unit), by Solution Type 2024 & 2032
- Figure 93: Australia and New Zealand MSS Market Revenue Share (%), by Solution Type 2024 & 2032
- Figure 94: Australia and New Zealand MSS Market Volume Share (%), by Solution Type 2024 & 2032
- Figure 95: Australia and New Zealand MSS Market Revenue (Million), by Managed Security Service Provider 2024 & 2032
- Figure 96: Australia and New Zealand MSS Market Volume (K Unit), by Managed Security Service Provider 2024 & 2032
- Figure 97: Australia and New Zealand MSS Market Revenue Share (%), by Managed Security Service Provider 2024 & 2032
- Figure 98: Australia and New Zealand MSS Market Volume Share (%), by Managed Security Service Provider 2024 & 2032
- Figure 99: Australia and New Zealand MSS Market Revenue (Million), by End-user Industry 2024 & 2032
- Figure 100: Australia and New Zealand MSS Market Volume (K Unit), by End-user Industry 2024 & 2032
- Figure 101: Australia and New Zealand MSS Market Revenue Share (%), by End-user Industry 2024 & 2032
- Figure 102: Australia and New Zealand MSS Market Volume Share (%), by End-user Industry 2024 & 2032
- Figure 103: Australia and New Zealand MSS Market Revenue (Million), by Country 2024 & 2032
- Figure 104: Australia and New Zealand MSS Market Volume (K Unit), by Country 2024 & 2032
- Figure 105: Australia and New Zealand MSS Market Revenue Share (%), by Country 2024 & 2032
- Figure 106: Australia and New Zealand MSS Market Volume Share (%), by Country 2024 & 2032
- Figure 107: Latin America MSS Market Revenue (Million), by Deployment Type 2024 & 2032
- Figure 108: Latin America MSS Market Volume (K Unit), by Deployment Type 2024 & 2032
- Figure 109: Latin America MSS Market Revenue Share (%), by Deployment Type 2024 & 2032
- Figure 110: Latin America MSS Market Volume Share (%), by Deployment Type 2024 & 2032
- Figure 111: Latin America MSS Market Revenue (Million), by Solution Type 2024 & 2032
- Figure 112: Latin America MSS Market Volume (K Unit), by Solution Type 2024 & 2032
- Figure 113: Latin America MSS Market Revenue Share (%), by Solution Type 2024 & 2032
- Figure 114: Latin America MSS Market Volume Share (%), by Solution Type 2024 & 2032
- Figure 115: Latin America MSS Market Revenue (Million), by Managed Security Service Provider 2024 & 2032
- Figure 116: Latin America MSS Market Volume (K Unit), by Managed Security Service Provider 2024 & 2032
- Figure 117: Latin America MSS Market Revenue Share (%), by Managed Security Service Provider 2024 & 2032
- Figure 118: Latin America MSS Market Volume Share (%), by Managed Security Service Provider 2024 & 2032
- Figure 119: Latin America MSS Market Revenue (Million), by End-user Industry 2024 & 2032
- Figure 120: Latin America MSS Market Volume (K Unit), by End-user Industry 2024 & 2032
- Figure 121: Latin America MSS Market Revenue Share (%), by End-user Industry 2024 & 2032
- Figure 122: Latin America MSS Market Volume Share (%), by End-user Industry 2024 & 2032
- Figure 123: Latin America MSS Market Revenue (Million), by Country 2024 & 2032
- Figure 124: Latin America MSS Market Volume (K Unit), by Country 2024 & 2032
- Figure 125: Latin America MSS Market Revenue Share (%), by Country 2024 & 2032
- Figure 126: Latin America MSS Market Volume Share (%), by Country 2024 & 2032
- Figure 127: Middle East and Africa MSS Market Revenue (Million), by Deployment Type 2024 & 2032
- Figure 128: Middle East and Africa MSS Market Volume (K Unit), by Deployment Type 2024 & 2032
- Figure 129: Middle East and Africa MSS Market Revenue Share (%), by Deployment Type 2024 & 2032
- Figure 130: Middle East and Africa MSS Market Volume Share (%), by Deployment Type 2024 & 2032
- Figure 131: Middle East and Africa MSS Market Revenue (Million), by Solution Type 2024 & 2032
- Figure 132: Middle East and Africa MSS Market Volume (K Unit), by Solution Type 2024 & 2032
- Figure 133: Middle East and Africa MSS Market Revenue Share (%), by Solution Type 2024 & 2032
- Figure 134: Middle East and Africa MSS Market Volume Share (%), by Solution Type 2024 & 2032
- Figure 135: Middle East and Africa MSS Market Revenue (Million), by Managed Security Service Provider 2024 & 2032
- Figure 136: Middle East and Africa MSS Market Volume (K Unit), by Managed Security Service Provider 2024 & 2032
- Figure 137: Middle East and Africa MSS Market Revenue Share (%), by Managed Security Service Provider 2024 & 2032
- Figure 138: Middle East and Africa MSS Market Volume Share (%), by Managed Security Service Provider 2024 & 2032
- Figure 139: Middle East and Africa MSS Market Revenue (Million), by End-user Industry 2024 & 2032
- Figure 140: Middle East and Africa MSS Market Volume (K Unit), by End-user Industry 2024 & 2032
- Figure 141: Middle East and Africa MSS Market Revenue Share (%), by End-user Industry 2024 & 2032
- Figure 142: Middle East and Africa MSS Market Volume Share (%), by End-user Industry 2024 & 2032
- Figure 143: Middle East and Africa MSS Market Revenue (Million), by Country 2024 & 2032
- Figure 144: Middle East and Africa MSS Market Volume (K Unit), by Country 2024 & 2032
- Figure 145: Middle East and Africa MSS Market Revenue Share (%), by Country 2024 & 2032
- Figure 146: Middle East and Africa MSS Market Volume Share (%), by Country 2024 & 2032
List of Tables
- Table 1: Global MSS Market Revenue Million Forecast, by Region 2019 & 2032
- Table 2: Global MSS Market Volume K Unit Forecast, by Region 2019 & 2032
- Table 3: Global MSS Market Revenue Million Forecast, by Deployment Type 2019 & 2032
- Table 4: Global MSS Market Volume K Unit Forecast, by Deployment Type 2019 & 2032
- Table 5: Global MSS Market Revenue Million Forecast, by Solution Type 2019 & 2032
- Table 6: Global MSS Market Volume K Unit Forecast, by Solution Type 2019 & 2032
- Table 7: Global MSS Market Revenue Million Forecast, by Managed Security Service Provider 2019 & 2032
- Table 8: Global MSS Market Volume K Unit Forecast, by Managed Security Service Provider 2019 & 2032
- Table 9: Global MSS Market Revenue Million Forecast, by End-user Industry 2019 & 2032
- Table 10: Global MSS Market Volume K Unit Forecast, by End-user Industry 2019 & 2032
- Table 11: Global MSS Market Revenue Million Forecast, by Region 2019 & 2032
- Table 12: Global MSS Market Volume K Unit Forecast, by Region 2019 & 2032
- Table 13: Global MSS Market Revenue Million Forecast, by Country 2019 & 2032
- Table 14: Global MSS Market Volume K Unit Forecast, by Country 2019 & 2032
- Table 15: United States MSS Market Revenue (Million) Forecast, by Application 2019 & 2032
- Table 16: United States MSS Market Volume (K Unit) Forecast, by Application 2019 & 2032
- Table 17: Canada MSS Market Revenue (Million) Forecast, by Application 2019 & 2032
- Table 18: Canada MSS Market Volume (K Unit) Forecast, by Application 2019 & 2032
- Table 19: Mexico MSS Market Revenue (Million) Forecast, by Application 2019 & 2032
- Table 20: Mexico MSS Market Volume (K Unit) Forecast, by Application 2019 & 2032
- Table 21: Global MSS Market Revenue Million Forecast, by Country 2019 & 2032
- Table 22: Global MSS Market Volume K Unit Forecast, by Country 2019 & 2032
- Table 23: Germany MSS Market Revenue (Million) Forecast, by Application 2019 & 2032
- Table 24: Germany MSS Market Volume (K Unit) Forecast, by Application 2019 & 2032
- Table 25: United Kingdom MSS Market Revenue (Million) Forecast, by Application 2019 & 2032
- Table 26: United Kingdom MSS Market Volume (K Unit) Forecast, by Application 2019 & 2032
- Table 27: France MSS Market Revenue (Million) Forecast, by Application 2019 & 2032
- Table 28: France MSS Market Volume (K Unit) Forecast, by Application 2019 & 2032
- Table 29: Spain MSS Market Revenue (Million) Forecast, by Application 2019 & 2032
- Table 30: Spain MSS Market Volume (K Unit) Forecast, by Application 2019 & 2032
- Table 31: Italy MSS Market Revenue (Million) Forecast, by Application 2019 & 2032
- Table 32: Italy MSS Market Volume (K Unit) Forecast, by Application 2019 & 2032
- Table 33: Spain MSS Market Revenue (Million) Forecast, by Application 2019 & 2032
- Table 34: Spain MSS Market Volume (K Unit) Forecast, by Application 2019 & 2032
- Table 35: Belgium MSS Market Revenue (Million) Forecast, by Application 2019 & 2032
- Table 36: Belgium MSS Market Volume (K Unit) Forecast, by Application 2019 & 2032
- Table 37: Netherland MSS Market Revenue (Million) Forecast, by Application 2019 & 2032
- Table 38: Netherland MSS Market Volume (K Unit) Forecast, by Application 2019 & 2032
- Table 39: Nordics MSS Market Revenue (Million) Forecast, by Application 2019 & 2032
- Table 40: Nordics MSS Market Volume (K Unit) Forecast, by Application 2019 & 2032
- Table 41: Rest of Europe MSS Market Revenue (Million) Forecast, by Application 2019 & 2032
- Table 42: Rest of Europe MSS Market Volume (K Unit) Forecast, by Application 2019 & 2032
- Table 43: Global MSS Market Revenue Million Forecast, by Country 2019 & 2032
- Table 44: Global MSS Market Volume K Unit Forecast, by Country 2019 & 2032
- Table 45: China MSS Market Revenue (Million) Forecast, by Application 2019 & 2032
- Table 46: China MSS Market Volume (K Unit) Forecast, by Application 2019 & 2032
- Table 47: Japan MSS Market Revenue (Million) Forecast, by Application 2019 & 2032
- Table 48: Japan MSS Market Volume (K Unit) Forecast, by Application 2019 & 2032
- Table 49: India MSS Market Revenue (Million) Forecast, by Application 2019 & 2032
- Table 50: India MSS Market Volume (K Unit) Forecast, by Application 2019 & 2032
- Table 51: South Korea MSS Market Revenue (Million) Forecast, by Application 2019 & 2032
- Table 52: South Korea MSS Market Volume (K Unit) Forecast, by Application 2019 & 2032
- Table 53: Southeast Asia MSS Market Revenue (Million) Forecast, by Application 2019 & 2032
- Table 54: Southeast Asia MSS Market Volume (K Unit) Forecast, by Application 2019 & 2032
- Table 55: Australia MSS Market Revenue (Million) Forecast, by Application 2019 & 2032
- Table 56: Australia MSS Market Volume (K Unit) Forecast, by Application 2019 & 2032
- Table 57: Indonesia MSS Market Revenue (Million) Forecast, by Application 2019 & 2032
- Table 58: Indonesia MSS Market Volume (K Unit) Forecast, by Application 2019 & 2032
- Table 59: Phillipes MSS Market Revenue (Million) Forecast, by Application 2019 & 2032
- Table 60: Phillipes MSS Market Volume (K Unit) Forecast, by Application 2019 & 2032
- Table 61: Singapore MSS Market Revenue (Million) Forecast, by Application 2019 & 2032
- Table 62: Singapore MSS Market Volume (K Unit) Forecast, by Application 2019 & 2032
- Table 63: Thailandc MSS Market Revenue (Million) Forecast, by Application 2019 & 2032
- Table 64: Thailandc MSS Market Volume (K Unit) Forecast, by Application 2019 & 2032
- Table 65: Rest of Asia Pacific MSS Market Revenue (Million) Forecast, by Application 2019 & 2032
- Table 66: Rest of Asia Pacific MSS Market Volume (K Unit) Forecast, by Application 2019 & 2032
- Table 67: Global MSS Market Revenue Million Forecast, by Country 2019 & 2032
- Table 68: Global MSS Market Volume K Unit Forecast, by Country 2019 & 2032
- Table 69: Brazil MSS Market Revenue (Million) Forecast, by Application 2019 & 2032
- Table 70: Brazil MSS Market Volume (K Unit) Forecast, by Application 2019 & 2032
- Table 71: Argentina MSS Market Revenue (Million) Forecast, by Application 2019 & 2032
- Table 72: Argentina MSS Market Volume (K Unit) Forecast, by Application 2019 & 2032
- Table 73: Peru MSS Market Revenue (Million) Forecast, by Application 2019 & 2032
- Table 74: Peru MSS Market Volume (K Unit) Forecast, by Application 2019 & 2032
- Table 75: Chile MSS Market Revenue (Million) Forecast, by Application 2019 & 2032
- Table 76: Chile MSS Market Volume (K Unit) Forecast, by Application 2019 & 2032
- Table 77: Colombia MSS Market Revenue (Million) Forecast, by Application 2019 & 2032
- Table 78: Colombia MSS Market Volume (K Unit) Forecast, by Application 2019 & 2032
- Table 79: Ecuador MSS Market Revenue (Million) Forecast, by Application 2019 & 2032
- Table 80: Ecuador MSS Market Volume (K Unit) Forecast, by Application 2019 & 2032
- Table 81: Venezuela MSS Market Revenue (Million) Forecast, by Application 2019 & 2032
- Table 82: Venezuela MSS Market Volume (K Unit) Forecast, by Application 2019 & 2032
- Table 83: Rest of South America MSS Market Revenue (Million) Forecast, by Application 2019 & 2032
- Table 84: Rest of South America MSS Market Volume (K Unit) Forecast, by Application 2019 & 2032
- Table 85: Global MSS Market Revenue Million Forecast, by Country 2019 & 2032
- Table 86: Global MSS Market Volume K Unit Forecast, by Country 2019 & 2032
- Table 87: United States MSS Market Revenue (Million) Forecast, by Application 2019 & 2032
- Table 88: United States MSS Market Volume (K Unit) Forecast, by Application 2019 & 2032
- Table 89: Canada MSS Market Revenue (Million) Forecast, by Application 2019 & 2032
- Table 90: Canada MSS Market Volume (K Unit) Forecast, by Application 2019 & 2032
- Table 91: Mexico MSS Market Revenue (Million) Forecast, by Application 2019 & 2032
- Table 92: Mexico MSS Market Volume (K Unit) Forecast, by Application 2019 & 2032
- Table 93: Global MSS Market Revenue Million Forecast, by Country 2019 & 2032
- Table 94: Global MSS Market Volume K Unit Forecast, by Country 2019 & 2032
- Table 95: United Arab Emirates MSS Market Revenue (Million) Forecast, by Application 2019 & 2032
- Table 96: United Arab Emirates MSS Market Volume (K Unit) Forecast, by Application 2019 & 2032
- Table 97: Saudi Arabia MSS Market Revenue (Million) Forecast, by Application 2019 & 2032
- Table 98: Saudi Arabia MSS Market Volume (K Unit) Forecast, by Application 2019 & 2032
- Table 99: South Africa MSS Market Revenue (Million) Forecast, by Application 2019 & 2032
- Table 100: South Africa MSS Market Volume (K Unit) Forecast, by Application 2019 & 2032
- Table 101: Rest of Middle East and Africa MSS Market Revenue (Million) Forecast, by Application 2019 & 2032
- Table 102: Rest of Middle East and Africa MSS Market Volume (K Unit) Forecast, by Application 2019 & 2032
- Table 103: Global MSS Market Revenue Million Forecast, by Deployment Type 2019 & 2032
- Table 104: Global MSS Market Volume K Unit Forecast, by Deployment Type 2019 & 2032
- Table 105: Global MSS Market Revenue Million Forecast, by Solution Type 2019 & 2032
- Table 106: Global MSS Market Volume K Unit Forecast, by Solution Type 2019 & 2032
- Table 107: Global MSS Market Revenue Million Forecast, by Managed Security Service Provider 2019 & 2032
- Table 108: Global MSS Market Volume K Unit Forecast, by Managed Security Service Provider 2019 & 2032
- Table 109: Global MSS Market Revenue Million Forecast, by End-user Industry 2019 & 2032
- Table 110: Global MSS Market Volume K Unit Forecast, by End-user Industry 2019 & 2032
- Table 111: Global MSS Market Revenue Million Forecast, by Country 2019 & 2032
- Table 112: Global MSS Market Volume K Unit Forecast, by Country 2019 & 2032
- Table 113: Global MSS Market Revenue Million Forecast, by Deployment Type 2019 & 2032
- Table 114: Global MSS Market Volume K Unit Forecast, by Deployment Type 2019 & 2032
- Table 115: Global MSS Market Revenue Million Forecast, by Solution Type 2019 & 2032
- Table 116: Global MSS Market Volume K Unit Forecast, by Solution Type 2019 & 2032
- Table 117: Global MSS Market Revenue Million Forecast, by Managed Security Service Provider 2019 & 2032
- Table 118: Global MSS Market Volume K Unit Forecast, by Managed Security Service Provider 2019 & 2032
- Table 119: Global MSS Market Revenue Million Forecast, by End-user Industry 2019 & 2032
- Table 120: Global MSS Market Volume K Unit Forecast, by End-user Industry 2019 & 2032
- Table 121: Global MSS Market Revenue Million Forecast, by Country 2019 & 2032
- Table 122: Global MSS Market Volume K Unit Forecast, by Country 2019 & 2032
- Table 123: Global MSS Market Revenue Million Forecast, by Deployment Type 2019 & 2032
- Table 124: Global MSS Market Volume K Unit Forecast, by Deployment Type 2019 & 2032
- Table 125: Global MSS Market Revenue Million Forecast, by Solution Type 2019 & 2032
- Table 126: Global MSS Market Volume K Unit Forecast, by Solution Type 2019 & 2032
- Table 127: Global MSS Market Revenue Million Forecast, by Managed Security Service Provider 2019 & 2032
- Table 128: Global MSS Market Volume K Unit Forecast, by Managed Security Service Provider 2019 & 2032
- Table 129: Global MSS Market Revenue Million Forecast, by End-user Industry 2019 & 2032
- Table 130: Global MSS Market Volume K Unit Forecast, by End-user Industry 2019 & 2032
- Table 131: Global MSS Market Revenue Million Forecast, by Country 2019 & 2032
- Table 132: Global MSS Market Volume K Unit Forecast, by Country 2019 & 2032
- Table 133: Global MSS Market Revenue Million Forecast, by Deployment Type 2019 & 2032
- Table 134: Global MSS Market Volume K Unit Forecast, by Deployment Type 2019 & 2032
- Table 135: Global MSS Market Revenue Million Forecast, by Solution Type 2019 & 2032
- Table 136: Global MSS Market Volume K Unit Forecast, by Solution Type 2019 & 2032
- Table 137: Global MSS Market Revenue Million Forecast, by Managed Security Service Provider 2019 & 2032
- Table 138: Global MSS Market Volume K Unit Forecast, by Managed Security Service Provider 2019 & 2032
- Table 139: Global MSS Market Revenue Million Forecast, by End-user Industry 2019 & 2032
- Table 140: Global MSS Market Volume K Unit Forecast, by End-user Industry 2019 & 2032
- Table 141: Global MSS Market Revenue Million Forecast, by Country 2019 & 2032
- Table 142: Global MSS Market Volume K Unit Forecast, by Country 2019 & 2032
- Table 143: Global MSS Market Revenue Million Forecast, by Deployment Type 2019 & 2032
- Table 144: Global MSS Market Volume K Unit Forecast, by Deployment Type 2019 & 2032
- Table 145: Global MSS Market Revenue Million Forecast, by Solution Type 2019 & 2032
- Table 146: Global MSS Market Volume K Unit Forecast, by Solution Type 2019 & 2032
- Table 147: Global MSS Market Revenue Million Forecast, by Managed Security Service Provider 2019 & 2032
- Table 148: Global MSS Market Volume K Unit Forecast, by Managed Security Service Provider 2019 & 2032
- Table 149: Global MSS Market Revenue Million Forecast, by End-user Industry 2019 & 2032
- Table 150: Global MSS Market Volume K Unit Forecast, by End-user Industry 2019 & 2032
- Table 151: Global MSS Market Revenue Million Forecast, by Country 2019 & 2032
- Table 152: Global MSS Market Volume K Unit Forecast, by Country 2019 & 2032
- Table 153: Global MSS Market Revenue Million Forecast, by Deployment Type 2019 & 2032
- Table 154: Global MSS Market Volume K Unit Forecast, by Deployment Type 2019 & 2032
- Table 155: Global MSS Market Revenue Million Forecast, by Solution Type 2019 & 2032
- Table 156: Global MSS Market Volume K Unit Forecast, by Solution Type 2019 & 2032
- Table 157: Global MSS Market Revenue Million Forecast, by Managed Security Service Provider 2019 & 2032
- Table 158: Global MSS Market Volume K Unit Forecast, by Managed Security Service Provider 2019 & 2032
- Table 159: Global MSS Market Revenue Million Forecast, by End-user Industry 2019 & 2032
- Table 160: Global MSS Market Volume K Unit Forecast, by End-user Industry 2019 & 2032
- Table 161: Global MSS Market Revenue Million Forecast, by Country 2019 & 2032
- Table 162: Global MSS Market Volume K Unit Forecast, by Country 2019 & 2032
Frequently Asked Questions
1. What is the projected Compound Annual Growth Rate (CAGR) of the MSS Market?
The projected CAGR is approximately 12.24%.
2. Which companies are prominent players in the MSS Market?
Key companies in the market include Wipro Limited, Fujitsu Limited (Fujitsu Group, IBM Corporation, Capgemini SE, BAE Systems PLC, Verizon Communications Inc, Broadcom Inc, Secureworks Corp, Atos SE, Trustwave Holdings Inc (the Chertoff Group), Lumen Technologies Inc, Fortra LLC, AT&T Inc.
3. What are the main segments of the MSS Market?
The market segments include Deployment Type, Solution Type, Managed Security Service Provider, End-user Industry.
4. Can you provide details about the market size?
The market size is estimated to be USD 34.61 Million as of 2022.
5. What are some drivers contributing to market growth?
Rising Cyber Crime. Digital Disruption. and Increased Compliance Demands; Need for Threat Detection and Intelligence at an Early Stage Driving the Market Growth.
6. What are the notable trends driving market growth?
BFSI Sector to be the Fastest-growing End-user Industry.
7. Are there any restraints impacting market growth?
Lack of Awareness of Security Services is Discouraging the Market Expansion.
8. Can you provide examples of recent developments in the market?
January 2024 - Atturra partnered with Sydney-based startup MyCISO to underpin its managed service for security program management in the education and commercial sectors. The MyCISO SaaS platform is designed to power and deliver assessments and management of security programs.
9. What pricing options are available for accessing the report?
Pricing options include single-user, multi-user, and enterprise licenses priced at USD 4750, USD 5250, and USD 8750 respectively.
10. Is the market size provided in terms of value or volume?
The market size is provided in terms of value, measured in Million and volume, measured in K Unit.
11. Are there any specific market keywords associated with the report?
Yes, the market keyword associated with the report is "MSS Market," which aids in identifying and referencing the specific market segment covered.
12. How do I determine which pricing option suits my needs best?
The pricing options vary based on user requirements and access needs. Individual users may opt for single-user licenses, while businesses requiring broader access may choose multi-user or enterprise licenses for cost-effective access to the report.
13. Are there any additional resources or data provided in the MSS Market report?
While the report offers comprehensive insights, it's advisable to review the specific contents or supplementary materials provided to ascertain if additional resources or data are available.
14. How can I stay updated on further developments or reports in the MSS Market?
To stay informed about further developments, trends, and reports in the MSS Market, consider subscribing to industry newsletters, following relevant companies and organizations, or regularly checking reputable industry news sources and publications.
Methodology
Step 1 - Identification of Relevant Samples Size from Population Database


Step 2 - Approaches for Defining Global Market Size (Value, Volume* & Price*)

Note*: In applicable scenarios
Step 3 - Data Sources
Primary Research
- Web Analytics
- Survey Reports
- Research Institute
- Latest Research Reports
- Opinion Leaders
Secondary Research
- Annual Reports
- White Paper
- Latest Press Release
- Industry Association
- Paid Database
- Investor Presentations

Step 4 - Data Triangulation
Involves using different sources of information in order to increase the validity of a study
These sources are likely to be stakeholders in a program - participants, other researchers, program staff, other community members, and so on.
Then we put all data in single framework & apply various statistical tools to find out the dynamic on the market.
During the analysis stage, feedback from the stakeholder groups would be compared to determine areas of agreement as well as areas of divergence
