

Key Insights
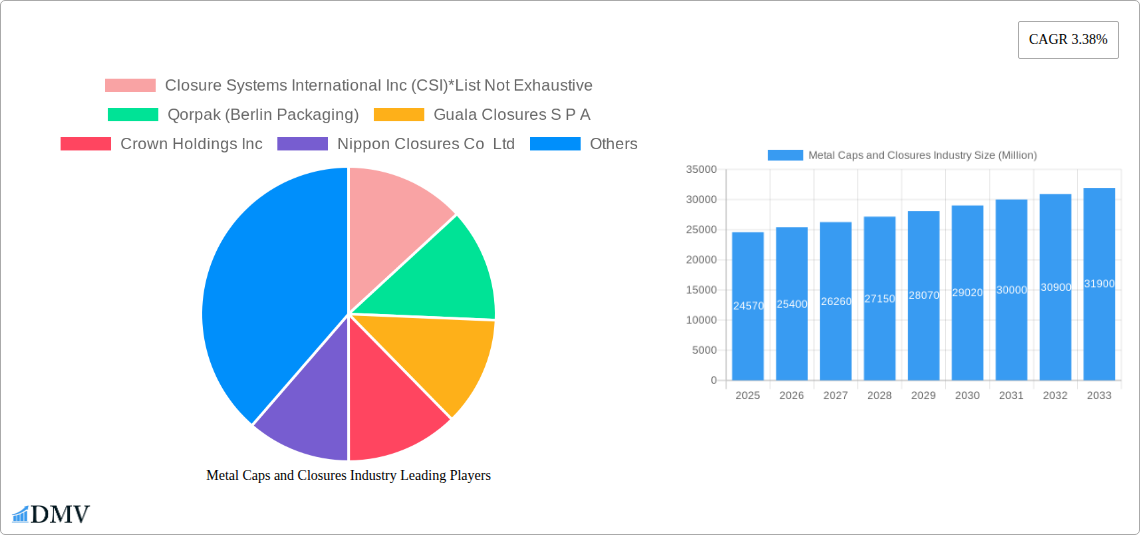
The global metal caps and closures market, valued at $24.57 billion in 2025, is projected to experience steady growth, driven by the burgeoning food and beverage industry, particularly in developing economies. A compound annual growth rate (CAGR) of 3.38% from 2025 to 2033 indicates a significant expansion potential. Key growth drivers include the increasing demand for convenient packaging solutions, the rising preference for packaged foods and beverages, and the growing adoption of tamper-evident closures for enhanced product safety and brand protection. The market segmentation reveals a strong preference for aluminum and steel materials due to their durability and cost-effectiveness. Crown caps maintain a significant market share, although screw caps and twist-off metal caps are gaining popularity due to their ease of use and consumer convenience. While the food and beverage sector dominates end-user demand, pharmaceuticals and personal care are also contributing significantly to market expansion. Geographic distribution shows strong growth potential in Asia-Pacific, driven by rising disposable incomes and increasing consumption. However, fluctuating raw material prices and the emergence of alternative packaging materials pose potential restraints to market growth. Competitive landscape analysis highlights key players like Closure Systems International, Crown Holdings, and Guala Closures, constantly innovating to improve product offerings and expand their market presence.
The forecast period (2025-2033) suggests continued expansion across various segments. Aluminum caps are expected to maintain their dominance due to their lightweight nature and recyclability, aligning with growing environmental concerns. Screw caps will likely gain traction due to their superior sealing capabilities and consumer preference for convenience. The food and beverage industry, driven by global population growth and changing consumption patterns, will remain the primary driver of demand. Companies will focus on sustainability initiatives, exploring eco-friendly materials and improving recycling infrastructure to meet evolving consumer demands. Strategic partnerships, mergers, and acquisitions are anticipated to reshape the competitive landscape, further fueling market growth and innovation. Regional analysis points towards strong growth prospects in emerging markets, requiring targeted strategies for market penetration and localization.
Metal Caps and Closures Industry: A Comprehensive Market Report (2019-2033)
This insightful report provides a detailed analysis of the global Metal Caps and Closures industry, offering a comprehensive overview of market trends, leading players, and future growth prospects. Valued at xx Million in 2025, the industry is poised for significant expansion, reaching xx Million by 2033. The report covers the period 2019-2033, with 2025 serving as the base and estimated year. This in-depth analysis will equip stakeholders with crucial data and actionable insights to navigate this dynamic market.
Metal Caps and Closures Industry Market Composition & Trends
The global metal caps and closures market is characterized by a moderately concentrated landscape, with key players like Closure Systems International Inc (CSI), Qorpak (Berlin Packaging), Guala Closures S P A, Crown Holdings Inc, Nippon Closures Co Ltd, Amcor PLC, Pelliconi & C SpA, SKS Bottle & Packaging Inc, Alameda Packaging LLC, Silgan White Cap LLC, and O Berk Company holding significant market shares. Innovation is driven by increasing demand for sustainable and tamper-evident closures, alongside advancements in materials science and manufacturing technologies. Stringent regulations regarding food safety and product integrity impact market dynamics. Substitute products, such as plastic closures, pose a challenge, while ongoing mergers and acquisitions (M&A) activity reshape the competitive landscape.
- Market Share Distribution: CSI holds approximately xx% market share in 2025, followed by Crown Holdings Inc. at xx% and Guala Closures S P A at xx%. The remaining market share is distributed among other key players and smaller regional companies.
- M&A Activity: Recent years have witnessed significant M&A activity, with deal values exceeding xx Million in the past five years, primarily driven by consolidation efforts and expansion into new geographic markets. These activities significantly influence market concentration and competitive dynamics.
- End-User Profiles: The industry caters to diverse end-user sectors, including food and beverages (dominating with xx% of the market in 2025), pharmaceuticals, personal care, and others. The food and beverage industry's continuous growth and increasing demand for convenient packaging fuels market expansion.
Metal Caps and Closures Industry Industry Evolution
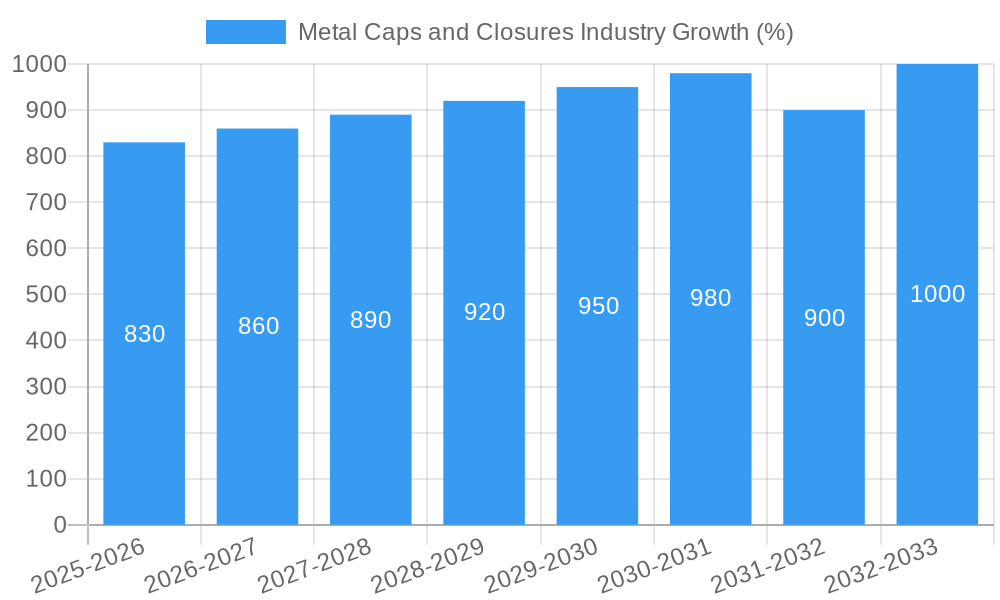
The metal caps and closures industry has witnessed consistent growth throughout the historical period (2019-2024), experiencing a Compound Annual Growth Rate (CAGR) of xx% from 2019 to 2024. This growth is projected to continue into the forecast period (2025-2033), with a projected CAGR of xx%. This positive trajectory is fuelled by several factors, including increasing demand from the food and beverage sector, coupled with a rise in consumer preference for convenient and tamper-evident packaging. Technological advancements in materials science and manufacturing techniques have enabled the development of innovative closures with enhanced performance, contributing to industry growth. Consumer demand for sustainable and eco-friendly packaging is another crucial factor, prompting manufacturers to invest in lightweight, recyclable materials and optimized production processes. The increasing popularity of ready-to-drink beverages and packaged foods globally further fuels the industry's expansion.
Leading Regions, Countries, or Segments in Metal Caps and Closures Industry
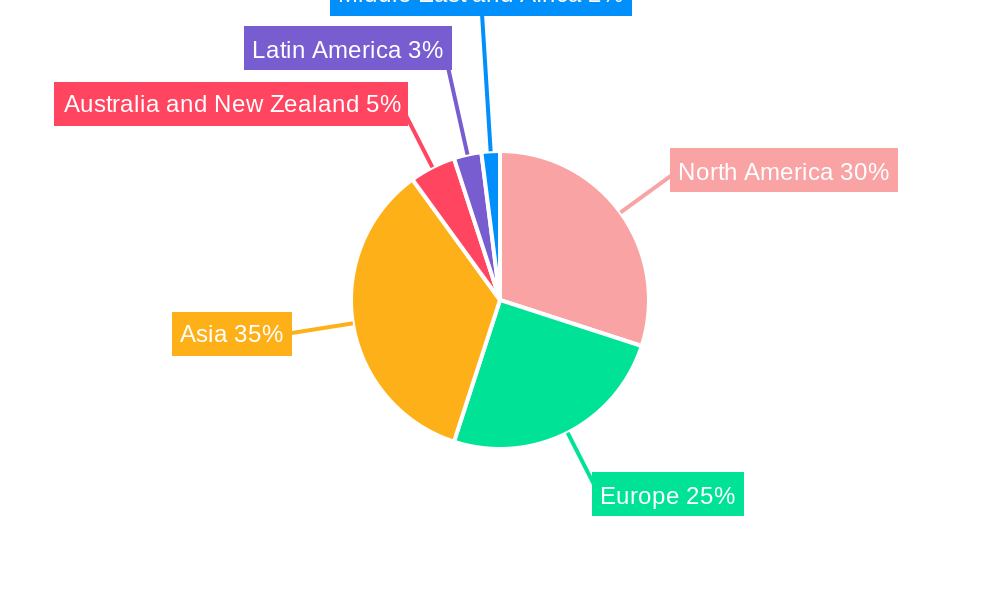
The North American region is currently the leading market, followed closely by Europe and Asia-Pacific, holding roughly xx%, xx%, and xx% market share respectively in 2025. Within the material type segment, aluminum dominates, accounting for xx% of the market share due to its lightweight nature, recyclability, and corrosion resistance. Crown caps continue to hold a significant portion of the closures type market in 2025, followed by screw caps and twist metal caps. The food and beverage industry is the primary end-user, driving a significant portion of demand.
- Key Drivers:
- Strong Investment Trends: Significant investments in R&D for advanced closure materials and production technologies.
- Regulatory Support: Government regulations emphasizing food safety and consumer protection are pushing the adoption of advanced closures.
- Expanding Consumer Base: Growth in emerging economies and increasing disposable incomes lead to higher demand.
Metal Caps and Closures Industry Product Innovations
Recent innovations focus on enhancing functionality, sustainability, and consumer experience. Lightweight aluminum closures with improved sealing properties and easy-open features are gaining traction. The development of recyclable and biodegradable materials is a key focus for environmentally conscious manufacturers. Smart closures with integrated sensors for product authentication and tamper-evidence are emerging as cutting-edge technologies. These innovations address growing concerns around food safety, product authenticity, and environmental sustainability.
Propelling Factors for Metal Caps and Closures Industry Growth
Several factors contribute to industry growth. Technological advancements lead to improved closure designs, increasing efficiency and functionality. The expanding food and beverage industry, particularly the growth in ready-to-drink beverages and packaged foods, fuels significant demand. Favorable government regulations promoting sustainable packaging solutions drive adoption of eco-friendly materials and designs. These combined factors create a robust foundation for continued industry growth.
Obstacles in the Metal Caps and Closures Industry Market
The industry faces challenges including fluctuating raw material prices which increase production costs and reduce profitability. Supply chain disruptions can impact production and delivery timelines. Intense competition among established players and the emergence of new entrants creates competitive pressures. Stringent regulatory compliance requirements in certain regions adds cost and complexity to the manufacturing process. These combined challenges affect profitability and sustained growth.
Future Opportunities in Metal Caps and Closures Industry
Future opportunities lie in the development of sustainable, lightweight, and functional closures. The increasing demand for personalized packaging and smart closures creates new avenues for innovation. Expanding into emerging markets with high growth potential offers further expansion opportunities. Developing closures with unique functionalities, such as integrated sensors for tamper evidence or brand authentication, can provide competitive advantages.
Major Players in the Metal Caps and Closures Industry Ecosystem
- Closure Systems International Inc (CSI)
- Qorpak (Berlin Packaging)
- Guala Closures S P A
- Crown Holdings Inc
- Nippon Closures Co Ltd
- Amcor PLC
- Pelliconi & C SpA
- SKS Bottle & Packaging Inc
- Alameda Packaging LLC
- Silgan White Cap LLC
- O Berk Company
Key Developments in Metal Caps and Closures Industry Industry
- January 2023: Guala Closures Group's SBTi validation for its 2030 GHG emission targets signifies a strong commitment to sustainability, influencing industry practices.
- March 2022: Pelliconi's opening of an outpost in San Francisco highlights a focus on innovation and market expansion in the US, signifying a shift in geographical reach.
Strategic Metal Caps and Closures Industry Market Forecast
The metal caps and closures market is projected to experience robust growth driven by ongoing technological advancements, increasing demand from key end-use sectors, and a growing emphasis on sustainable packaging solutions. Expanding into emerging markets, coupled with innovation in material science and manufacturing processes, will fuel the market's potential for continued expansion in the coming years, ensuring a positive outlook for industry stakeholders.
Metal Caps and Closures Industry Segmentation
-
1. Material Type
- 1.1. Aluminium
- 1.2. Steel
- 1.3. Tin
-
2. Closures Type
- 2.1. Crown Caps
- 2.2. Screw Caps
- 2.3. Twist Metal Caps
- 2.4. Other Cl
-
3. End-User Industry
- 3.1. Food
-
3.2. Beverages
- 3.2.1. Alcoholic
- 3.2.2. Non-Alcoholic
- 3.3. Pharmaceuticals
- 3.4. Personal Care
- 3.5. Other End-User Industries
Metal Caps and Closures Industry Segmentation By Geography
- 1. North America
- 2. Europe
- 3. Asia
- 4. Australia and New Zealand
- 5. Latin America
- 6. Middle East and Africa
Metal Caps and Closures Industry REPORT HIGHLIGHTS
| Aspects | Details |
|---|---|
| Study Period | 2019-2033 |
| Base Year | 2024 |
| Estimated Year | 2025 |
| Forecast Period | 2025-2033 |
| Historical Period | 2019-2024 |
| Growth Rate | CAGR of 3.38% from 2019-2033 |
| Segmentation |
|
Table of Contents
- 1. Introduction
- 1.1. Research Scope
- 1.2. Market Segmentation
- 1.3. Research Methodology
- 1.4. Definitions and Assumptions
- 2. Executive Summary
- 2.1. Introduction
- 3. Market Dynamics
- 3.1. Introduction
- 3.2. Market Drivers
- 3.2.1. Increasing Consumption of Beverages with a Rising Need for Sustainable Packaging Materials; Superior Properties Compared to Other Closure Materials
- 3.3. Market Restrains
- 3.3.1. High Adoption Rate of Other Types of Closure Materials
- 3.4. Market Trends
- 3.4.1. Pharmaceutical Application Offers Potential Growth
- 4. Market Factor Analysis
- 4.1. Porters Five Forces
- 4.2. Supply/Value Chain
- 4.3. PESTEL analysis
- 4.4. Market Entropy
- 4.5. Patent/Trademark Analysis
- 5. Global Metal Caps and Closures Industry Analysis, Insights and Forecast, 2019-2031
- 5.1. Market Analysis, Insights and Forecast - by Material Type
- 5.1.1. Aluminium
- 5.1.2. Steel
- 5.1.3. Tin
- 5.2. Market Analysis, Insights and Forecast - by Closures Type
- 5.2.1. Crown Caps
- 5.2.2. Screw Caps
- 5.2.3. Twist Metal Caps
- 5.2.4. Other Cl
- 5.3. Market Analysis, Insights and Forecast - by End-User Industry
- 5.3.1. Food
- 5.3.2. Beverages
- 5.3.2.1. Alcoholic
- 5.3.2.2. Non-Alcoholic
- 5.3.3. Pharmaceuticals
- 5.3.4. Personal Care
- 5.3.5. Other End-User Industries
- 5.4. Market Analysis, Insights and Forecast - by Region
- 5.4.1. North America
- 5.4.2. Europe
- 5.4.3. Asia
- 5.4.4. Australia and New Zealand
- 5.4.5. Latin America
- 5.4.6. Middle East and Africa
- 5.1. Market Analysis, Insights and Forecast - by Material Type
- 6. North America Metal Caps and Closures Industry Analysis, Insights and Forecast, 2019-2031
- 6.1. Market Analysis, Insights and Forecast - by Material Type
- 6.1.1. Aluminium
- 6.1.2. Steel
- 6.1.3. Tin
- 6.2. Market Analysis, Insights and Forecast - by Closures Type
- 6.2.1. Crown Caps
- 6.2.2. Screw Caps
- 6.2.3. Twist Metal Caps
- 6.2.4. Other Cl
- 6.3. Market Analysis, Insights and Forecast - by End-User Industry
- 6.3.1. Food
- 6.3.2. Beverages
- 6.3.2.1. Alcoholic
- 6.3.2.2. Non-Alcoholic
- 6.3.3. Pharmaceuticals
- 6.3.4. Personal Care
- 6.3.5. Other End-User Industries
- 6.1. Market Analysis, Insights and Forecast - by Material Type
- 7. Europe Metal Caps and Closures Industry Analysis, Insights and Forecast, 2019-2031
- 7.1. Market Analysis, Insights and Forecast - by Material Type
- 7.1.1. Aluminium
- 7.1.2. Steel
- 7.1.3. Tin
- 7.2. Market Analysis, Insights and Forecast - by Closures Type
- 7.2.1. Crown Caps
- 7.2.2. Screw Caps
- 7.2.3. Twist Metal Caps
- 7.2.4. Other Cl
- 7.3. Market Analysis, Insights and Forecast - by End-User Industry
- 7.3.1. Food
- 7.3.2. Beverages
- 7.3.2.1. Alcoholic
- 7.3.2.2. Non-Alcoholic
- 7.3.3. Pharmaceuticals
- 7.3.4. Personal Care
- 7.3.5. Other End-User Industries
- 7.1. Market Analysis, Insights and Forecast - by Material Type
- 8. Asia Metal Caps and Closures Industry Analysis, Insights and Forecast, 2019-2031
- 8.1. Market Analysis, Insights and Forecast - by Material Type
- 8.1.1. Aluminium
- 8.1.2. Steel
- 8.1.3. Tin
- 8.2. Market Analysis, Insights and Forecast - by Closures Type
- 8.2.1. Crown Caps
- 8.2.2. Screw Caps
- 8.2.3. Twist Metal Caps
- 8.2.4. Other Cl
- 8.3. Market Analysis, Insights and Forecast - by End-User Industry
- 8.3.1. Food
- 8.3.2. Beverages
- 8.3.2.1. Alcoholic
- 8.3.2.2. Non-Alcoholic
- 8.3.3. Pharmaceuticals
- 8.3.4. Personal Care
- 8.3.5. Other End-User Industries
- 8.1. Market Analysis, Insights and Forecast - by Material Type
- 9. Australia and New Zealand Metal Caps and Closures Industry Analysis, Insights and Forecast, 2019-2031
- 9.1. Market Analysis, Insights and Forecast - by Material Type
- 9.1.1. Aluminium
- 9.1.2. Steel
- 9.1.3. Tin
- 9.2. Market Analysis, Insights and Forecast - by Closures Type
- 9.2.1. Crown Caps
- 9.2.2. Screw Caps
- 9.2.3. Twist Metal Caps
- 9.2.4. Other Cl
- 9.3. Market Analysis, Insights and Forecast - by End-User Industry
- 9.3.1. Food
- 9.3.2. Beverages
- 9.3.2.1. Alcoholic
- 9.3.2.2. Non-Alcoholic
- 9.3.3. Pharmaceuticals
- 9.3.4. Personal Care
- 9.3.5. Other End-User Industries
- 9.1. Market Analysis, Insights and Forecast - by Material Type
- 10. Latin America Metal Caps and Closures Industry Analysis, Insights and Forecast, 2019-2031
- 10.1. Market Analysis, Insights and Forecast - by Material Type
- 10.1.1. Aluminium
- 10.1.2. Steel
- 10.1.3. Tin
- 10.2. Market Analysis, Insights and Forecast - by Closures Type
- 10.2.1. Crown Caps
- 10.2.2. Screw Caps
- 10.2.3. Twist Metal Caps
- 10.2.4. Other Cl
- 10.3. Market Analysis, Insights and Forecast - by End-User Industry
- 10.3.1. Food
- 10.3.2. Beverages
- 10.3.2.1. Alcoholic
- 10.3.2.2. Non-Alcoholic
- 10.3.3. Pharmaceuticals
- 10.3.4. Personal Care
- 10.3.5. Other End-User Industries
- 10.1. Market Analysis, Insights and Forecast - by Material Type
- 11. Middle East and Africa Metal Caps and Closures Industry Analysis, Insights and Forecast, 2019-2031
- 11.1. Market Analysis, Insights and Forecast - by Material Type
- 11.1.1. Aluminium
- 11.1.2. Steel
- 11.1.3. Tin
- 11.2. Market Analysis, Insights and Forecast - by Closures Type
- 11.2.1. Crown Caps
- 11.2.2. Screw Caps
- 11.2.3. Twist Metal Caps
- 11.2.4. Other Cl
- 11.3. Market Analysis, Insights and Forecast - by End-User Industry
- 11.3.1. Food
- 11.3.2. Beverages
- 11.3.2.1. Alcoholic
- 11.3.2.2. Non-Alcoholic
- 11.3.3. Pharmaceuticals
- 11.3.4. Personal Care
- 11.3.5. Other End-User Industries
- 11.1. Market Analysis, Insights and Forecast - by Material Type
- 12. North America Metal Caps and Closures Industry Analysis, Insights and Forecast, 2019-2031
- 12.1. Market Analysis, Insights and Forecast - By Country/Sub-region
- 12.1.1.
- 13. Europe Metal Caps and Closures Industry Analysis, Insights and Forecast, 2019-2031
- 13.1. Market Analysis, Insights and Forecast - By Country/Sub-region
- 13.1.1.
- 14. Asia Metal Caps and Closures Industry Analysis, Insights and Forecast, 2019-2031
- 14.1. Market Analysis, Insights and Forecast - By Country/Sub-region
- 14.1.1.
- 15. Australia and New Zealand Metal Caps and Closures Industry Analysis, Insights and Forecast, 2019-2031
- 15.1. Market Analysis, Insights and Forecast - By Country/Sub-region
- 15.1.1.
- 16. Latin America Metal Caps and Closures Industry Analysis, Insights and Forecast, 2019-2031
- 16.1. Market Analysis, Insights and Forecast - By Country/Sub-region
- 16.1.1.
- 17. Middle East and Africa Metal Caps and Closures Industry Analysis, Insights and Forecast, 2019-2031
- 17.1. Market Analysis, Insights and Forecast - By Country/Sub-region
- 17.1.1.
- 18. Competitive Analysis
- 18.1. Global Market Share Analysis 2024
- 18.2. Company Profiles
- 18.2.1 Closure Systems International Inc (CSI)*List Not Exhaustive
- 18.2.1.1. Overview
- 18.2.1.2. Products
- 18.2.1.3. SWOT Analysis
- 18.2.1.4. Recent Developments
- 18.2.1.5. Financials (Based on Availability)
- 18.2.2 Qorpak (Berlin Packaging)
- 18.2.2.1. Overview
- 18.2.2.2. Products
- 18.2.2.3. SWOT Analysis
- 18.2.2.4. Recent Developments
- 18.2.2.5. Financials (Based on Availability)
- 18.2.3 Guala Closures S P A
- 18.2.3.1. Overview
- 18.2.3.2. Products
- 18.2.3.3. SWOT Analysis
- 18.2.3.4. Recent Developments
- 18.2.3.5. Financials (Based on Availability)
- 18.2.4 Crown Holdings Inc
- 18.2.4.1. Overview
- 18.2.4.2. Products
- 18.2.4.3. SWOT Analysis
- 18.2.4.4. Recent Developments
- 18.2.4.5. Financials (Based on Availability)
- 18.2.5 Nippon Closures Co Ltd
- 18.2.5.1. Overview
- 18.2.5.2. Products
- 18.2.5.3. SWOT Analysis
- 18.2.5.4. Recent Developments
- 18.2.5.5. Financials (Based on Availability)
- 18.2.6 Amcor PLC
- 18.2.6.1. Overview
- 18.2.6.2. Products
- 18.2.6.3. SWOT Analysis
- 18.2.6.4. Recent Developments
- 18.2.6.5. Financials (Based on Availability)
- 18.2.7 Pelliconi & C SpA
- 18.2.7.1. Overview
- 18.2.7.2. Products
- 18.2.7.3. SWOT Analysis
- 18.2.7.4. Recent Developments
- 18.2.7.5. Financials (Based on Availability)
- 18.2.8 Sks Bottle & Packaging Inc
- 18.2.8.1. Overview
- 18.2.8.2. Products
- 18.2.8.3. SWOT Analysis
- 18.2.8.4. Recent Developments
- 18.2.8.5. Financials (Based on Availability)
- 18.2.9 Alameda Packaging LLC
- 18.2.9.1. Overview
- 18.2.9.2. Products
- 18.2.9.3. SWOT Analysis
- 18.2.9.4. Recent Developments
- 18.2.9.5. Financials (Based on Availability)
- 18.2.10 Silgan White Cap LLC
- 18.2.10.1. Overview
- 18.2.10.2. Products
- 18.2.10.3. SWOT Analysis
- 18.2.10.4. Recent Developments
- 18.2.10.5. Financials (Based on Availability)
- 18.2.11 O Berk Company
- 18.2.11.1. Overview
- 18.2.11.2. Products
- 18.2.11.3. SWOT Analysis
- 18.2.11.4. Recent Developments
- 18.2.11.5. Financials (Based on Availability)
- 18.2.1 Closure Systems International Inc (CSI)*List Not Exhaustive
List of Figures
- Figure 1: Global Metal Caps and Closures Industry Revenue Breakdown (Million, %) by Region 2024 & 2032
- Figure 2: North America Metal Caps and Closures Industry Revenue (Million), by Country 2024 & 2032
- Figure 3: North America Metal Caps and Closures Industry Revenue Share (%), by Country 2024 & 2032
- Figure 4: Europe Metal Caps and Closures Industry Revenue (Million), by Country 2024 & 2032
- Figure 5: Europe Metal Caps and Closures Industry Revenue Share (%), by Country 2024 & 2032
- Figure 6: Asia Metal Caps and Closures Industry Revenue (Million), by Country 2024 & 2032
- Figure 7: Asia Metal Caps and Closures Industry Revenue Share (%), by Country 2024 & 2032
- Figure 8: Australia and New Zealand Metal Caps and Closures Industry Revenue (Million), by Country 2024 & 2032
- Figure 9: Australia and New Zealand Metal Caps and Closures Industry Revenue Share (%), by Country 2024 & 2032
- Figure 10: Latin America Metal Caps and Closures Industry Revenue (Million), by Country 2024 & 2032
- Figure 11: Latin America Metal Caps and Closures Industry Revenue Share (%), by Country 2024 & 2032
- Figure 12: Middle East and Africa Metal Caps and Closures Industry Revenue (Million), by Country 2024 & 2032
- Figure 13: Middle East and Africa Metal Caps and Closures Industry Revenue Share (%), by Country 2024 & 2032
- Figure 14: North America Metal Caps and Closures Industry Revenue (Million), by Material Type 2024 & 2032
- Figure 15: North America Metal Caps and Closures Industry Revenue Share (%), by Material Type 2024 & 2032
- Figure 16: North America Metal Caps and Closures Industry Revenue (Million), by Closures Type 2024 & 2032
- Figure 17: North America Metal Caps and Closures Industry Revenue Share (%), by Closures Type 2024 & 2032
- Figure 18: North America Metal Caps and Closures Industry Revenue (Million), by End-User Industry 2024 & 2032
- Figure 19: North America Metal Caps and Closures Industry Revenue Share (%), by End-User Industry 2024 & 2032
- Figure 20: North America Metal Caps and Closures Industry Revenue (Million), by Country 2024 & 2032
- Figure 21: North America Metal Caps and Closures Industry Revenue Share (%), by Country 2024 & 2032
- Figure 22: Europe Metal Caps and Closures Industry Revenue (Million), by Material Type 2024 & 2032
- Figure 23: Europe Metal Caps and Closures Industry Revenue Share (%), by Material Type 2024 & 2032
- Figure 24: Europe Metal Caps and Closures Industry Revenue (Million), by Closures Type 2024 & 2032
- Figure 25: Europe Metal Caps and Closures Industry Revenue Share (%), by Closures Type 2024 & 2032
- Figure 26: Europe Metal Caps and Closures Industry Revenue (Million), by End-User Industry 2024 & 2032
- Figure 27: Europe Metal Caps and Closures Industry Revenue Share (%), by End-User Industry 2024 & 2032
- Figure 28: Europe Metal Caps and Closures Industry Revenue (Million), by Country 2024 & 2032
- Figure 29: Europe Metal Caps and Closures Industry Revenue Share (%), by Country 2024 & 2032
- Figure 30: Asia Metal Caps and Closures Industry Revenue (Million), by Material Type 2024 & 2032
- Figure 31: Asia Metal Caps and Closures Industry Revenue Share (%), by Material Type 2024 & 2032
- Figure 32: Asia Metal Caps and Closures Industry Revenue (Million), by Closures Type 2024 & 2032
- Figure 33: Asia Metal Caps and Closures Industry Revenue Share (%), by Closures Type 2024 & 2032
- Figure 34: Asia Metal Caps and Closures Industry Revenue (Million), by End-User Industry 2024 & 2032
- Figure 35: Asia Metal Caps and Closures Industry Revenue Share (%), by End-User Industry 2024 & 2032
- Figure 36: Asia Metal Caps and Closures Industry Revenue (Million), by Country 2024 & 2032
- Figure 37: Asia Metal Caps and Closures Industry Revenue Share (%), by Country 2024 & 2032
- Figure 38: Australia and New Zealand Metal Caps and Closures Industry Revenue (Million), by Material Type 2024 & 2032
- Figure 39: Australia and New Zealand Metal Caps and Closures Industry Revenue Share (%), by Material Type 2024 & 2032
- Figure 40: Australia and New Zealand Metal Caps and Closures Industry Revenue (Million), by Closures Type 2024 & 2032
- Figure 41: Australia and New Zealand Metal Caps and Closures Industry Revenue Share (%), by Closures Type 2024 & 2032
- Figure 42: Australia and New Zealand Metal Caps and Closures Industry Revenue (Million), by End-User Industry 2024 & 2032
- Figure 43: Australia and New Zealand Metal Caps and Closures Industry Revenue Share (%), by End-User Industry 2024 & 2032
- Figure 44: Australia and New Zealand Metal Caps and Closures Industry Revenue (Million), by Country 2024 & 2032
- Figure 45: Australia and New Zealand Metal Caps and Closures Industry Revenue Share (%), by Country 2024 & 2032
- Figure 46: Latin America Metal Caps and Closures Industry Revenue (Million), by Material Type 2024 & 2032
- Figure 47: Latin America Metal Caps and Closures Industry Revenue Share (%), by Material Type 2024 & 2032
- Figure 48: Latin America Metal Caps and Closures Industry Revenue (Million), by Closures Type 2024 & 2032
- Figure 49: Latin America Metal Caps and Closures Industry Revenue Share (%), by Closures Type 2024 & 2032
- Figure 50: Latin America Metal Caps and Closures Industry Revenue (Million), by End-User Industry 2024 & 2032
- Figure 51: Latin America Metal Caps and Closures Industry Revenue Share (%), by End-User Industry 2024 & 2032
- Figure 52: Latin America Metal Caps and Closures Industry Revenue (Million), by Country 2024 & 2032
- Figure 53: Latin America Metal Caps and Closures Industry Revenue Share (%), by Country 2024 & 2032
- Figure 54: Middle East and Africa Metal Caps and Closures Industry Revenue (Million), by Material Type 2024 & 2032
- Figure 55: Middle East and Africa Metal Caps and Closures Industry Revenue Share (%), by Material Type 2024 & 2032
- Figure 56: Middle East and Africa Metal Caps and Closures Industry Revenue (Million), by Closures Type 2024 & 2032
- Figure 57: Middle East and Africa Metal Caps and Closures Industry Revenue Share (%), by Closures Type 2024 & 2032
- Figure 58: Middle East and Africa Metal Caps and Closures Industry Revenue (Million), by End-User Industry 2024 & 2032
- Figure 59: Middle East and Africa Metal Caps and Closures Industry Revenue Share (%), by End-User Industry 2024 & 2032
- Figure 60: Middle East and Africa Metal Caps and Closures Industry Revenue (Million), by Country 2024 & 2032
- Figure 61: Middle East and Africa Metal Caps and Closures Industry Revenue Share (%), by Country 2024 & 2032
List of Tables
- Table 1: Global Metal Caps and Closures Industry Revenue Million Forecast, by Region 2019 & 2032
- Table 2: Global Metal Caps and Closures Industry Revenue Million Forecast, by Material Type 2019 & 2032
- Table 3: Global Metal Caps and Closures Industry Revenue Million Forecast, by Closures Type 2019 & 2032
- Table 4: Global Metal Caps and Closures Industry Revenue Million Forecast, by End-User Industry 2019 & 2032
- Table 5: Global Metal Caps and Closures Industry Revenue Million Forecast, by Region 2019 & 2032
- Table 6: Global Metal Caps and Closures Industry Revenue Million Forecast, by Country 2019 & 2032
- Table 7: Metal Caps and Closures Industry Revenue (Million) Forecast, by Application 2019 & 2032
- Table 8: Global Metal Caps and Closures Industry Revenue Million Forecast, by Country 2019 & 2032
- Table 9: Metal Caps and Closures Industry Revenue (Million) Forecast, by Application 2019 & 2032
- Table 10: Global Metal Caps and Closures Industry Revenue Million Forecast, by Country 2019 & 2032
- Table 11: Metal Caps and Closures Industry Revenue (Million) Forecast, by Application 2019 & 2032
- Table 12: Global Metal Caps and Closures Industry Revenue Million Forecast, by Country 2019 & 2032
- Table 13: Metal Caps and Closures Industry Revenue (Million) Forecast, by Application 2019 & 2032
- Table 14: Global Metal Caps and Closures Industry Revenue Million Forecast, by Country 2019 & 2032
- Table 15: Metal Caps and Closures Industry Revenue (Million) Forecast, by Application 2019 & 2032
- Table 16: Global Metal Caps and Closures Industry Revenue Million Forecast, by Country 2019 & 2032
- Table 17: Metal Caps and Closures Industry Revenue (Million) Forecast, by Application 2019 & 2032
- Table 18: Global Metal Caps and Closures Industry Revenue Million Forecast, by Material Type 2019 & 2032
- Table 19: Global Metal Caps and Closures Industry Revenue Million Forecast, by Closures Type 2019 & 2032
- Table 20: Global Metal Caps and Closures Industry Revenue Million Forecast, by End-User Industry 2019 & 2032
- Table 21: Global Metal Caps and Closures Industry Revenue Million Forecast, by Country 2019 & 2032
- Table 22: Global Metal Caps and Closures Industry Revenue Million Forecast, by Material Type 2019 & 2032
- Table 23: Global Metal Caps and Closures Industry Revenue Million Forecast, by Closures Type 2019 & 2032
- Table 24: Global Metal Caps and Closures Industry Revenue Million Forecast, by End-User Industry 2019 & 2032
- Table 25: Global Metal Caps and Closures Industry Revenue Million Forecast, by Country 2019 & 2032
- Table 26: Global Metal Caps and Closures Industry Revenue Million Forecast, by Material Type 2019 & 2032
- Table 27: Global Metal Caps and Closures Industry Revenue Million Forecast, by Closures Type 2019 & 2032
- Table 28: Global Metal Caps and Closures Industry Revenue Million Forecast, by End-User Industry 2019 & 2032
- Table 29: Global Metal Caps and Closures Industry Revenue Million Forecast, by Country 2019 & 2032
- Table 30: Global Metal Caps and Closures Industry Revenue Million Forecast, by Material Type 2019 & 2032
- Table 31: Global Metal Caps and Closures Industry Revenue Million Forecast, by Closures Type 2019 & 2032
- Table 32: Global Metal Caps and Closures Industry Revenue Million Forecast, by End-User Industry 2019 & 2032
- Table 33: Global Metal Caps and Closures Industry Revenue Million Forecast, by Country 2019 & 2032
- Table 34: Global Metal Caps and Closures Industry Revenue Million Forecast, by Material Type 2019 & 2032
- Table 35: Global Metal Caps and Closures Industry Revenue Million Forecast, by Closures Type 2019 & 2032
- Table 36: Global Metal Caps and Closures Industry Revenue Million Forecast, by End-User Industry 2019 & 2032
- Table 37: Global Metal Caps and Closures Industry Revenue Million Forecast, by Country 2019 & 2032
- Table 38: Global Metal Caps and Closures Industry Revenue Million Forecast, by Material Type 2019 & 2032
- Table 39: Global Metal Caps and Closures Industry Revenue Million Forecast, by Closures Type 2019 & 2032
- Table 40: Global Metal Caps and Closures Industry Revenue Million Forecast, by End-User Industry 2019 & 2032
- Table 41: Global Metal Caps and Closures Industry Revenue Million Forecast, by Country 2019 & 2032
Frequently Asked Questions
1. What is the projected Compound Annual Growth Rate (CAGR) of the Metal Caps and Closures Industry?
The projected CAGR is approximately 3.38%.
2. Which companies are prominent players in the Metal Caps and Closures Industry?
Key companies in the market include Closure Systems International Inc (CSI)*List Not Exhaustive, Qorpak (Berlin Packaging), Guala Closures S P A, Crown Holdings Inc, Nippon Closures Co Ltd, Amcor PLC, Pelliconi & C SpA, Sks Bottle & Packaging Inc, Alameda Packaging LLC, Silgan White Cap LLC, O Berk Company.
3. What are the main segments of the Metal Caps and Closures Industry?
The market segments include Material Type, Closures Type, End-User Industry.
4. Can you provide details about the market size?
The market size is estimated to be USD 24.57 Million as of 2022.
5. What are some drivers contributing to market growth?
Increasing Consumption of Beverages with a Rising Need for Sustainable Packaging Materials; Superior Properties Compared to Other Closure Materials.
6. What are the notable trends driving market growth?
Pharmaceutical Application Offers Potential Growth.
7. Are there any restraints impacting market growth?
High Adoption Rate of Other Types of Closure Materials.
8. Can you provide examples of recent developments in the market?
January 2023: Guala Closures Group, a prominent manufacturer of aluminum and specialty closures, received validation from the Science Based Targets Initiative (SBTi) for its 2030 Greenhouse Gas (GHG) emission targets. The targets have been recognized as meeting the ambitious 1.5°C goal, which is a significant milestone in the group's sustainability journey. The company has pledged to reduce absolute scope 1 and 2 GHG emissions by 44% by 2030, based on a 2020 starting point, by adopting science-based targets.
9. What pricing options are available for accessing the report?
Pricing options include single-user, multi-user, and enterprise licenses priced at USD 4750, USD 5250, and USD 8750 respectively.
10. Is the market size provided in terms of value or volume?
The market size is provided in terms of value, measured in Million.
11. Are there any specific market keywords associated with the report?
Yes, the market keyword associated with the report is "Metal Caps and Closures Industry," which aids in identifying and referencing the specific market segment covered.
12. How do I determine which pricing option suits my needs best?
The pricing options vary based on user requirements and access needs. Individual users may opt for single-user licenses, while businesses requiring broader access may choose multi-user or enterprise licenses for cost-effective access to the report.
13. Are there any additional resources or data provided in the Metal Caps and Closures Industry report?
While the report offers comprehensive insights, it's advisable to review the specific contents or supplementary materials provided to ascertain if additional resources or data are available.
14. How can I stay updated on further developments or reports in the Metal Caps and Closures Industry?
To stay informed about further developments, trends, and reports in the Metal Caps and Closures Industry, consider subscribing to industry newsletters, following relevant companies and organizations, or regularly checking reputable industry news sources and publications.
Methodology
Step 1 - Identification of Relevant Samples Size from Population Database


Step 2 - Approaches for Defining Global Market Size (Value, Volume* & Price*)

Note*: In applicable scenarios
Step 3 - Data Sources
Primary Research
- Web Analytics
- Survey Reports
- Research Institute
- Latest Research Reports
- Opinion Leaders
Secondary Research
- Annual Reports
- White Paper
- Latest Press Release
- Industry Association
- Paid Database
- Investor Presentations

Step 4 - Data Triangulation
Involves using different sources of information in order to increase the validity of a study
These sources are likely to be stakeholders in a program - participants, other researchers, program staff, other community members, and so on.
Then we put all data in single framework & apply various statistical tools to find out the dynamic on the market.
During the analysis stage, feedback from the stakeholder groups would be compared to determine areas of agreement as well as areas of divergence
