

Key Insights
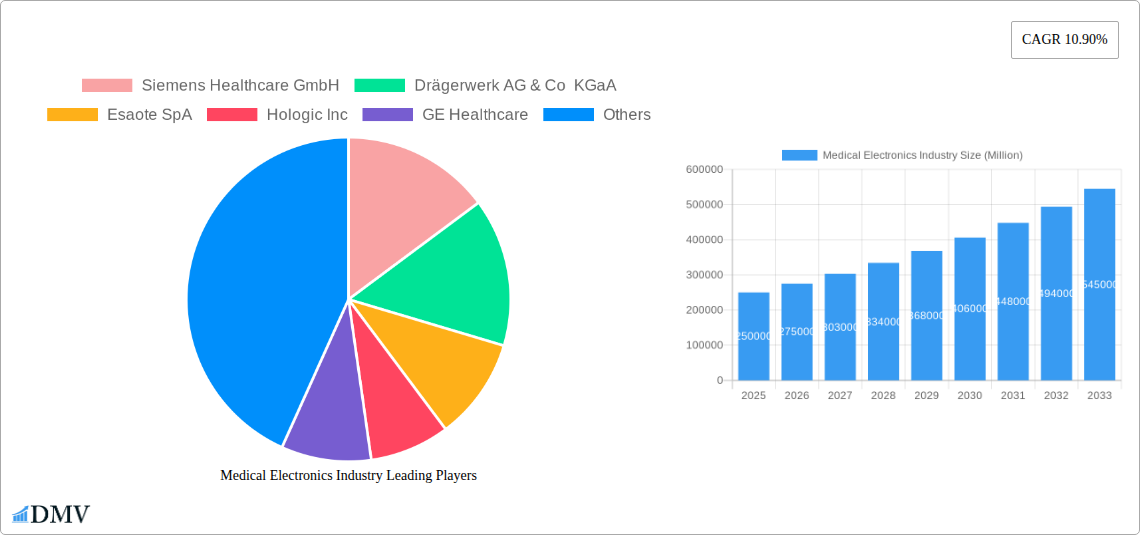
The global medical electronics market is experiencing robust growth, projected to reach a substantial value by 2033. A compound annual growth rate (CAGR) of 10.90% from 2019-2033 signifies significant expansion driven by several key factors. Technological advancements in minimally invasive procedures, the increasing prevalence of chronic diseases necessitating continuous monitoring, and the rising demand for sophisticated diagnostic tools are primary contributors. Furthermore, the aging global population and improved healthcare infrastructure in developing nations are fueling market expansion. Growth is particularly pronounced in segments like non-invasive products, reflecting a preference for less-invasive treatment options. Hospitals and clinics represent the largest end-user segment, underpinned by their crucial role in diagnosis and treatment. However, the market faces certain challenges. High initial investment costs associated with advanced medical electronics and stringent regulatory approvals can act as restraints. Furthermore, the market is characterized by intense competition among established players like Siemens Healthcare GmbH, GE Healthcare, and Medtronic PLC, alongside emerging players vying for market share. This competitive landscape necessitates continuous innovation and strategic partnerships to maintain a strong market position.
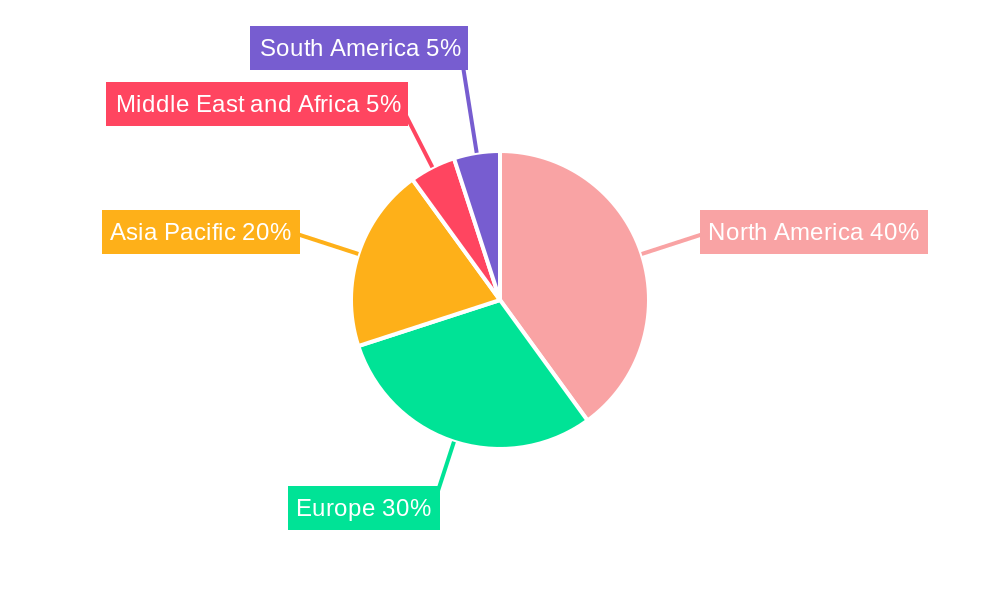
The geographical distribution of market share reveals a concentration in developed regions such as North America and Europe, primarily due to higher healthcare spending and advanced healthcare infrastructure. However, the Asia-Pacific region is expected to witness significant growth in the coming years due to burgeoning economies and rising healthcare awareness. The market is segmented by application (diagnostics, monitoring, therapeutics) and product type (invasive and non-invasive). The diagnostics segment, driven by the increasing need for early and accurate disease detection, commands a considerable market share. The therapeutic segment is witnessing rapid growth due to technological advancements enabling less invasive procedures. This intricate interplay of drivers, restraints, and regional variations paints a dynamic picture of the global medical electronics market, showcasing both immense opportunities and challenges for stakeholders in the coming years. Strategic investments in R&D, focusing on innovative technologies and efficient distribution networks, are crucial for success in this competitive landscape.
Medical Electronics Industry Market Report: 2019-2033
This comprehensive report provides a detailed analysis of the Medical Electronics Industry, offering invaluable insights for stakeholders seeking to navigate this dynamic market. With a study period spanning 2019-2033, a base year of 2025, and an estimated year of 2025, this report forecasts market trends through 2033, building upon historical data from 2019-2024. The global market size is projected to reach xx Million by 2033.
Medical Electronics Industry Market Composition & Trends
This section evaluates the competitive landscape, innovation drivers, regulatory factors, substitute products, end-user analysis, and mergers & acquisitions (M&A) within the medical electronics market. The market is characterized by a moderately concentrated structure, with key players holding significant market share. For example, Siemens Healthcare GmbH and GE Healthcare are estimated to hold xx% and xx% respectively, while other players like Medtronic PLC and Philips hold significant but smaller shares. This concentration is influenced by substantial R&D investments, technological advancements and established brand recognition.
- Market Share Distribution (2025 Estimate): Siemens Healthcare GmbH (xx%), GE Healthcare (xx%), Medtronic PLC (xx%), Philips (xx%), Others (xx%).
- Innovation Catalysts: Artificial intelligence (AI), Internet of Medical Things (IoMT), and miniaturization are driving significant innovation.
- Regulatory Landscape: Stringent regulatory approvals (e.g., FDA, CE marking) significantly impact market entry and product lifecycle.
- Substitute Products: The existence of substitute products, particularly in certain diagnostic segments, introduces competitive pressures.
- End-User Profiles: Hospitals and clinics constitute the largest end-user segment, followed by ambulatory surgical centers and other end users.
- M&A Activities: The industry witnesses frequent M&A activities, with deal values exceeding xx Million annually, driven by the need to expand market reach and acquire technological expertise. Examples include recent acquisitions of smaller, specialized medical device companies by larger multinational corporations.
Medical Electronics Industry Industry Evolution
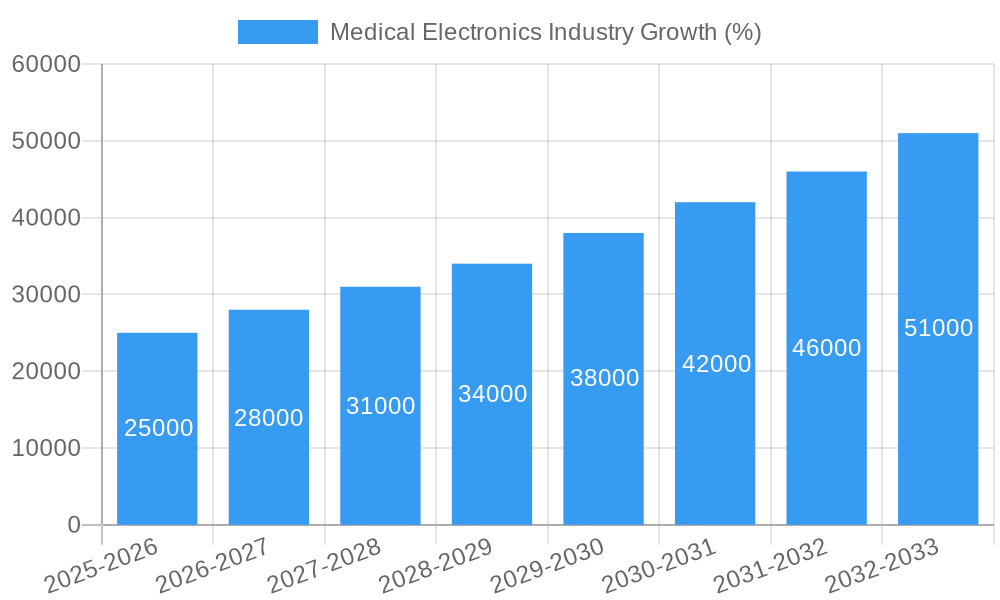
The Medical Electronics Industry has experienced significant growth over the past five years, driven primarily by technological advancements and increasing demand for advanced medical devices. The market witnessed a Compound Annual Growth Rate (CAGR) of xx% during the historical period (2019-2024) and is projected to continue growing at a CAGR of xx% during the forecast period (2025-2033). This growth is fueled by several key factors, including rising prevalence of chronic diseases, an aging global population, technological advancements such as AI and machine learning in diagnostics and therapeutics, and increased healthcare spending globally. The adoption of minimally invasive procedures and telemedicine solutions is further accelerating market growth. For instance, the adoption rate of AI-powered diagnostic tools increased by xx% from 2020 to 2024. The market's evolution also reflects a shift in consumer demand towards improved device accuracy, portability, and ease of use. This increasing demand fuels the development of more sophisticated and user-friendly devices and is further pushing the industry to adopt more advanced manufacturing techniques. The rising adoption of cloud-based data storage and analysis solutions within healthcare systems also supports this market expansion.
Leading Regions, Countries, or Segments in Medical Electronics Industry
North America currently holds the largest market share in the Medical Electronics industry, followed by Europe and Asia Pacific. This dominance is primarily attributed to factors such as robust healthcare infrastructure, high healthcare expenditure, advanced technological adoption, and a strong presence of major market players.
- Key Drivers in North America: High healthcare expenditure, strong regulatory support for innovation, and advanced technological capabilities.
- Key Drivers in Europe: Growing aging population, increasing prevalence of chronic diseases, and investments in healthcare infrastructure.
- Key Drivers in Asia Pacific: Rising disposable income, increasing healthcare awareness, and government initiatives to improve healthcare infrastructure.
Dominant Segments:
- Application: Diagnostics holds the largest market share due to the growing demand for advanced diagnostic tools.
- End-User: Hospitals and clinics remain the largest end-user segment, with a substantial market share owing to their significant needs for sophisticated medical equipment.
- Product: Non-invasive products constitute a major portion of the market, driven by their ease of use and lower risk profile.
Medical Electronics Industry Product Innovations
Recent innovations focus on miniaturization, wireless connectivity, AI integration, and improved imaging capabilities. For example, the development of smaller, more portable diagnostic devices, combined with cloud connectivity for remote monitoring, significantly enhances patient care. Integration of AI algorithms improves diagnostic accuracy and efficiency. Furthermore, advancements in imaging technology have led to higher-resolution images and improved diagnostic capabilities. The overall trend is towards increasing sophistication, enabling personalized and more effective healthcare.
Propelling Factors for Medical Electronics Industry Growth
Several factors are driving the growth of the medical electronics market. Technological advancements in areas like AI and IoT are enabling the creation of more sophisticated and efficient medical devices. Economic factors like rising healthcare expenditure and increased disposable incomes in developing countries contribute significantly. Favorable regulatory environments in several regions, including the US and EU, encouraging innovation and market entry are vital. Specific examples include government funding for medical technology research and initiatives promoting the adoption of telehealth technologies.
Obstacles in the Medical Electronics Industry Market
Stringent regulatory approvals are a significant barrier to market entry, leading to long lead times and increased costs. Supply chain disruptions, particularly in the wake of global events, can severely impact manufacturing and product availability. Intense competition among established players and new entrants creates price pressures and reduces profit margins. Quantifiable impact is estimated at xx Million in lost revenue annually due to these factors combined.
Future Opportunities in Medical Electronics Industry
Emerging markets, particularly in Asia and Africa, present significant growth potential. New technologies like nanotechnology and advanced materials will continue to revolutionize the medical electronics landscape. Growing consumer demand for personalized and connected healthcare solutions creates substantial opportunities for innovative product development.
Major Players in the Medical Electronics Industry Ecosystem
- Siemens Healthcare GmbH
- Drägerwerk AG & Co KGaA
- Esaote SpA
- Hologic Inc
- GE Healthcare
- Getinge Inc
- Medtronic PLC
- Fujifilm Corporation
- Mindray Medical International Limited
- Koninklijke Philips NV
- Canon Medical Systems
- McKesson Corporation
- Olympus Corporation
Key Developments in Medical Electronics Industry Industry
- August 2022: VUNO receives clearance for its Hativ Pro ECG device in South Korea.
- February 2022: Shineco, Inc. partners with Weifang Jianyi Medical Devices Co., Ltd. to manufacture and sell imaging devices.
These developments demonstrate the growing adoption of AI in medical diagnostics and the expansion of partnerships to enhance market reach and product offerings.
Strategic Medical Electronics Industry Market Forecast
The Medical Electronics Industry is poised for continued robust growth, driven by technological advancements, increasing healthcare expenditure, and a growing aging population globally. The market is expected to witness significant expansion across various segments, with particular opportunities in AI-powered diagnostics, minimally invasive procedures, and remote patient monitoring. The forecast suggests a promising future for the industry, particularly for companies that can adapt to evolving technological trends and meet the growing demands for personalized and effective healthcare solutions.
Medical Electronics Industry Segmentation
-
1. Product
-
1.1. Non-invasive Products
- 1.1.1. MRI
- 1.1.2. X-Ray
- 1.1.3. CT Scan
- 1.1.4. Ultrasound
- 1.1.5. Nuclear Imaging Systems
- 1.1.6. Cardiac Monitors
- 1.1.7. Respiratory Monitors
- 1.1.8. Hemodynamic Monitors
- 1.1.9. Multipara Monitors
- 1.1.10. Digital Thermometers
- 1.1.11. Other Products
-
1.2. Invasive Products
- 1.2.1. Endoscopes
- 1.2.2. Pacemakers
- 1.2.3. Implantable Cardioverter Defibrillator (ICD)
- 1.2.4. Implantable Loop Recorders
- 1.2.5. Spinal Cord Stimulator
- 1.2.6. Other Invasive Products
-
1.1. Non-invasive Products
-
2. Application
- 2.1. Diagnostics
- 2.2. Monitoring
- 2.3. Therapeutics
-
3. End User
- 3.1. Hospitals and Clinics
- 3.2. Ambulatory Surgical Centers
- 3.3. Other End Users
Medical Electronics Industry Segmentation By Geography
-
1. North America
- 1.1. United States
- 1.2. Canada
- 1.3. Mexico
-
2. Europe
- 2.1. Germany
- 2.2. United Kingdom
- 2.3. France
- 2.4. Italy
- 2.5. Spain
- 2.6. Rest of Europe
-
3. Asia Pacific
- 3.1. China
- 3.2. Japan
- 3.3. India
- 3.4. Australia
- 3.5. South Korea
- 3.6. Rest of Asia Pacific
-
4. Middle East and Africa
- 4.1. GCC
- 4.2. South Africa
- 4.3. Rest of Middle East and Africa
-
5. South America
- 5.1. Brazil
- 5.2. Argentina
- 5.3. Rest of South America
Medical Electronics Industry REPORT HIGHLIGHTS
| Aspects | Details |
|---|---|
| Study Period | 2019-2033 |
| Base Year | 2024 |
| Estimated Year | 2025 |
| Forecast Period | 2025-2033 |
| Historical Period | 2019-2024 |
| Growth Rate | CAGR of 10.90% from 2019-2033 |
| Segmentation |
|
Table of Contents
- 1. Introduction
- 1.1. Research Scope
- 1.2. Market Segmentation
- 1.3. Research Methodology
- 1.4. Definitions and Assumptions
- 2. Executive Summary
- 2.1. Introduction
- 3. Market Dynamics
- 3.1. Introduction
- 3.2. Market Drivers
- 3.2.1. Increasing Geriatric Population; Rising Application of Imaging Devices
- 3.3. Market Restrains
- 3.3.1. Ramped up regulatory scrutiny; High Cost and Maintenance
- 3.4. Market Trends
- 3.4.1. MRI Segment Expected to Hold Significant Market Share in the Medical Electronics Market Over the Forecast Period
- 4. Market Factor Analysis
- 4.1. Porters Five Forces
- 4.2. Supply/Value Chain
- 4.3. PESTEL analysis
- 4.4. Market Entropy
- 4.5. Patent/Trademark Analysis
- 5. Global Medical Electronics Industry Analysis, Insights and Forecast, 2019-2031
- 5.1. Market Analysis, Insights and Forecast - by Product
- 5.1.1. Non-invasive Products
- 5.1.1.1. MRI
- 5.1.1.2. X-Ray
- 5.1.1.3. CT Scan
- 5.1.1.4. Ultrasound
- 5.1.1.5. Nuclear Imaging Systems
- 5.1.1.6. Cardiac Monitors
- 5.1.1.7. Respiratory Monitors
- 5.1.1.8. Hemodynamic Monitors
- 5.1.1.9. Multipara Monitors
- 5.1.1.10. Digital Thermometers
- 5.1.1.11. Other Products
- 5.1.2. Invasive Products
- 5.1.2.1. Endoscopes
- 5.1.2.2. Pacemakers
- 5.1.2.3. Implantable Cardioverter Defibrillator (ICD)
- 5.1.2.4. Implantable Loop Recorders
- 5.1.2.5. Spinal Cord Stimulator
- 5.1.2.6. Other Invasive Products
- 5.1.1. Non-invasive Products
- 5.2. Market Analysis, Insights and Forecast - by Application
- 5.2.1. Diagnostics
- 5.2.2. Monitoring
- 5.2.3. Therapeutics
- 5.3. Market Analysis, Insights and Forecast - by End User
- 5.3.1. Hospitals and Clinics
- 5.3.2. Ambulatory Surgical Centers
- 5.3.3. Other End Users
- 5.4. Market Analysis, Insights and Forecast - by Region
- 5.4.1. North America
- 5.4.2. Europe
- 5.4.3. Asia Pacific
- 5.4.4. Middle East and Africa
- 5.4.5. South America
- 5.1. Market Analysis, Insights and Forecast - by Product
- 6. North America Medical Electronics Industry Analysis, Insights and Forecast, 2019-2031
- 6.1. Market Analysis, Insights and Forecast - by Product
- 6.1.1. Non-invasive Products
- 6.1.1.1. MRI
- 6.1.1.2. X-Ray
- 6.1.1.3. CT Scan
- 6.1.1.4. Ultrasound
- 6.1.1.5. Nuclear Imaging Systems
- 6.1.1.6. Cardiac Monitors
- 6.1.1.7. Respiratory Monitors
- 6.1.1.8. Hemodynamic Monitors
- 6.1.1.9. Multipara Monitors
- 6.1.1.10. Digital Thermometers
- 6.1.1.11. Other Products
- 6.1.2. Invasive Products
- 6.1.2.1. Endoscopes
- 6.1.2.2. Pacemakers
- 6.1.2.3. Implantable Cardioverter Defibrillator (ICD)
- 6.1.2.4. Implantable Loop Recorders
- 6.1.2.5. Spinal Cord Stimulator
- 6.1.2.6. Other Invasive Products
- 6.1.1. Non-invasive Products
- 6.2. Market Analysis, Insights and Forecast - by Application
- 6.2.1. Diagnostics
- 6.2.2. Monitoring
- 6.2.3. Therapeutics
- 6.3. Market Analysis, Insights and Forecast - by End User
- 6.3.1. Hospitals and Clinics
- 6.3.2. Ambulatory Surgical Centers
- 6.3.3. Other End Users
- 6.1. Market Analysis, Insights and Forecast - by Product
- 7. Europe Medical Electronics Industry Analysis, Insights and Forecast, 2019-2031
- 7.1. Market Analysis, Insights and Forecast - by Product
- 7.1.1. Non-invasive Products
- 7.1.1.1. MRI
- 7.1.1.2. X-Ray
- 7.1.1.3. CT Scan
- 7.1.1.4. Ultrasound
- 7.1.1.5. Nuclear Imaging Systems
- 7.1.1.6. Cardiac Monitors
- 7.1.1.7. Respiratory Monitors
- 7.1.1.8. Hemodynamic Monitors
- 7.1.1.9. Multipara Monitors
- 7.1.1.10. Digital Thermometers
- 7.1.1.11. Other Products
- 7.1.2. Invasive Products
- 7.1.2.1. Endoscopes
- 7.1.2.2. Pacemakers
- 7.1.2.3. Implantable Cardioverter Defibrillator (ICD)
- 7.1.2.4. Implantable Loop Recorders
- 7.1.2.5. Spinal Cord Stimulator
- 7.1.2.6. Other Invasive Products
- 7.1.1. Non-invasive Products
- 7.2. Market Analysis, Insights and Forecast - by Application
- 7.2.1. Diagnostics
- 7.2.2. Monitoring
- 7.2.3. Therapeutics
- 7.3. Market Analysis, Insights and Forecast - by End User
- 7.3.1. Hospitals and Clinics
- 7.3.2. Ambulatory Surgical Centers
- 7.3.3. Other End Users
- 7.1. Market Analysis, Insights and Forecast - by Product
- 8. Asia Pacific Medical Electronics Industry Analysis, Insights and Forecast, 2019-2031
- 8.1. Market Analysis, Insights and Forecast - by Product
- 8.1.1. Non-invasive Products
- 8.1.1.1. MRI
- 8.1.1.2. X-Ray
- 8.1.1.3. CT Scan
- 8.1.1.4. Ultrasound
- 8.1.1.5. Nuclear Imaging Systems
- 8.1.1.6. Cardiac Monitors
- 8.1.1.7. Respiratory Monitors
- 8.1.1.8. Hemodynamic Monitors
- 8.1.1.9. Multipara Monitors
- 8.1.1.10. Digital Thermometers
- 8.1.1.11. Other Products
- 8.1.2. Invasive Products
- 8.1.2.1. Endoscopes
- 8.1.2.2. Pacemakers
- 8.1.2.3. Implantable Cardioverter Defibrillator (ICD)
- 8.1.2.4. Implantable Loop Recorders
- 8.1.2.5. Spinal Cord Stimulator
- 8.1.2.6. Other Invasive Products
- 8.1.1. Non-invasive Products
- 8.2. Market Analysis, Insights and Forecast - by Application
- 8.2.1. Diagnostics
- 8.2.2. Monitoring
- 8.2.3. Therapeutics
- 8.3. Market Analysis, Insights and Forecast - by End User
- 8.3.1. Hospitals and Clinics
- 8.3.2. Ambulatory Surgical Centers
- 8.3.3. Other End Users
- 8.1. Market Analysis, Insights and Forecast - by Product
- 9. Middle East and Africa Medical Electronics Industry Analysis, Insights and Forecast, 2019-2031
- 9.1. Market Analysis, Insights and Forecast - by Product
- 9.1.1. Non-invasive Products
- 9.1.1.1. MRI
- 9.1.1.2. X-Ray
- 9.1.1.3. CT Scan
- 9.1.1.4. Ultrasound
- 9.1.1.5. Nuclear Imaging Systems
- 9.1.1.6. Cardiac Monitors
- 9.1.1.7. Respiratory Monitors
- 9.1.1.8. Hemodynamic Monitors
- 9.1.1.9. Multipara Monitors
- 9.1.1.10. Digital Thermometers
- 9.1.1.11. Other Products
- 9.1.2. Invasive Products
- 9.1.2.1. Endoscopes
- 9.1.2.2. Pacemakers
- 9.1.2.3. Implantable Cardioverter Defibrillator (ICD)
- 9.1.2.4. Implantable Loop Recorders
- 9.1.2.5. Spinal Cord Stimulator
- 9.1.2.6. Other Invasive Products
- 9.1.1. Non-invasive Products
- 9.2. Market Analysis, Insights and Forecast - by Application
- 9.2.1. Diagnostics
- 9.2.2. Monitoring
- 9.2.3. Therapeutics
- 9.3. Market Analysis, Insights and Forecast - by End User
- 9.3.1. Hospitals and Clinics
- 9.3.2. Ambulatory Surgical Centers
- 9.3.3. Other End Users
- 9.1. Market Analysis, Insights and Forecast - by Product
- 10. South America Medical Electronics Industry Analysis, Insights and Forecast, 2019-2031
- 10.1. Market Analysis, Insights and Forecast - by Product
- 10.1.1. Non-invasive Products
- 10.1.1.1. MRI
- 10.1.1.2. X-Ray
- 10.1.1.3. CT Scan
- 10.1.1.4. Ultrasound
- 10.1.1.5. Nuclear Imaging Systems
- 10.1.1.6. Cardiac Monitors
- 10.1.1.7. Respiratory Monitors
- 10.1.1.8. Hemodynamic Monitors
- 10.1.1.9. Multipara Monitors
- 10.1.1.10. Digital Thermometers
- 10.1.1.11. Other Products
- 10.1.2. Invasive Products
- 10.1.2.1. Endoscopes
- 10.1.2.2. Pacemakers
- 10.1.2.3. Implantable Cardioverter Defibrillator (ICD)
- 10.1.2.4. Implantable Loop Recorders
- 10.1.2.5. Spinal Cord Stimulator
- 10.1.2.6. Other Invasive Products
- 10.1.1. Non-invasive Products
- 10.2. Market Analysis, Insights and Forecast - by Application
- 10.2.1. Diagnostics
- 10.2.2. Monitoring
- 10.2.3. Therapeutics
- 10.3. Market Analysis, Insights and Forecast - by End User
- 10.3.1. Hospitals and Clinics
- 10.3.2. Ambulatory Surgical Centers
- 10.3.3. Other End Users
- 10.1. Market Analysis, Insights and Forecast - by Product
- 11. North America Medical Electronics Industry Analysis, Insights and Forecast, 2019-2031
- 11.1. Market Analysis, Insights and Forecast - By Country/Sub-region
- 11.1.1. undefined
- 12. Europe Medical Electronics Industry Analysis, Insights and Forecast, 2019-2031
- 12.1. Market Analysis, Insights and Forecast - By Country/Sub-region
- 12.1.1. undefined
- 13. Asia Pacific Medical Electronics Industry Analysis, Insights and Forecast, 2019-2031
- 13.1. Market Analysis, Insights and Forecast - By Country/Sub-region
- 13.1.1. undefined
- 14. Middle East and Africa Medical Electronics Industry Analysis, Insights and Forecast, 2019-2031
- 14.1. Market Analysis, Insights and Forecast - By Country/Sub-region
- 14.1.1. undefined
- 15. South America Medical Electronics Industry Analysis, Insights and Forecast, 2019-2031
- 15.1. Market Analysis, Insights and Forecast - By Country/Sub-region
- 15.1.1. undefined
- 16. Competitive Analysis
- 16.1. Global Market Share Analysis 2024
- 16.2. Company Profiles
- 16.2.1 Siemens Healthcare GmbH
- 16.2.1.1. Overview
- 16.2.1.2. Products
- 16.2.1.3. SWOT Analysis
- 16.2.1.4. Recent Developments
- 16.2.1.5. Financials (Based on Availability)
- 16.2.2 Drägerwerk AG & Co KGaA
- 16.2.2.1. Overview
- 16.2.2.2. Products
- 16.2.2.3. SWOT Analysis
- 16.2.2.4. Recent Developments
- 16.2.2.5. Financials (Based on Availability)
- 16.2.3 Esaote SpA
- 16.2.3.1. Overview
- 16.2.3.2. Products
- 16.2.3.3. SWOT Analysis
- 16.2.3.4. Recent Developments
- 16.2.3.5. Financials (Based on Availability)
- 16.2.4 Hologic Inc
- 16.2.4.1. Overview
- 16.2.4.2. Products
- 16.2.4.3. SWOT Analysis
- 16.2.4.4. Recent Developments
- 16.2.4.5. Financials (Based on Availability)
- 16.2.5 GE Healthcare
- 16.2.5.1. Overview
- 16.2.5.2. Products
- 16.2.5.3. SWOT Analysis
- 16.2.5.4. Recent Developments
- 16.2.5.5. Financials (Based on Availability)
- 16.2.6 Getinge Inc
- 16.2.6.1. Overview
- 16.2.6.2. Products
- 16.2.6.3. SWOT Analysis
- 16.2.6.4. Recent Developments
- 16.2.6.5. Financials (Based on Availability)
- 16.2.7 Medtronic PLC
- 16.2.7.1. Overview
- 16.2.7.2. Products
- 16.2.7.3. SWOT Analysis
- 16.2.7.4. Recent Developments
- 16.2.7.5. Financials (Based on Availability)
- 16.2.8 Fujifilm Corporation
- 16.2.8.1. Overview
- 16.2.8.2. Products
- 16.2.8.3. SWOT Analysis
- 16.2.8.4. Recent Developments
- 16.2.8.5. Financials (Based on Availability)
- 16.2.9 Mindray Medical International Limited
- 16.2.9.1. Overview
- 16.2.9.2. Products
- 16.2.9.3. SWOT Analysis
- 16.2.9.4. Recent Developments
- 16.2.9.5. Financials (Based on Availability)
- 16.2.10 Koninklijke Philips NV
- 16.2.10.1. Overview
- 16.2.10.2. Products
- 16.2.10.3. SWOT Analysis
- 16.2.10.4. Recent Developments
- 16.2.10.5. Financials (Based on Availability)
- 16.2.11 Canon Medical Systems
- 16.2.11.1. Overview
- 16.2.11.2. Products
- 16.2.11.3. SWOT Analysis
- 16.2.11.4. Recent Developments
- 16.2.11.5. Financials (Based on Availability)
- 16.2.12 McKesson Corporation
- 16.2.12.1. Overview
- 16.2.12.2. Products
- 16.2.12.3. SWOT Analysis
- 16.2.12.4. Recent Developments
- 16.2.12.5. Financials (Based on Availability)
- 16.2.13 Olympus Corporation
- 16.2.13.1. Overview
- 16.2.13.2. Products
- 16.2.13.3. SWOT Analysis
- 16.2.13.4. Recent Developments
- 16.2.13.5. Financials (Based on Availability)
- 16.2.1 Siemens Healthcare GmbH
List of Figures
- Figure 1: Global Medical Electronics Industry Revenue Breakdown (Million, %) by Region 2024 & 2032
- Figure 2: Global Medical Electronics Industry Volume Breakdown (K Unit, %) by Region 2024 & 2032
- Figure 3: North America Medical Electronics Industry Revenue (Million), by Country 2024 & 2032
- Figure 4: North America Medical Electronics Industry Volume (K Unit), by Country 2024 & 2032
- Figure 5: North America Medical Electronics Industry Revenue Share (%), by Country 2024 & 2032
- Figure 6: North America Medical Electronics Industry Volume Share (%), by Country 2024 & 2032
- Figure 7: Europe Medical Electronics Industry Revenue (Million), by Country 2024 & 2032
- Figure 8: Europe Medical Electronics Industry Volume (K Unit), by Country 2024 & 2032
- Figure 9: Europe Medical Electronics Industry Revenue Share (%), by Country 2024 & 2032
- Figure 10: Europe Medical Electronics Industry Volume Share (%), by Country 2024 & 2032
- Figure 11: Asia Pacific Medical Electronics Industry Revenue (Million), by Country 2024 & 2032
- Figure 12: Asia Pacific Medical Electronics Industry Volume (K Unit), by Country 2024 & 2032
- Figure 13: Asia Pacific Medical Electronics Industry Revenue Share (%), by Country 2024 & 2032
- Figure 14: Asia Pacific Medical Electronics Industry Volume Share (%), by Country 2024 & 2032
- Figure 15: Middle East and Africa Medical Electronics Industry Revenue (Million), by Country 2024 & 2032
- Figure 16: Middle East and Africa Medical Electronics Industry Volume (K Unit), by Country 2024 & 2032
- Figure 17: Middle East and Africa Medical Electronics Industry Revenue Share (%), by Country 2024 & 2032
- Figure 18: Middle East and Africa Medical Electronics Industry Volume Share (%), by Country 2024 & 2032
- Figure 19: South America Medical Electronics Industry Revenue (Million), by Country 2024 & 2032
- Figure 20: South America Medical Electronics Industry Volume (K Unit), by Country 2024 & 2032
- Figure 21: South America Medical Electronics Industry Revenue Share (%), by Country 2024 & 2032
- Figure 22: South America Medical Electronics Industry Volume Share (%), by Country 2024 & 2032
- Figure 23: North America Medical Electronics Industry Revenue (Million), by Product 2024 & 2032
- Figure 24: North America Medical Electronics Industry Volume (K Unit), by Product 2024 & 2032
- Figure 25: North America Medical Electronics Industry Revenue Share (%), by Product 2024 & 2032
- Figure 26: North America Medical Electronics Industry Volume Share (%), by Product 2024 & 2032
- Figure 27: North America Medical Electronics Industry Revenue (Million), by Application 2024 & 2032
- Figure 28: North America Medical Electronics Industry Volume (K Unit), by Application 2024 & 2032
- Figure 29: North America Medical Electronics Industry Revenue Share (%), by Application 2024 & 2032
- Figure 30: North America Medical Electronics Industry Volume Share (%), by Application 2024 & 2032
- Figure 31: North America Medical Electronics Industry Revenue (Million), by End User 2024 & 2032
- Figure 32: North America Medical Electronics Industry Volume (K Unit), by End User 2024 & 2032
- Figure 33: North America Medical Electronics Industry Revenue Share (%), by End User 2024 & 2032
- Figure 34: North America Medical Electronics Industry Volume Share (%), by End User 2024 & 2032
- Figure 35: North America Medical Electronics Industry Revenue (Million), by Country 2024 & 2032
- Figure 36: North America Medical Electronics Industry Volume (K Unit), by Country 2024 & 2032
- Figure 37: North America Medical Electronics Industry Revenue Share (%), by Country 2024 & 2032
- Figure 38: North America Medical Electronics Industry Volume Share (%), by Country 2024 & 2032
- Figure 39: Europe Medical Electronics Industry Revenue (Million), by Product 2024 & 2032
- Figure 40: Europe Medical Electronics Industry Volume (K Unit), by Product 2024 & 2032
- Figure 41: Europe Medical Electronics Industry Revenue Share (%), by Product 2024 & 2032
- Figure 42: Europe Medical Electronics Industry Volume Share (%), by Product 2024 & 2032
- Figure 43: Europe Medical Electronics Industry Revenue (Million), by Application 2024 & 2032
- Figure 44: Europe Medical Electronics Industry Volume (K Unit), by Application 2024 & 2032
- Figure 45: Europe Medical Electronics Industry Revenue Share (%), by Application 2024 & 2032
- Figure 46: Europe Medical Electronics Industry Volume Share (%), by Application 2024 & 2032
- Figure 47: Europe Medical Electronics Industry Revenue (Million), by End User 2024 & 2032
- Figure 48: Europe Medical Electronics Industry Volume (K Unit), by End User 2024 & 2032
- Figure 49: Europe Medical Electronics Industry Revenue Share (%), by End User 2024 & 2032
- Figure 50: Europe Medical Electronics Industry Volume Share (%), by End User 2024 & 2032
- Figure 51: Europe Medical Electronics Industry Revenue (Million), by Country 2024 & 2032
- Figure 52: Europe Medical Electronics Industry Volume (K Unit), by Country 2024 & 2032
- Figure 53: Europe Medical Electronics Industry Revenue Share (%), by Country 2024 & 2032
- Figure 54: Europe Medical Electronics Industry Volume Share (%), by Country 2024 & 2032
- Figure 55: Asia Pacific Medical Electronics Industry Revenue (Million), by Product 2024 & 2032
- Figure 56: Asia Pacific Medical Electronics Industry Volume (K Unit), by Product 2024 & 2032
- Figure 57: Asia Pacific Medical Electronics Industry Revenue Share (%), by Product 2024 & 2032
- Figure 58: Asia Pacific Medical Electronics Industry Volume Share (%), by Product 2024 & 2032
- Figure 59: Asia Pacific Medical Electronics Industry Revenue (Million), by Application 2024 & 2032
- Figure 60: Asia Pacific Medical Electronics Industry Volume (K Unit), by Application 2024 & 2032
- Figure 61: Asia Pacific Medical Electronics Industry Revenue Share (%), by Application 2024 & 2032
- Figure 62: Asia Pacific Medical Electronics Industry Volume Share (%), by Application 2024 & 2032
- Figure 63: Asia Pacific Medical Electronics Industry Revenue (Million), by End User 2024 & 2032
- Figure 64: Asia Pacific Medical Electronics Industry Volume (K Unit), by End User 2024 & 2032
- Figure 65: Asia Pacific Medical Electronics Industry Revenue Share (%), by End User 2024 & 2032
- Figure 66: Asia Pacific Medical Electronics Industry Volume Share (%), by End User 2024 & 2032
- Figure 67: Asia Pacific Medical Electronics Industry Revenue (Million), by Country 2024 & 2032
- Figure 68: Asia Pacific Medical Electronics Industry Volume (K Unit), by Country 2024 & 2032
- Figure 69: Asia Pacific Medical Electronics Industry Revenue Share (%), by Country 2024 & 2032
- Figure 70: Asia Pacific Medical Electronics Industry Volume Share (%), by Country 2024 & 2032
- Figure 71: Middle East and Africa Medical Electronics Industry Revenue (Million), by Product 2024 & 2032
- Figure 72: Middle East and Africa Medical Electronics Industry Volume (K Unit), by Product 2024 & 2032
- Figure 73: Middle East and Africa Medical Electronics Industry Revenue Share (%), by Product 2024 & 2032
- Figure 74: Middle East and Africa Medical Electronics Industry Volume Share (%), by Product 2024 & 2032
- Figure 75: Middle East and Africa Medical Electronics Industry Revenue (Million), by Application 2024 & 2032
- Figure 76: Middle East and Africa Medical Electronics Industry Volume (K Unit), by Application 2024 & 2032
- Figure 77: Middle East and Africa Medical Electronics Industry Revenue Share (%), by Application 2024 & 2032
- Figure 78: Middle East and Africa Medical Electronics Industry Volume Share (%), by Application 2024 & 2032
- Figure 79: Middle East and Africa Medical Electronics Industry Revenue (Million), by End User 2024 & 2032
- Figure 80: Middle East and Africa Medical Electronics Industry Volume (K Unit), by End User 2024 & 2032
- Figure 81: Middle East and Africa Medical Electronics Industry Revenue Share (%), by End User 2024 & 2032
- Figure 82: Middle East and Africa Medical Electronics Industry Volume Share (%), by End User 2024 & 2032
- Figure 83: Middle East and Africa Medical Electronics Industry Revenue (Million), by Country 2024 & 2032
- Figure 84: Middle East and Africa Medical Electronics Industry Volume (K Unit), by Country 2024 & 2032
- Figure 85: Middle East and Africa Medical Electronics Industry Revenue Share (%), by Country 2024 & 2032
- Figure 86: Middle East and Africa Medical Electronics Industry Volume Share (%), by Country 2024 & 2032
- Figure 87: South America Medical Electronics Industry Revenue (Million), by Product 2024 & 2032
- Figure 88: South America Medical Electronics Industry Volume (K Unit), by Product 2024 & 2032
- Figure 89: South America Medical Electronics Industry Revenue Share (%), by Product 2024 & 2032
- Figure 90: South America Medical Electronics Industry Volume Share (%), by Product 2024 & 2032
- Figure 91: South America Medical Electronics Industry Revenue (Million), by Application 2024 & 2032
- Figure 92: South America Medical Electronics Industry Volume (K Unit), by Application 2024 & 2032
- Figure 93: South America Medical Electronics Industry Revenue Share (%), by Application 2024 & 2032
- Figure 94: South America Medical Electronics Industry Volume Share (%), by Application 2024 & 2032
- Figure 95: South America Medical Electronics Industry Revenue (Million), by End User 2024 & 2032
- Figure 96: South America Medical Electronics Industry Volume (K Unit), by End User 2024 & 2032
- Figure 97: South America Medical Electronics Industry Revenue Share (%), by End User 2024 & 2032
- Figure 98: South America Medical Electronics Industry Volume Share (%), by End User 2024 & 2032
- Figure 99: South America Medical Electronics Industry Revenue (Million), by Country 2024 & 2032
- Figure 100: South America Medical Electronics Industry Volume (K Unit), by Country 2024 & 2032
- Figure 101: South America Medical Electronics Industry Revenue Share (%), by Country 2024 & 2032
- Figure 102: South America Medical Electronics Industry Volume Share (%), by Country 2024 & 2032
List of Tables
- Table 1: Global Medical Electronics Industry Revenue Million Forecast, by Region 2019 & 2032
- Table 2: Global Medical Electronics Industry Volume K Unit Forecast, by Region 2019 & 2032
- Table 3: Global Medical Electronics Industry Revenue Million Forecast, by Product 2019 & 2032
- Table 4: Global Medical Electronics Industry Volume K Unit Forecast, by Product 2019 & 2032
- Table 5: Global Medical Electronics Industry Revenue Million Forecast, by Application 2019 & 2032
- Table 6: Global Medical Electronics Industry Volume K Unit Forecast, by Application 2019 & 2032
- Table 7: Global Medical Electronics Industry Revenue Million Forecast, by End User 2019 & 2032
- Table 8: Global Medical Electronics Industry Volume K Unit Forecast, by End User 2019 & 2032
- Table 9: Global Medical Electronics Industry Revenue Million Forecast, by Region 2019 & 2032
- Table 10: Global Medical Electronics Industry Volume K Unit Forecast, by Region 2019 & 2032
- Table 11: Global Medical Electronics Industry Revenue Million Forecast, by Country 2019 & 2032
- Table 12: Global Medical Electronics Industry Volume K Unit Forecast, by Country 2019 & 2032
- Table 13: Global Medical Electronics Industry Revenue Million Forecast, by Country 2019 & 2032
- Table 14: Global Medical Electronics Industry Volume K Unit Forecast, by Country 2019 & 2032
- Table 15: Global Medical Electronics Industry Revenue Million Forecast, by Country 2019 & 2032
- Table 16: Global Medical Electronics Industry Volume K Unit Forecast, by Country 2019 & 2032
- Table 17: Global Medical Electronics Industry Revenue Million Forecast, by Country 2019 & 2032
- Table 18: Global Medical Electronics Industry Volume K Unit Forecast, by Country 2019 & 2032
- Table 19: Global Medical Electronics Industry Revenue Million Forecast, by Country 2019 & 2032
- Table 20: Global Medical Electronics Industry Volume K Unit Forecast, by Country 2019 & 2032
- Table 21: Global Medical Electronics Industry Revenue Million Forecast, by Product 2019 & 2032
- Table 22: Global Medical Electronics Industry Volume K Unit Forecast, by Product 2019 & 2032
- Table 23: Global Medical Electronics Industry Revenue Million Forecast, by Application 2019 & 2032
- Table 24: Global Medical Electronics Industry Volume K Unit Forecast, by Application 2019 & 2032
- Table 25: Global Medical Electronics Industry Revenue Million Forecast, by End User 2019 & 2032
- Table 26: Global Medical Electronics Industry Volume K Unit Forecast, by End User 2019 & 2032
- Table 27: Global Medical Electronics Industry Revenue Million Forecast, by Country 2019 & 2032
- Table 28: Global Medical Electronics Industry Volume K Unit Forecast, by Country 2019 & 2032
- Table 29: United States Medical Electronics Industry Revenue (Million) Forecast, by Application 2019 & 2032
- Table 30: United States Medical Electronics Industry Volume (K Unit) Forecast, by Application 2019 & 2032
- Table 31: Canada Medical Electronics Industry Revenue (Million) Forecast, by Application 2019 & 2032
- Table 32: Canada Medical Electronics Industry Volume (K Unit) Forecast, by Application 2019 & 2032
- Table 33: Mexico Medical Electronics Industry Revenue (Million) Forecast, by Application 2019 & 2032
- Table 34: Mexico Medical Electronics Industry Volume (K Unit) Forecast, by Application 2019 & 2032
- Table 35: Global Medical Electronics Industry Revenue Million Forecast, by Product 2019 & 2032
- Table 36: Global Medical Electronics Industry Volume K Unit Forecast, by Product 2019 & 2032
- Table 37: Global Medical Electronics Industry Revenue Million Forecast, by Application 2019 & 2032
- Table 38: Global Medical Electronics Industry Volume K Unit Forecast, by Application 2019 & 2032
- Table 39: Global Medical Electronics Industry Revenue Million Forecast, by End User 2019 & 2032
- Table 40: Global Medical Electronics Industry Volume K Unit Forecast, by End User 2019 & 2032
- Table 41: Global Medical Electronics Industry Revenue Million Forecast, by Country 2019 & 2032
- Table 42: Global Medical Electronics Industry Volume K Unit Forecast, by Country 2019 & 2032
- Table 43: Germany Medical Electronics Industry Revenue (Million) Forecast, by Application 2019 & 2032
- Table 44: Germany Medical Electronics Industry Volume (K Unit) Forecast, by Application 2019 & 2032
- Table 45: United Kingdom Medical Electronics Industry Revenue (Million) Forecast, by Application 2019 & 2032
- Table 46: United Kingdom Medical Electronics Industry Volume (K Unit) Forecast, by Application 2019 & 2032
- Table 47: France Medical Electronics Industry Revenue (Million) Forecast, by Application 2019 & 2032
- Table 48: France Medical Electronics Industry Volume (K Unit) Forecast, by Application 2019 & 2032
- Table 49: Italy Medical Electronics Industry Revenue (Million) Forecast, by Application 2019 & 2032
- Table 50: Italy Medical Electronics Industry Volume (K Unit) Forecast, by Application 2019 & 2032
- Table 51: Spain Medical Electronics Industry Revenue (Million) Forecast, by Application 2019 & 2032
- Table 52: Spain Medical Electronics Industry Volume (K Unit) Forecast, by Application 2019 & 2032
- Table 53: Rest of Europe Medical Electronics Industry Revenue (Million) Forecast, by Application 2019 & 2032
- Table 54: Rest of Europe Medical Electronics Industry Volume (K Unit) Forecast, by Application 2019 & 2032
- Table 55: Global Medical Electronics Industry Revenue Million Forecast, by Product 2019 & 2032
- Table 56: Global Medical Electronics Industry Volume K Unit Forecast, by Product 2019 & 2032
- Table 57: Global Medical Electronics Industry Revenue Million Forecast, by Application 2019 & 2032
- Table 58: Global Medical Electronics Industry Volume K Unit Forecast, by Application 2019 & 2032
- Table 59: Global Medical Electronics Industry Revenue Million Forecast, by End User 2019 & 2032
- Table 60: Global Medical Electronics Industry Volume K Unit Forecast, by End User 2019 & 2032
- Table 61: Global Medical Electronics Industry Revenue Million Forecast, by Country 2019 & 2032
- Table 62: Global Medical Electronics Industry Volume K Unit Forecast, by Country 2019 & 2032
- Table 63: China Medical Electronics Industry Revenue (Million) Forecast, by Application 2019 & 2032
- Table 64: China Medical Electronics Industry Volume (K Unit) Forecast, by Application 2019 & 2032
- Table 65: Japan Medical Electronics Industry Revenue (Million) Forecast, by Application 2019 & 2032
- Table 66: Japan Medical Electronics Industry Volume (K Unit) Forecast, by Application 2019 & 2032
- Table 67: India Medical Electronics Industry Revenue (Million) Forecast, by Application 2019 & 2032
- Table 68: India Medical Electronics Industry Volume (K Unit) Forecast, by Application 2019 & 2032
- Table 69: Australia Medical Electronics Industry Revenue (Million) Forecast, by Application 2019 & 2032
- Table 70: Australia Medical Electronics Industry Volume (K Unit) Forecast, by Application 2019 & 2032
- Table 71: South Korea Medical Electronics Industry Revenue (Million) Forecast, by Application 2019 & 2032
- Table 72: South Korea Medical Electronics Industry Volume (K Unit) Forecast, by Application 2019 & 2032
- Table 73: Rest of Asia Pacific Medical Electronics Industry Revenue (Million) Forecast, by Application 2019 & 2032
- Table 74: Rest of Asia Pacific Medical Electronics Industry Volume (K Unit) Forecast, by Application 2019 & 2032
- Table 75: Global Medical Electronics Industry Revenue Million Forecast, by Product 2019 & 2032
- Table 76: Global Medical Electronics Industry Volume K Unit Forecast, by Product 2019 & 2032
- Table 77: Global Medical Electronics Industry Revenue Million Forecast, by Application 2019 & 2032
- Table 78: Global Medical Electronics Industry Volume K Unit Forecast, by Application 2019 & 2032
- Table 79: Global Medical Electronics Industry Revenue Million Forecast, by End User 2019 & 2032
- Table 80: Global Medical Electronics Industry Volume K Unit Forecast, by End User 2019 & 2032
- Table 81: Global Medical Electronics Industry Revenue Million Forecast, by Country 2019 & 2032
- Table 82: Global Medical Electronics Industry Volume K Unit Forecast, by Country 2019 & 2032
- Table 83: GCC Medical Electronics Industry Revenue (Million) Forecast, by Application 2019 & 2032
- Table 84: GCC Medical Electronics Industry Volume (K Unit) Forecast, by Application 2019 & 2032
- Table 85: South Africa Medical Electronics Industry Revenue (Million) Forecast, by Application 2019 & 2032
- Table 86: South Africa Medical Electronics Industry Volume (K Unit) Forecast, by Application 2019 & 2032
- Table 87: Rest of Middle East and Africa Medical Electronics Industry Revenue (Million) Forecast, by Application 2019 & 2032
- Table 88: Rest of Middle East and Africa Medical Electronics Industry Volume (K Unit) Forecast, by Application 2019 & 2032
- Table 89: Global Medical Electronics Industry Revenue Million Forecast, by Product 2019 & 2032
- Table 90: Global Medical Electronics Industry Volume K Unit Forecast, by Product 2019 & 2032
- Table 91: Global Medical Electronics Industry Revenue Million Forecast, by Application 2019 & 2032
- Table 92: Global Medical Electronics Industry Volume K Unit Forecast, by Application 2019 & 2032
- Table 93: Global Medical Electronics Industry Revenue Million Forecast, by End User 2019 & 2032
- Table 94: Global Medical Electronics Industry Volume K Unit Forecast, by End User 2019 & 2032
- Table 95: Global Medical Electronics Industry Revenue Million Forecast, by Country 2019 & 2032
- Table 96: Global Medical Electronics Industry Volume K Unit Forecast, by Country 2019 & 2032
- Table 97: Brazil Medical Electronics Industry Revenue (Million) Forecast, by Application 2019 & 2032
- Table 98: Brazil Medical Electronics Industry Volume (K Unit) Forecast, by Application 2019 & 2032
- Table 99: Argentina Medical Electronics Industry Revenue (Million) Forecast, by Application 2019 & 2032
- Table 100: Argentina Medical Electronics Industry Volume (K Unit) Forecast, by Application 2019 & 2032
- Table 101: Rest of South America Medical Electronics Industry Revenue (Million) Forecast, by Application 2019 & 2032
- Table 102: Rest of South America Medical Electronics Industry Volume (K Unit) Forecast, by Application 2019 & 2032
Frequently Asked Questions
1. What is the projected Compound Annual Growth Rate (CAGR) of the Medical Electronics Industry?
The projected CAGR is approximately 10.90%.
2. Which companies are prominent players in the Medical Electronics Industry?
Key companies in the market include Siemens Healthcare GmbH, Drägerwerk AG & Co KGaA, Esaote SpA, Hologic Inc, GE Healthcare, Getinge Inc, Medtronic PLC, Fujifilm Corporation, Mindray Medical International Limited, Koninklijke Philips NV, Canon Medical Systems, McKesson Corporation, Olympus Corporation.
3. What are the main segments of the Medical Electronics Industry?
The market segments include Product, Application, End User.
4. Can you provide details about the market size?
The market size is estimated to be USD XX Million as of 2022.
5. What are some drivers contributing to market growth?
Increasing Geriatric Population; Rising Application of Imaging Devices.
6. What are the notable trends driving market growth?
MRI Segment Expected to Hold Significant Market Share in the Medical Electronics Market Over the Forecast Period.
7. Are there any restraints impacting market growth?
Ramped up regulatory scrutiny; High Cost and Maintenance.
8. Can you provide examples of recent developments in the market?
In August 2022, the South Korean Ministry of Food and Drug Safety granted clearance to VUNO, a medical artificial intelligence company, for its ECG device, Hativ Pro, a portable medical device that measures a user's heart rate and sends this data through a connected mobile phone app.
9. What pricing options are available for accessing the report?
Pricing options include single-user, multi-user, and enterprise licenses priced at USD 4750, USD 5250, and USD 8750 respectively.
10. Is the market size provided in terms of value or volume?
The market size is provided in terms of value, measured in Million and volume, measured in K Unit.
11. Are there any specific market keywords associated with the report?
Yes, the market keyword associated with the report is "Medical Electronics Industry," which aids in identifying and referencing the specific market segment covered.
12. How do I determine which pricing option suits my needs best?
The pricing options vary based on user requirements and access needs. Individual users may opt for single-user licenses, while businesses requiring broader access may choose multi-user or enterprise licenses for cost-effective access to the report.
13. Are there any additional resources or data provided in the Medical Electronics Industry report?
While the report offers comprehensive insights, it's advisable to review the specific contents or supplementary materials provided to ascertain if additional resources or data are available.
14. How can I stay updated on further developments or reports in the Medical Electronics Industry?
To stay informed about further developments, trends, and reports in the Medical Electronics Industry, consider subscribing to industry newsletters, following relevant companies and organizations, or regularly checking reputable industry news sources and publications.
Methodology
Step 1 - Identification of Relevant Samples Size from Population Database


Step 2 - Approaches for Defining Global Market Size (Value, Volume* & Price*)

Note*: In applicable scenarios
Step 3 - Data Sources
Primary Research
- Web Analytics
- Survey Reports
- Research Institute
- Latest Research Reports
- Opinion Leaders
Secondary Research
- Annual Reports
- White Paper
- Latest Press Release
- Industry Association
- Paid Database
- Investor Presentations

Step 4 - Data Triangulation
Involves using different sources of information in order to increase the validity of a study
These sources are likely to be stakeholders in a program - participants, other researchers, program staff, other community members, and so on.
Then we put all data in single framework & apply various statistical tools to find out the dynamic on the market.
During the analysis stage, feedback from the stakeholder groups would be compared to determine areas of agreement as well as areas of divergence
