

Key Insights
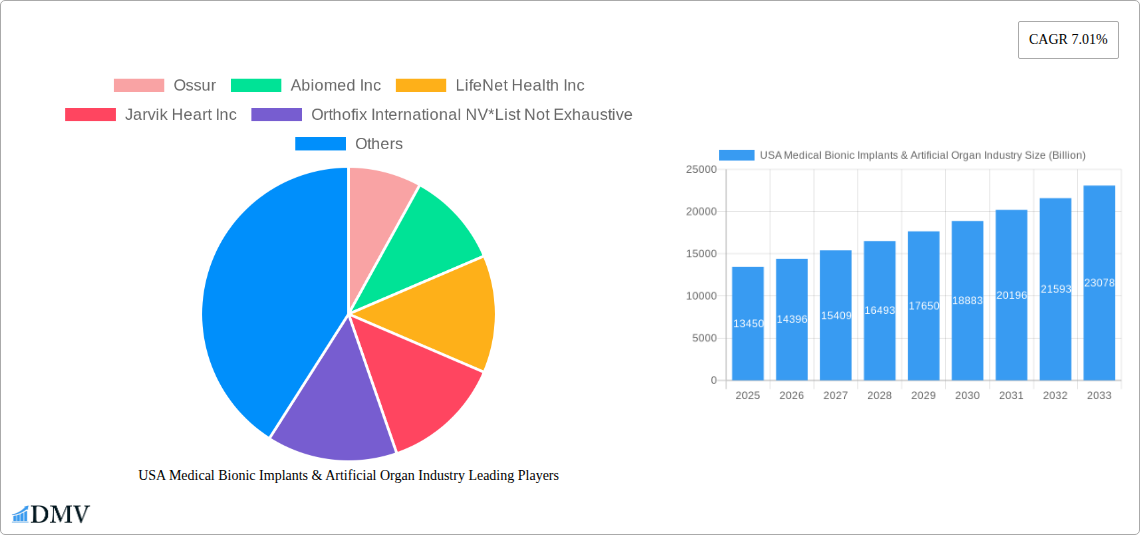
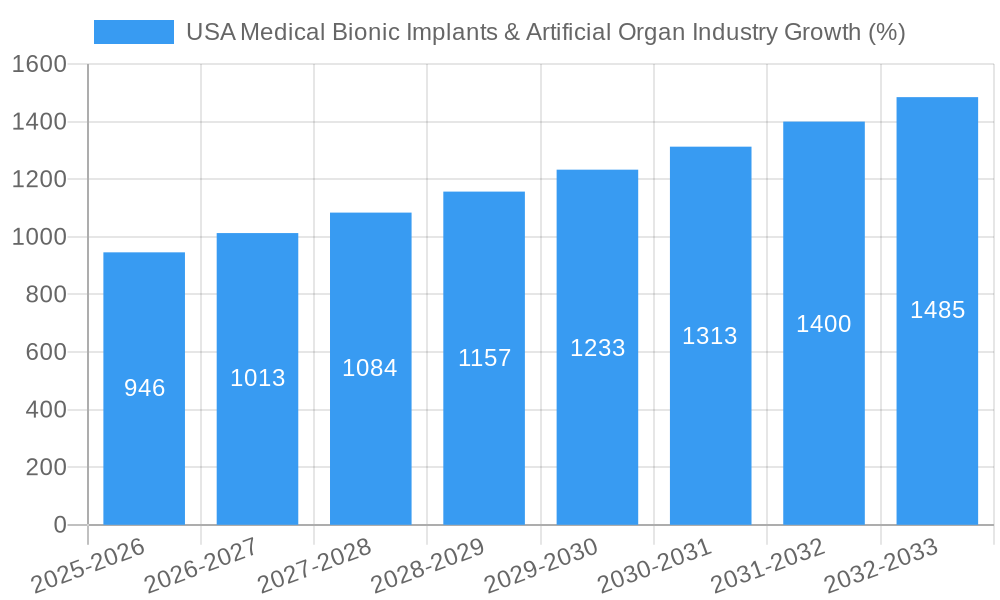
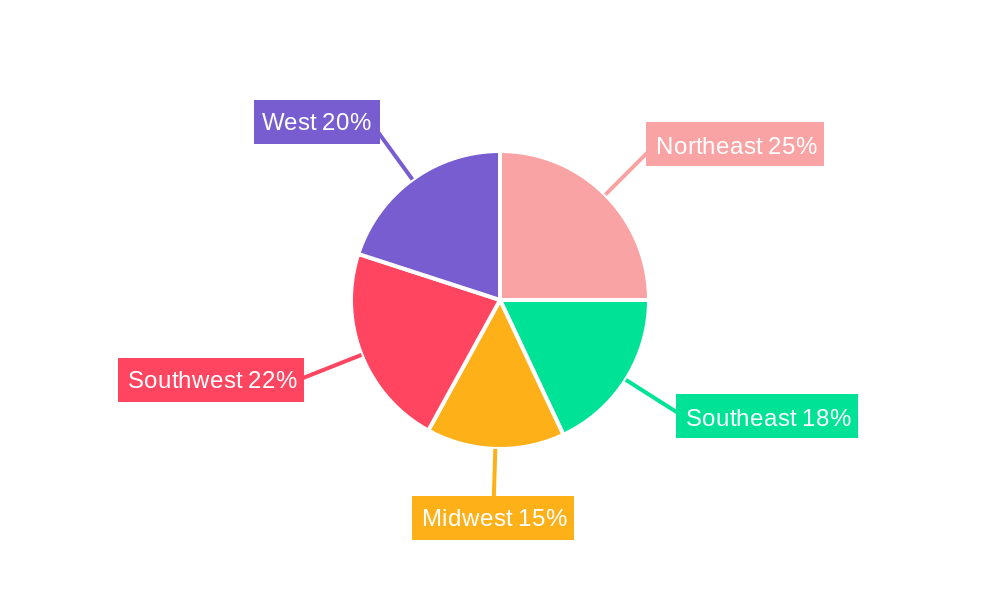
The US medical bionic implants and artificial organ market, valued at $13.45 billion in 2025, is projected to experience robust growth, driven by a rising geriatric population, increasing prevalence of chronic diseases necessitating organ replacement or augmentation, and technological advancements leading to improved implant functionality and longevity. The 7.01% CAGR (Compound Annual Growth Rate) from 2025 to 2033 indicates significant market expansion, with substantial investment in research and development fueling innovation across artificial organs (such as artificial hearts and kidneys) and bionic devices (like prosthetic limbs and cochlear implants). Market segmentation reveals a strong demand for both categories, with artificial organs potentially holding a larger share due to the critical medical needs they address. Leading companies like Medtronic, Boston Scientific, and Ossur are driving competition through product diversification and strategic partnerships, further propelling market growth. Regional analysis indicates that the Northeast and West Coast regions of the United States, with their higher concentrations of medical facilities and specialized healthcare professionals, are expected to dominate the market, although growth is anticipated across all five regions. Factors such as high procedure costs and potential complications related to implant procedures may act as restraints, but these are likely to be offset by the increasing availability of advanced surgical techniques and insurance coverage.
The market's future trajectory is influenced by several key trends. The integration of AI and machine learning in device design and patient monitoring is enhancing implant efficacy and safety. Personalized medicine approaches are allowing for customized implants, improving patient outcomes. Growing public awareness of available technologies and improved access to financing options are expanding market reach. Regulatory approvals for novel implants and the increasing focus on minimally invasive surgical procedures are also positively impacting market growth. The long-term outlook for the US medical bionic implants and artificial organ industry remains optimistic, fueled by continuous technological innovation and a growing demand for life-enhancing solutions. Competitive pressures will likely remain high, driving companies to prioritize product innovation and strategic alliances to secure market share.
USA Medical Bionic Implants & Artificial Organ Industry: A Comprehensive Market Report (2019-2033)
This insightful report provides a comprehensive analysis of the burgeoning USA medical bionic implants and artificial organ industry, projecting a market value exceeding $XX Billion by 2033. The study covers the period 2019-2033, with 2025 serving as the base and estimated year. This report is crucial for stakeholders seeking to understand market dynamics, identify growth opportunities, and make informed strategic decisions within this rapidly evolving sector.
USA Medical Bionic Implants & Artificial Organ Industry Market Composition & Trends
This section meticulously dissects the competitive landscape of the USA medical bionic implants and artificial organ market. We evaluate market concentration, revealing the market share distribution among key players like Ossur, Abiomed Inc, LifeNet Health Inc, Jarvik Heart Inc, Orthofix International NV, Edward Lifesciences Corporation, Boston Scientific Corporation, Berlin Heart GmbH, Medtronic plc, and Ekso Bionics Holdings, Inc. The analysis further explores innovation drivers, including advancements in biomaterials and surgical techniques. We delve into the regulatory landscape, examining FDA approvals and their impact on market access. Substitute product analysis highlights alternative treatment options and their market penetration. End-user profiles illuminate the characteristics of hospitals, clinics, and individual patients driving demand. Finally, we analyze mergers and acquisitions (M&A) activity, including deal values and their strategic implications, providing a granular understanding of the market's dynamic evolution.
- Market Concentration: High/Medium/Low (Specify based on data analysis). Detailed market share breakdown will be provided.
- M&A Activity: Analysis of at least 5 significant M&A deals (with values if available, otherwise estimated). Examples include (with details based on your research): Company A acquires Company B for $XX Billion, impacting market share by X%.
- Regulatory Landscape: Detailed assessment of FDA regulations and their impact on market growth and innovation.
- Substitute Products: Analysis of alternative treatment options and their competitive impact.
USA Medical Bionic Implants & Artificial Organ Industry Industry Evolution
This section charts the evolution of the USA medical bionic implants and artificial organ industry from 2019 to 2033. We analyze market growth trajectories, revealing a Compound Annual Growth Rate (CAGR) of XX% during the forecast period (2025-2033) based on the historical period (2019-2024). Technological advancements, such as the development of biocompatible materials and minimally invasive surgical techniques, are examined for their impact on market growth. Shifting consumer demands, including increased preference for minimally invasive procedures and improved patient outcomes, are discussed in detail. Specific data points will illustrate adoption rates of new technologies and overall market penetration. We explore the impact of factors like increasing geriatric population, rising prevalence of chronic diseases and advancements in surgical techniques.
Leading Regions, Countries, or Segments in USA Medical Bionic Implants & Artificial Organ Industry
This section pinpoints the leading regions, countries, or segments within the USA medical bionic implants and artificial organ industry. We analyze the dominance of specific geographic areas or product categories (Artificial Organs and Bionics).
Key Drivers:
- High Investment in R&D: Detail on funding levels and their correlation with technological innovation.
- Favorable Regulatory Environment: Specific examples of regulatory approvals stimulating market expansion in certain regions or segments.
- Strong Healthcare Infrastructure: Discussion on how advanced healthcare infrastructure drives adoption of bionic implants and artificial organs.
In-depth Analysis: Detailed paragraphs exploring factors contributing to the dominance of leading regions/segments, including population demographics, healthcare expenditure, and government initiatives.
USA Medical Bionic Implants & Artificial Organ Industry Product Innovations
This section highlights significant product innovations, including advancements in biomaterials, miniaturization techniques, and improved functionalities of artificial organs and bionic devices. We analyze the performance metrics of new products, such as longevity, biocompatibility, and efficacy. Unique selling propositions (USPs) of leading products are examined, along with their impact on market competition. Technological advancements, like AI-powered control systems and personalized medicine approaches, are discussed in detail.
Propelling Factors for USA Medical Bionic Implants & Artificial Organ Industry Growth
Several factors are driving the growth of the USA medical bionic implants and artificial organ industry. Technological advancements, leading to more efficient and durable implants, are a significant factor. Economic factors, such as increased healthcare spending and insurance coverage, also contribute significantly. Furthermore, supportive government regulations and initiatives that incentivize innovation and market access play a vital role.
Obstacles in the USA Medical Bionic Implants & Artificial Organ Industry Market
Despite the significant growth potential, certain obstacles hinder market expansion. Stringent regulatory approvals can delay product launches and increase development costs. Supply chain disruptions, particularly the sourcing of specialized materials, can impact production capacity and timelines. Intense competition among established players and emerging companies further creates a challenging environment. The high cost of procedures and limited insurance coverage present significant barriers to market access for many patients.
Future Opportunities in USA Medical Bionic Implants & Artificial Organ Industry
Emerging opportunities lie in expanding into new markets, developing advanced biomaterials with enhanced biocompatibility, and incorporating artificial intelligence for personalized treatments. Growth in the geriatric population and the increasing prevalence of chronic diseases will further drive demand. Focus on improving the affordability of these life-changing technologies will unlock significant market potential.
Major Players in the USA Medical Bionic Implants & Artificial Organ Industry Ecosystem
- Ossur
- Abiomed Inc
- LifeNet Health Inc
- Jarvik Heart Inc
- Orthofix International NV
- Edward Lifesciences Corporation
- Boston Scientific Corporation
- Berlin Heart GmbH
- Medtronic plc
- Ekso Bionics Holdings, Inc
Key Developments in USA Medical Bionic Implants & Artificial Organ Industry Industry
- [Month, Year]: Company X launches a new bionic limb with improved functionality.
- [Month, Year]: FDA approves a novel artificial heart valve, expanding market access.
- [Month, Year]: Company Y acquires Company Z, consolidating market share and resources.
- (Add more bullet points with specific details)
Strategic USA Medical Bionic Implants & Artificial Organ Industry Market Forecast
The USA medical bionic implants and artificial organ industry is poised for robust growth driven by technological innovations, increasing healthcare expenditure, and the growing prevalence of chronic diseases. The projected market expansion offers lucrative opportunities for established players and new entrants alike. Strategic partnerships, investments in R&D, and a focus on personalized medicine will be crucial for success in this dynamic market. The market is expected to reach $XX Billion by 2033.
USA Medical Bionic Implants & Artificial Organ Industry Segmentation
-
1. Product
-
1.1. Artificial Organs
- 1.1.1. Artificial Heart
- 1.1.2. Artificial Kidney
- 1.1.3. Cochlear Implants
- 1.1.4. Others
-
1.2. Bionics
- 1.2.1. Vision Bionics
- 1.2.2. Ear Bionics
- 1.2.3. Orthopedic Bionic
- 1.2.4. Cardiac Bionics
-
1.1. Artificial Organs
USA Medical Bionic Implants & Artificial Organ Industry Segmentation By Geography
-
1. North America
- 1.1. United States
- 1.2. Canada
- 1.3. Mexico
-
2. South America
- 2.1. Brazil
- 2.2. Argentina
- 2.3. Rest of South America
-
3. Europe
- 3.1. United Kingdom
- 3.2. Germany
- 3.3. France
- 3.4. Italy
- 3.5. Spain
- 3.6. Russia
- 3.7. Benelux
- 3.8. Nordics
- 3.9. Rest of Europe
-
4. Middle East & Africa
- 4.1. Turkey
- 4.2. Israel
- 4.3. GCC
- 4.4. North Africa
- 4.5. South Africa
- 4.6. Rest of Middle East & Africa
-
5. Asia Pacific
- 5.1. China
- 5.2. India
- 5.3. Japan
- 5.4. South Korea
- 5.5. ASEAN
- 5.6. Oceania
- 5.7. Rest of Asia Pacific
USA Medical Bionic Implants & Artificial Organ Industry REPORT HIGHLIGHTS
| Aspects | Details |
|---|---|
| Study Period | 2019-2033 |
| Base Year | 2024 |
| Estimated Year | 2025 |
| Forecast Period | 2025-2033 |
| Historical Period | 2019-2024 |
| Growth Rate | CAGR of 7.01% from 2019-2033 |
| Segmentation |
|
Table of Contents
- 1. Introduction
- 1.1. Research Scope
- 1.2. Market Segmentation
- 1.3. Research Methodology
- 1.4. Definitions and Assumptions
- 2. Executive Summary
- 2.1. Introduction
- 3. Market Dynamics
- 3.1. Introduction
- 3.2. Market Drivers
- 3.2.1. Increased Incidence of Disabilities and Organ Failures; Technological Advancements Leading to Enhanced Applications
- 3.3. Market Restrains
- 3.3.1. Expensive Procedures; Fear of Device Malfunction and its Consequences
- 3.4. Market Trends
- 3.4.1. Cardiac Bionics Segment is Expected to Have a Highest Growth Rate in the Forecast Period
- 4. Market Factor Analysis
- 4.1. Porters Five Forces
- 4.2. Supply/Value Chain
- 4.3. PESTEL analysis
- 4.4. Market Entropy
- 4.5. Patent/Trademark Analysis
- 5. Global USA Medical Bionic Implants & Artificial Organ Industry Analysis, Insights and Forecast, 2019-2031
- 5.1. Market Analysis, Insights and Forecast - by Product
- 5.1.1. Artificial Organs
- 5.1.1.1. Artificial Heart
- 5.1.1.2. Artificial Kidney
- 5.1.1.3. Cochlear Implants
- 5.1.1.4. Others
- 5.1.2. Bionics
- 5.1.2.1. Vision Bionics
- 5.1.2.2. Ear Bionics
- 5.1.2.3. Orthopedic Bionic
- 5.1.2.4. Cardiac Bionics
- 5.1.1. Artificial Organs
- 5.2. Market Analysis, Insights and Forecast - by Region
- 5.2.1. North America
- 5.2.2. South America
- 5.2.3. Europe
- 5.2.4. Middle East & Africa
- 5.2.5. Asia Pacific
- 5.1. Market Analysis, Insights and Forecast - by Product
- 6. North America USA Medical Bionic Implants & Artificial Organ Industry Analysis, Insights and Forecast, 2019-2031
- 6.1. Market Analysis, Insights and Forecast - by Product
- 6.1.1. Artificial Organs
- 6.1.1.1. Artificial Heart
- 6.1.1.2. Artificial Kidney
- 6.1.1.3. Cochlear Implants
- 6.1.1.4. Others
- 6.1.2. Bionics
- 6.1.2.1. Vision Bionics
- 6.1.2.2. Ear Bionics
- 6.1.2.3. Orthopedic Bionic
- 6.1.2.4. Cardiac Bionics
- 6.1.1. Artificial Organs
- 6.1. Market Analysis, Insights and Forecast - by Product
- 7. South America USA Medical Bionic Implants & Artificial Organ Industry Analysis, Insights and Forecast, 2019-2031
- 7.1. Market Analysis, Insights and Forecast - by Product
- 7.1.1. Artificial Organs
- 7.1.1.1. Artificial Heart
- 7.1.1.2. Artificial Kidney
- 7.1.1.3. Cochlear Implants
- 7.1.1.4. Others
- 7.1.2. Bionics
- 7.1.2.1. Vision Bionics
- 7.1.2.2. Ear Bionics
- 7.1.2.3. Orthopedic Bionic
- 7.1.2.4. Cardiac Bionics
- 7.1.1. Artificial Organs
- 7.1. Market Analysis, Insights and Forecast - by Product
- 8. Europe USA Medical Bionic Implants & Artificial Organ Industry Analysis, Insights and Forecast, 2019-2031
- 8.1. Market Analysis, Insights and Forecast - by Product
- 8.1.1. Artificial Organs
- 8.1.1.1. Artificial Heart
- 8.1.1.2. Artificial Kidney
- 8.1.1.3. Cochlear Implants
- 8.1.1.4. Others
- 8.1.2. Bionics
- 8.1.2.1. Vision Bionics
- 8.1.2.2. Ear Bionics
- 8.1.2.3. Orthopedic Bionic
- 8.1.2.4. Cardiac Bionics
- 8.1.1. Artificial Organs
- 8.1. Market Analysis, Insights and Forecast - by Product
- 9. Middle East & Africa USA Medical Bionic Implants & Artificial Organ Industry Analysis, Insights and Forecast, 2019-2031
- 9.1. Market Analysis, Insights and Forecast - by Product
- 9.1.1. Artificial Organs
- 9.1.1.1. Artificial Heart
- 9.1.1.2. Artificial Kidney
- 9.1.1.3. Cochlear Implants
- 9.1.1.4. Others
- 9.1.2. Bionics
- 9.1.2.1. Vision Bionics
- 9.1.2.2. Ear Bionics
- 9.1.2.3. Orthopedic Bionic
- 9.1.2.4. Cardiac Bionics
- 9.1.1. Artificial Organs
- 9.1. Market Analysis, Insights and Forecast - by Product
- 10. Asia Pacific USA Medical Bionic Implants & Artificial Organ Industry Analysis, Insights and Forecast, 2019-2031
- 10.1. Market Analysis, Insights and Forecast - by Product
- 10.1.1. Artificial Organs
- 10.1.1.1. Artificial Heart
- 10.1.1.2. Artificial Kidney
- 10.1.1.3. Cochlear Implants
- 10.1.1.4. Others
- 10.1.2. Bionics
- 10.1.2.1. Vision Bionics
- 10.1.2.2. Ear Bionics
- 10.1.2.3. Orthopedic Bionic
- 10.1.2.4. Cardiac Bionics
- 10.1.1. Artificial Organs
- 10.1. Market Analysis, Insights and Forecast - by Product
- 11. Northeast USA Medical Bionic Implants & Artificial Organ Industry Analysis, Insights and Forecast, 2019-2031
- 12. Southeast USA Medical Bionic Implants & Artificial Organ Industry Analysis, Insights and Forecast, 2019-2031
- 13. Midwest USA Medical Bionic Implants & Artificial Organ Industry Analysis, Insights and Forecast, 2019-2031
- 14. Southwest USA Medical Bionic Implants & Artificial Organ Industry Analysis, Insights and Forecast, 2019-2031
- 15. West USA Medical Bionic Implants & Artificial Organ Industry Analysis, Insights and Forecast, 2019-2031
- 16. Competitive Analysis
- 16.1. Global Market Share Analysis 2024
- 16.2. Company Profiles
- 16.2.1 Ossur
- 16.2.1.1. Overview
- 16.2.1.2. Products
- 16.2.1.3. SWOT Analysis
- 16.2.1.4. Recent Developments
- 16.2.1.5. Financials (Based on Availability)
- 16.2.2 Abiomed Inc
- 16.2.2.1. Overview
- 16.2.2.2. Products
- 16.2.2.3. SWOT Analysis
- 16.2.2.4. Recent Developments
- 16.2.2.5. Financials (Based on Availability)
- 16.2.3 LifeNet Health Inc
- 16.2.3.1. Overview
- 16.2.3.2. Products
- 16.2.3.3. SWOT Analysis
- 16.2.3.4. Recent Developments
- 16.2.3.5. Financials (Based on Availability)
- 16.2.4 Jarvik Heart Inc
- 16.2.4.1. Overview
- 16.2.4.2. Products
- 16.2.4.3. SWOT Analysis
- 16.2.4.4. Recent Developments
- 16.2.4.5. Financials (Based on Availability)
- 16.2.5 Orthofix International NV*List Not Exhaustive
- 16.2.5.1. Overview
- 16.2.5.2. Products
- 16.2.5.3. SWOT Analysis
- 16.2.5.4. Recent Developments
- 16.2.5.5. Financials (Based on Availability)
- 16.2.6 Edward Lifesciences Corporation
- 16.2.6.1. Overview
- 16.2.6.2. Products
- 16.2.6.3. SWOT Analysis
- 16.2.6.4. Recent Developments
- 16.2.6.5. Financials (Based on Availability)
- 16.2.7 Boston Scientific Corporation
- 16.2.7.1. Overview
- 16.2.7.2. Products
- 16.2.7.3. SWOT Analysis
- 16.2.7.4. Recent Developments
- 16.2.7.5. Financials (Based on Availability)
- 16.2.8 Berlin Heart GmbH
- 16.2.8.1. Overview
- 16.2.8.2. Products
- 16.2.8.3. SWOT Analysis
- 16.2.8.4. Recent Developments
- 16.2.8.5. Financials (Based on Availability)
- 16.2.9 Medtronic plc
- 16.2.9.1. Overview
- 16.2.9.2. Products
- 16.2.9.3. SWOT Analysis
- 16.2.9.4. Recent Developments
- 16.2.9.5. Financials (Based on Availability)
- 16.2.10 Ekso Bionics Holdings Inc
- 16.2.10.1. Overview
- 16.2.10.2. Products
- 16.2.10.3. SWOT Analysis
- 16.2.10.4. Recent Developments
- 16.2.10.5. Financials (Based on Availability)
- 16.2.1 Ossur
List of Figures
- Figure 1: Global USA Medical Bionic Implants & Artificial Organ Industry Revenue Breakdown (Billion, %) by Region 2024 & 2032
- Figure 2: Global USA Medical Bionic Implants & Artificial Organ Industry Volume Breakdown (Piece, %) by Region 2024 & 2032
- Figure 3: United states USA Medical Bionic Implants & Artificial Organ Industry Revenue (Billion), by Country 2024 & 2032
- Figure 4: United states USA Medical Bionic Implants & Artificial Organ Industry Volume (Piece), by Country 2024 & 2032
- Figure 5: United states USA Medical Bionic Implants & Artificial Organ Industry Revenue Share (%), by Country 2024 & 2032
- Figure 6: United states USA Medical Bionic Implants & Artificial Organ Industry Volume Share (%), by Country 2024 & 2032
- Figure 7: North America USA Medical Bionic Implants & Artificial Organ Industry Revenue (Billion), by Product 2024 & 2032
- Figure 8: North America USA Medical Bionic Implants & Artificial Organ Industry Volume (Piece), by Product 2024 & 2032
- Figure 9: North America USA Medical Bionic Implants & Artificial Organ Industry Revenue Share (%), by Product 2024 & 2032
- Figure 10: North America USA Medical Bionic Implants & Artificial Organ Industry Volume Share (%), by Product 2024 & 2032
- Figure 11: North America USA Medical Bionic Implants & Artificial Organ Industry Revenue (Billion), by Country 2024 & 2032
- Figure 12: North America USA Medical Bionic Implants & Artificial Organ Industry Volume (Piece), by Country 2024 & 2032
- Figure 13: North America USA Medical Bionic Implants & Artificial Organ Industry Revenue Share (%), by Country 2024 & 2032
- Figure 14: North America USA Medical Bionic Implants & Artificial Organ Industry Volume Share (%), by Country 2024 & 2032
- Figure 15: South America USA Medical Bionic Implants & Artificial Organ Industry Revenue (Billion), by Product 2024 & 2032
- Figure 16: South America USA Medical Bionic Implants & Artificial Organ Industry Volume (Piece), by Product 2024 & 2032
- Figure 17: South America USA Medical Bionic Implants & Artificial Organ Industry Revenue Share (%), by Product 2024 & 2032
- Figure 18: South America USA Medical Bionic Implants & Artificial Organ Industry Volume Share (%), by Product 2024 & 2032
- Figure 19: South America USA Medical Bionic Implants & Artificial Organ Industry Revenue (Billion), by Country 2024 & 2032
- Figure 20: South America USA Medical Bionic Implants & Artificial Organ Industry Volume (Piece), by Country 2024 & 2032
- Figure 21: South America USA Medical Bionic Implants & Artificial Organ Industry Revenue Share (%), by Country 2024 & 2032
- Figure 22: South America USA Medical Bionic Implants & Artificial Organ Industry Volume Share (%), by Country 2024 & 2032
- Figure 23: Europe USA Medical Bionic Implants & Artificial Organ Industry Revenue (Billion), by Product 2024 & 2032
- Figure 24: Europe USA Medical Bionic Implants & Artificial Organ Industry Volume (Piece), by Product 2024 & 2032
- Figure 25: Europe USA Medical Bionic Implants & Artificial Organ Industry Revenue Share (%), by Product 2024 & 2032
- Figure 26: Europe USA Medical Bionic Implants & Artificial Organ Industry Volume Share (%), by Product 2024 & 2032
- Figure 27: Europe USA Medical Bionic Implants & Artificial Organ Industry Revenue (Billion), by Country 2024 & 2032
- Figure 28: Europe USA Medical Bionic Implants & Artificial Organ Industry Volume (Piece), by Country 2024 & 2032
- Figure 29: Europe USA Medical Bionic Implants & Artificial Organ Industry Revenue Share (%), by Country 2024 & 2032
- Figure 30: Europe USA Medical Bionic Implants & Artificial Organ Industry Volume Share (%), by Country 2024 & 2032
- Figure 31: Middle East & Africa USA Medical Bionic Implants & Artificial Organ Industry Revenue (Billion), by Product 2024 & 2032
- Figure 32: Middle East & Africa USA Medical Bionic Implants & Artificial Organ Industry Volume (Piece), by Product 2024 & 2032
- Figure 33: Middle East & Africa USA Medical Bionic Implants & Artificial Organ Industry Revenue Share (%), by Product 2024 & 2032
- Figure 34: Middle East & Africa USA Medical Bionic Implants & Artificial Organ Industry Volume Share (%), by Product 2024 & 2032
- Figure 35: Middle East & Africa USA Medical Bionic Implants & Artificial Organ Industry Revenue (Billion), by Country 2024 & 2032
- Figure 36: Middle East & Africa USA Medical Bionic Implants & Artificial Organ Industry Volume (Piece), by Country 2024 & 2032
- Figure 37: Middle East & Africa USA Medical Bionic Implants & Artificial Organ Industry Revenue Share (%), by Country 2024 & 2032
- Figure 38: Middle East & Africa USA Medical Bionic Implants & Artificial Organ Industry Volume Share (%), by Country 2024 & 2032
- Figure 39: Asia Pacific USA Medical Bionic Implants & Artificial Organ Industry Revenue (Billion), by Product 2024 & 2032
- Figure 40: Asia Pacific USA Medical Bionic Implants & Artificial Organ Industry Volume (Piece), by Product 2024 & 2032
- Figure 41: Asia Pacific USA Medical Bionic Implants & Artificial Organ Industry Revenue Share (%), by Product 2024 & 2032
- Figure 42: Asia Pacific USA Medical Bionic Implants & Artificial Organ Industry Volume Share (%), by Product 2024 & 2032
- Figure 43: Asia Pacific USA Medical Bionic Implants & Artificial Organ Industry Revenue (Billion), by Country 2024 & 2032
- Figure 44: Asia Pacific USA Medical Bionic Implants & Artificial Organ Industry Volume (Piece), by Country 2024 & 2032
- Figure 45: Asia Pacific USA Medical Bionic Implants & Artificial Organ Industry Revenue Share (%), by Country 2024 & 2032
- Figure 46: Asia Pacific USA Medical Bionic Implants & Artificial Organ Industry Volume Share (%), by Country 2024 & 2032
List of Tables
- Table 1: Global USA Medical Bionic Implants & Artificial Organ Industry Revenue Billion Forecast, by Region 2019 & 2032
- Table 2: Global USA Medical Bionic Implants & Artificial Organ Industry Volume Piece Forecast, by Region 2019 & 2032
- Table 3: Global USA Medical Bionic Implants & Artificial Organ Industry Revenue Billion Forecast, by Product 2019 & 2032
- Table 4: Global USA Medical Bionic Implants & Artificial Organ Industry Volume Piece Forecast, by Product 2019 & 2032
- Table 5: Global USA Medical Bionic Implants & Artificial Organ Industry Revenue Billion Forecast, by Region 2019 & 2032
- Table 6: Global USA Medical Bionic Implants & Artificial Organ Industry Volume Piece Forecast, by Region 2019 & 2032
- Table 7: Global USA Medical Bionic Implants & Artificial Organ Industry Revenue Billion Forecast, by Country 2019 & 2032
- Table 8: Global USA Medical Bionic Implants & Artificial Organ Industry Volume Piece Forecast, by Country 2019 & 2032
- Table 9: Northeast USA Medical Bionic Implants & Artificial Organ Industry Revenue (Billion) Forecast, by Application 2019 & 2032
- Table 10: Northeast USA Medical Bionic Implants & Artificial Organ Industry Volume (Piece) Forecast, by Application 2019 & 2032
- Table 11: Southeast USA Medical Bionic Implants & Artificial Organ Industry Revenue (Billion) Forecast, by Application 2019 & 2032
- Table 12: Southeast USA Medical Bionic Implants & Artificial Organ Industry Volume (Piece) Forecast, by Application 2019 & 2032
- Table 13: Midwest USA Medical Bionic Implants & Artificial Organ Industry Revenue (Billion) Forecast, by Application 2019 & 2032
- Table 14: Midwest USA Medical Bionic Implants & Artificial Organ Industry Volume (Piece) Forecast, by Application 2019 & 2032
- Table 15: Southwest USA Medical Bionic Implants & Artificial Organ Industry Revenue (Billion) Forecast, by Application 2019 & 2032
- Table 16: Southwest USA Medical Bionic Implants & Artificial Organ Industry Volume (Piece) Forecast, by Application 2019 & 2032
- Table 17: West USA Medical Bionic Implants & Artificial Organ Industry Revenue (Billion) Forecast, by Application 2019 & 2032
- Table 18: West USA Medical Bionic Implants & Artificial Organ Industry Volume (Piece) Forecast, by Application 2019 & 2032
- Table 19: Global USA Medical Bionic Implants & Artificial Organ Industry Revenue Billion Forecast, by Product 2019 & 2032
- Table 20: Global USA Medical Bionic Implants & Artificial Organ Industry Volume Piece Forecast, by Product 2019 & 2032
- Table 21: Global USA Medical Bionic Implants & Artificial Organ Industry Revenue Billion Forecast, by Country 2019 & 2032
- Table 22: Global USA Medical Bionic Implants & Artificial Organ Industry Volume Piece Forecast, by Country 2019 & 2032
- Table 23: United States USA Medical Bionic Implants & Artificial Organ Industry Revenue (Billion) Forecast, by Application 2019 & 2032
- Table 24: United States USA Medical Bionic Implants & Artificial Organ Industry Volume (Piece) Forecast, by Application 2019 & 2032
- Table 25: Canada USA Medical Bionic Implants & Artificial Organ Industry Revenue (Billion) Forecast, by Application 2019 & 2032
- Table 26: Canada USA Medical Bionic Implants & Artificial Organ Industry Volume (Piece) Forecast, by Application 2019 & 2032
- Table 27: Mexico USA Medical Bionic Implants & Artificial Organ Industry Revenue (Billion) Forecast, by Application 2019 & 2032
- Table 28: Mexico USA Medical Bionic Implants & Artificial Organ Industry Volume (Piece) Forecast, by Application 2019 & 2032
- Table 29: Global USA Medical Bionic Implants & Artificial Organ Industry Revenue Billion Forecast, by Product 2019 & 2032
- Table 30: Global USA Medical Bionic Implants & Artificial Organ Industry Volume Piece Forecast, by Product 2019 & 2032
- Table 31: Global USA Medical Bionic Implants & Artificial Organ Industry Revenue Billion Forecast, by Country 2019 & 2032
- Table 32: Global USA Medical Bionic Implants & Artificial Organ Industry Volume Piece Forecast, by Country 2019 & 2032
- Table 33: Brazil USA Medical Bionic Implants & Artificial Organ Industry Revenue (Billion) Forecast, by Application 2019 & 2032
- Table 34: Brazil USA Medical Bionic Implants & Artificial Organ Industry Volume (Piece) Forecast, by Application 2019 & 2032
- Table 35: Argentina USA Medical Bionic Implants & Artificial Organ Industry Revenue (Billion) Forecast, by Application 2019 & 2032
- Table 36: Argentina USA Medical Bionic Implants & Artificial Organ Industry Volume (Piece) Forecast, by Application 2019 & 2032
- Table 37: Rest of South America USA Medical Bionic Implants & Artificial Organ Industry Revenue (Billion) Forecast, by Application 2019 & 2032
- Table 38: Rest of South America USA Medical Bionic Implants & Artificial Organ Industry Volume (Piece) Forecast, by Application 2019 & 2032
- Table 39: Global USA Medical Bionic Implants & Artificial Organ Industry Revenue Billion Forecast, by Product 2019 & 2032
- Table 40: Global USA Medical Bionic Implants & Artificial Organ Industry Volume Piece Forecast, by Product 2019 & 2032
- Table 41: Global USA Medical Bionic Implants & Artificial Organ Industry Revenue Billion Forecast, by Country 2019 & 2032
- Table 42: Global USA Medical Bionic Implants & Artificial Organ Industry Volume Piece Forecast, by Country 2019 & 2032
- Table 43: United Kingdom USA Medical Bionic Implants & Artificial Organ Industry Revenue (Billion) Forecast, by Application 2019 & 2032
- Table 44: United Kingdom USA Medical Bionic Implants & Artificial Organ Industry Volume (Piece) Forecast, by Application 2019 & 2032
- Table 45: Germany USA Medical Bionic Implants & Artificial Organ Industry Revenue (Billion) Forecast, by Application 2019 & 2032
- Table 46: Germany USA Medical Bionic Implants & Artificial Organ Industry Volume (Piece) Forecast, by Application 2019 & 2032
- Table 47: France USA Medical Bionic Implants & Artificial Organ Industry Revenue (Billion) Forecast, by Application 2019 & 2032
- Table 48: France USA Medical Bionic Implants & Artificial Organ Industry Volume (Piece) Forecast, by Application 2019 & 2032
- Table 49: Italy USA Medical Bionic Implants & Artificial Organ Industry Revenue (Billion) Forecast, by Application 2019 & 2032
- Table 50: Italy USA Medical Bionic Implants & Artificial Organ Industry Volume (Piece) Forecast, by Application 2019 & 2032
- Table 51: Spain USA Medical Bionic Implants & Artificial Organ Industry Revenue (Billion) Forecast, by Application 2019 & 2032
- Table 52: Spain USA Medical Bionic Implants & Artificial Organ Industry Volume (Piece) Forecast, by Application 2019 & 2032
- Table 53: Russia USA Medical Bionic Implants & Artificial Organ Industry Revenue (Billion) Forecast, by Application 2019 & 2032
- Table 54: Russia USA Medical Bionic Implants & Artificial Organ Industry Volume (Piece) Forecast, by Application 2019 & 2032
- Table 55: Benelux USA Medical Bionic Implants & Artificial Organ Industry Revenue (Billion) Forecast, by Application 2019 & 2032
- Table 56: Benelux USA Medical Bionic Implants & Artificial Organ Industry Volume (Piece) Forecast, by Application 2019 & 2032
- Table 57: Nordics USA Medical Bionic Implants & Artificial Organ Industry Revenue (Billion) Forecast, by Application 2019 & 2032
- Table 58: Nordics USA Medical Bionic Implants & Artificial Organ Industry Volume (Piece) Forecast, by Application 2019 & 2032
- Table 59: Rest of Europe USA Medical Bionic Implants & Artificial Organ Industry Revenue (Billion) Forecast, by Application 2019 & 2032
- Table 60: Rest of Europe USA Medical Bionic Implants & Artificial Organ Industry Volume (Piece) Forecast, by Application 2019 & 2032
- Table 61: Global USA Medical Bionic Implants & Artificial Organ Industry Revenue Billion Forecast, by Product 2019 & 2032
- Table 62: Global USA Medical Bionic Implants & Artificial Organ Industry Volume Piece Forecast, by Product 2019 & 2032
- Table 63: Global USA Medical Bionic Implants & Artificial Organ Industry Revenue Billion Forecast, by Country 2019 & 2032
- Table 64: Global USA Medical Bionic Implants & Artificial Organ Industry Volume Piece Forecast, by Country 2019 & 2032
- Table 65: Turkey USA Medical Bionic Implants & Artificial Organ Industry Revenue (Billion) Forecast, by Application 2019 & 2032
- Table 66: Turkey USA Medical Bionic Implants & Artificial Organ Industry Volume (Piece) Forecast, by Application 2019 & 2032
- Table 67: Israel USA Medical Bionic Implants & Artificial Organ Industry Revenue (Billion) Forecast, by Application 2019 & 2032
- Table 68: Israel USA Medical Bionic Implants & Artificial Organ Industry Volume (Piece) Forecast, by Application 2019 & 2032
- Table 69: GCC USA Medical Bionic Implants & Artificial Organ Industry Revenue (Billion) Forecast, by Application 2019 & 2032
- Table 70: GCC USA Medical Bionic Implants & Artificial Organ Industry Volume (Piece) Forecast, by Application 2019 & 2032
- Table 71: North Africa USA Medical Bionic Implants & Artificial Organ Industry Revenue (Billion) Forecast, by Application 2019 & 2032
- Table 72: North Africa USA Medical Bionic Implants & Artificial Organ Industry Volume (Piece) Forecast, by Application 2019 & 2032
- Table 73: South Africa USA Medical Bionic Implants & Artificial Organ Industry Revenue (Billion) Forecast, by Application 2019 & 2032
- Table 74: South Africa USA Medical Bionic Implants & Artificial Organ Industry Volume (Piece) Forecast, by Application 2019 & 2032
- Table 75: Rest of Middle East & Africa USA Medical Bionic Implants & Artificial Organ Industry Revenue (Billion) Forecast, by Application 2019 & 2032
- Table 76: Rest of Middle East & Africa USA Medical Bionic Implants & Artificial Organ Industry Volume (Piece) Forecast, by Application 2019 & 2032
- Table 77: Global USA Medical Bionic Implants & Artificial Organ Industry Revenue Billion Forecast, by Product 2019 & 2032
- Table 78: Global USA Medical Bionic Implants & Artificial Organ Industry Volume Piece Forecast, by Product 2019 & 2032
- Table 79: Global USA Medical Bionic Implants & Artificial Organ Industry Revenue Billion Forecast, by Country 2019 & 2032
- Table 80: Global USA Medical Bionic Implants & Artificial Organ Industry Volume Piece Forecast, by Country 2019 & 2032
- Table 81: China USA Medical Bionic Implants & Artificial Organ Industry Revenue (Billion) Forecast, by Application 2019 & 2032
- Table 82: China USA Medical Bionic Implants & Artificial Organ Industry Volume (Piece) Forecast, by Application 2019 & 2032
- Table 83: India USA Medical Bionic Implants & Artificial Organ Industry Revenue (Billion) Forecast, by Application 2019 & 2032
- Table 84: India USA Medical Bionic Implants & Artificial Organ Industry Volume (Piece) Forecast, by Application 2019 & 2032
- Table 85: Japan USA Medical Bionic Implants & Artificial Organ Industry Revenue (Billion) Forecast, by Application 2019 & 2032
- Table 86: Japan USA Medical Bionic Implants & Artificial Organ Industry Volume (Piece) Forecast, by Application 2019 & 2032
- Table 87: South Korea USA Medical Bionic Implants & Artificial Organ Industry Revenue (Billion) Forecast, by Application 2019 & 2032
- Table 88: South Korea USA Medical Bionic Implants & Artificial Organ Industry Volume (Piece) Forecast, by Application 2019 & 2032
- Table 89: ASEAN USA Medical Bionic Implants & Artificial Organ Industry Revenue (Billion) Forecast, by Application 2019 & 2032
- Table 90: ASEAN USA Medical Bionic Implants & Artificial Organ Industry Volume (Piece) Forecast, by Application 2019 & 2032
- Table 91: Oceania USA Medical Bionic Implants & Artificial Organ Industry Revenue (Billion) Forecast, by Application 2019 & 2032
- Table 92: Oceania USA Medical Bionic Implants & Artificial Organ Industry Volume (Piece) Forecast, by Application 2019 & 2032
- Table 93: Rest of Asia Pacific USA Medical Bionic Implants & Artificial Organ Industry Revenue (Billion) Forecast, by Application 2019 & 2032
- Table 94: Rest of Asia Pacific USA Medical Bionic Implants & Artificial Organ Industry Volume (Piece) Forecast, by Application 2019 & 2032
Frequently Asked Questions
1. What is the projected Compound Annual Growth Rate (CAGR) of the USA Medical Bionic Implants & Artificial Organ Industry?
The projected CAGR is approximately 7.01%.
2. Which companies are prominent players in the USA Medical Bionic Implants & Artificial Organ Industry?
Key companies in the market include Ossur, Abiomed Inc, LifeNet Health Inc, Jarvik Heart Inc, Orthofix International NV*List Not Exhaustive, Edward Lifesciences Corporation, Boston Scientific Corporation, Berlin Heart GmbH, Medtronic plc, Ekso Bionics Holdings, Inc.
3. What are the main segments of the USA Medical Bionic Implants & Artificial Organ Industry?
The market segments include Product.
4. Can you provide details about the market size?
The market size is estimated to be USD 13.45 Billion as of 2022.
5. What are some drivers contributing to market growth?
Increased Incidence of Disabilities and Organ Failures; Technological Advancements Leading to Enhanced Applications.
6. What are the notable trends driving market growth?
Cardiac Bionics Segment is Expected to Have a Highest Growth Rate in the Forecast Period.
7. Are there any restraints impacting market growth?
Expensive Procedures; Fear of Device Malfunction and its Consequences.
8. Can you provide examples of recent developments in the market?
N/A
9. What pricing options are available for accessing the report?
Pricing options include single-user, multi-user, and enterprise licenses priced at USD 3800, USD 4500, and USD 5800 respectively.
10. Is the market size provided in terms of value or volume?
The market size is provided in terms of value, measured in Billion and volume, measured in Piece.
11. Are there any specific market keywords associated with the report?
Yes, the market keyword associated with the report is "USA Medical Bionic Implants & Artificial Organ Industry," which aids in identifying and referencing the specific market segment covered.
12. How do I determine which pricing option suits my needs best?
The pricing options vary based on user requirements and access needs. Individual users may opt for single-user licenses, while businesses requiring broader access may choose multi-user or enterprise licenses for cost-effective access to the report.
13. Are there any additional resources or data provided in the USA Medical Bionic Implants & Artificial Organ Industry report?
While the report offers comprehensive insights, it's advisable to review the specific contents or supplementary materials provided to ascertain if additional resources or data are available.
14. How can I stay updated on further developments or reports in the USA Medical Bionic Implants & Artificial Organ Industry?
To stay informed about further developments, trends, and reports in the USA Medical Bionic Implants & Artificial Organ Industry, consider subscribing to industry newsletters, following relevant companies and organizations, or regularly checking reputable industry news sources and publications.
Methodology
Step 1 - Identification of Relevant Samples Size from Population Database


Step 2 - Approaches for Defining Global Market Size (Value, Volume* & Price*)

Note*: In applicable scenarios
Step 3 - Data Sources
Primary Research
- Web Analytics
- Survey Reports
- Research Institute
- Latest Research Reports
- Opinion Leaders
Secondary Research
- Annual Reports
- White Paper
- Latest Press Release
- Industry Association
- Paid Database
- Investor Presentations

Step 4 - Data Triangulation
Involves using different sources of information in order to increase the validity of a study
These sources are likely to be stakeholders in a program - participants, other researchers, program staff, other community members, and so on.
Then we put all data in single framework & apply various statistical tools to find out the dynamic on the market.
During the analysis stage, feedback from the stakeholder groups would be compared to determine areas of agreement as well as areas of divergence
