

Key Insights
The medical device pyrogenicity testing service market is experiencing robust growth, driven by the increasing demand for safe and sterile medical devices. Stringent regulatory requirements regarding pyrogen testing, coupled with a rising number of medical device approvals and launches globally, are significant contributors to this market expansion. The market is segmented by testing methods (e.g., LAL test, rabbit pyrogen test), device type (implantable, non-implantable), and end-user (pharmaceutical companies, medical device manufacturers, contract research organizations). While the rabbit pyrogen test is gradually being replaced by the more efficient and humane LAL (Limulus amebocyte lysate) test, both remain crucial components of the market. The market's competitive landscape is characterized by a mix of large multinational companies and specialized testing laboratories, each offering a range of services to meet diverse client needs. Geographic growth varies; North America and Europe currently hold significant market share, but regions like Asia-Pacific are exhibiting rapid growth, fueled by increasing healthcare infrastructure development and rising disposable incomes. Challenges include the high cost of testing and the need for specialized expertise, yet the overall market outlook remains positive, projected for considerable expansion over the next decade.
Technological advancements are further accelerating growth. Automation and advanced analytical techniques are improving the speed, accuracy, and cost-effectiveness of pyrogen testing, attracting more clients and expanding the market's potential. The increasing outsourcing of testing services by medical device manufacturers to specialized labs is another key driver. This trend allows companies to focus on core competencies while ensuring compliance with stringent regulatory standards. However, factors such as variations in regulatory landscapes across different countries and the need for continuous quality control and validation present challenges for market participants. Nevertheless, the long-term outlook for the medical device pyrogenicity testing service market remains extremely favorable, given the continued emphasis on patient safety and regulatory compliance within the medical device industry.
Medical Device Pyrogenicity Testing Service Market Report: 2019-2033
This comprehensive report provides an in-depth analysis of the Medical Device Pyrogenicity Testing Service market, projecting a multi-million dollar valuation by 2033. The study covers the period 2019-2033, with a base year of 2025 and a forecast period of 2025-2033. This report is invaluable for stakeholders including manufacturers, investors, regulatory bodies, and research institutions seeking to understand this critical segment of the medical device industry.
Medical Device Pyrogenicity Testing Service Market Composition & Trends
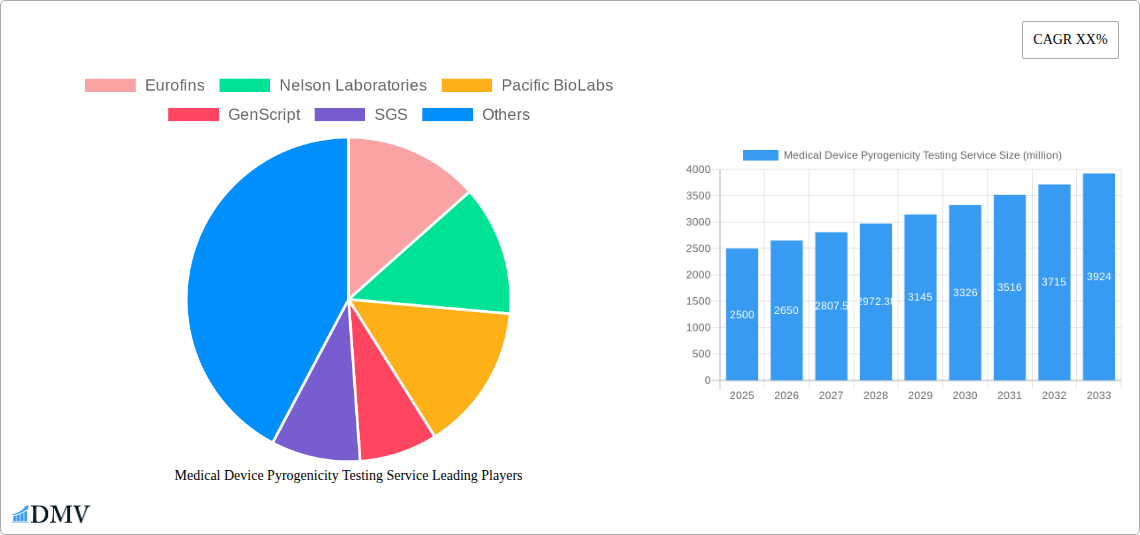
The global medical device pyrogenicity testing service market is experiencing significant growth, driven by increasing demand for safe medical devices and stringent regulatory compliance. Market concentration is moderate, with key players like Eurofins, Nelson Laboratories, and Charles River holding substantial market share, estimated at xx million USD collectively in 2025. However, smaller specialized labs and emerging players also contribute significantly. The market share distribution amongst these leading companies is approximately as follows: Eurofins (xx%), Nelson Laboratories (xx%), Charles River (xx%), with the remaining share distributed among other players. Innovation in testing methodologies, particularly in rapid pyrogen detection techniques, is a key catalyst. The regulatory landscape, dominated by bodies like the FDA and EMA, significantly influences market dynamics. Substitutes are limited, given the critical nature of pyrogenicity testing. End-users include medical device manufacturers across various segments – cardiovascular, orthopedics, ophthalmology, etc. M&A activity in the past five years has been relatively modest, with a total estimated deal value of xx million USD, driven primarily by consolidation amongst smaller players.
- Market Concentration: Moderate, with top 3 players holding xx% market share in 2025.
- Innovation Catalysts: Rapid pyrogen detection technologies, automation, and AI integration.
- Regulatory Landscape: Stringent guidelines from FDA, EMA, and other global regulatory bodies.
- Substitute Products: Limited alternatives due to regulatory requirements.
- End-User Profiles: Medical device manufacturers across various specialties.
- M&A Activities: xx million USD in deal value from 2019-2024.
Medical Device Pyrogenicity Testing Service Industry Evolution
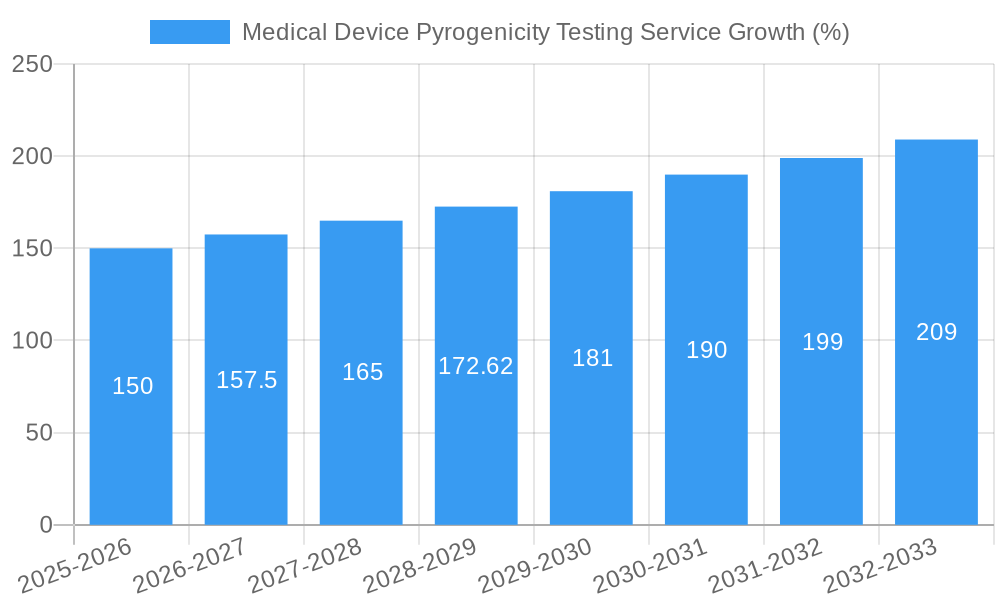
The medical device pyrogenicity testing service market has witnessed consistent growth over the historical period (2019-2024), expanding at a CAGR of xx%. This growth trajectory is expected to continue during the forecast period (2025-2033), propelled by several factors. Technological advancements, such as the introduction of automated and high-throughput testing systems, have significantly improved efficiency and reduced turnaround times. The increasing prevalence of chronic diseases and the rising demand for advanced medical devices are also driving market expansion. Consumer demand for safer and more reliable medical devices exerts constant pressure on manufacturers to ensure stringent quality control, fostering growth in this testing segment. The adoption rate of rapid pyrogen detection methods has steadily increased, from xx% in 2019 to xx% in 2024, signifying a shift towards faster and more efficient testing solutions. This trend is predicted to accelerate further during the forecast period. Furthermore, the increasing outsourcing of testing services by medical device manufacturers contributes significantly to the market’s expansion.
Leading Regions, Countries, or Segments in Medical Device Pyrogenicity Testing Service
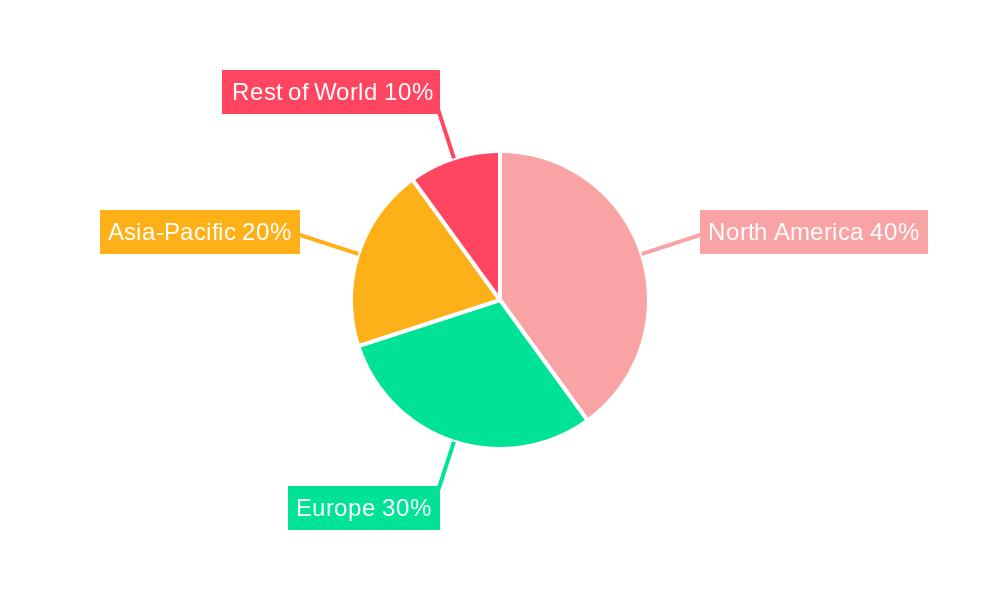
North America currently dominates the global medical device pyrogenicity testing service market, driven by factors like a robust regulatory framework, high healthcare expenditure, and a large concentration of medical device manufacturers.
- Key Drivers in North America:
- High healthcare expenditure and advanced medical device adoption rates.
- Stringent regulatory compliance driving demand for reliable testing services.
- Established presence of leading testing service providers.
- Significant investments in R&D for advanced testing technologies.
- Factors Contributing to North America's Dominance: The region boasts a strong regulatory framework, fostering trust and confidence in the quality of medical devices. The high density of medical device manufacturers in North America necessitates extensive pyrogenicity testing services, thereby fueling market growth. Furthermore, substantial R&D investments within the region are leading to innovation and the development of cutting-edge testing technologies.
Medical Device Pyrogenicity Testing Service Product Innovations
Recent innovations include automated systems that reduce manual handling, minimizing contamination risk and improving throughput. Rapid pyrogen detection methods, leveraging advanced technologies like LAL (Limulus Amebocyte Lysate) assays and alternative methods, offer significantly faster results compared to traditional methods. These advancements provide significant improvements in speed, accuracy, and cost-effectiveness. This has resulted in faster turnaround times and increased overall efficiency for medical device manufacturers.
Propelling Factors for Medical Device Pyrogenicity Testing Service Growth
The market is primarily propelled by the increasing stringency of regulatory requirements for medical device safety, coupled with the growing demand for advanced medical devices globally. Technological advancements in testing methodologies, leading to faster and more accurate results, further stimulate growth. Economic factors, such as the rising healthcare expenditure in several countries, also play a crucial role.
Obstacles in the Medical Device Pyrogenicity Testing Service Market
Key challenges include the high cost of advanced testing equipment and skilled labor, potentially limiting access for smaller companies. Supply chain disruptions, particularly concerning reagents and consumables used in pyrogen testing, can affect the market's stability. Intense competition among numerous testing service providers can lead to price pressure and reduced profit margins. Regulatory hurdles and evolving guidelines can also increase compliance costs and complexity for testing providers.
Future Opportunities in Medical Device Pyrogenicity Testing Service
Emerging opportunities lie in the development and adoption of novel pyrogen detection technologies, including point-of-care testing devices and advanced analytical techniques. Expanding into developing economies with growing healthcare sectors presents significant market potential. Furthermore, the increasing focus on personalized medicine and advanced therapies could create new niches within the pyrogenicity testing market.
Major Players in the Medical Device Pyrogenicity Testing Service Ecosystem
- Eurofins
- Nelson Laboratories
- Pacific BioLabs
- GenScript
- SGS
- Sartorius AG
- Iuvo
- Microcoat
- Measurlabs
- Charles River
- TUV SUD
- MAT Research
- Ethide Labs
- Wickham Micro
Key Developments in Medical Device Pyrogenicity Testing Service Industry
- 2022 Q3: Eurofins acquired a smaller testing lab, expanding its capacity and geographical reach.
- 2023 Q1: Nelson Laboratories launched a new automated pyrogen testing system.
- 2024 Q2: New FDA guidelines on pyrogen testing were implemented, impacting industry practices. (Further details on specific developments with dates would require access to industry specific news sources)
Strategic Medical Device Pyrogenicity Testing Service Market Forecast
The medical device pyrogenicity testing service market is poised for substantial growth, driven by technological advancements, stringent regulatory compliance, and an increasing demand for safe and effective medical devices. The market is expected to witness a CAGR of xx% during the forecast period (2025-2033), reaching a value of xx million USD by 2033. This growth will be fueled by the continued adoption of rapid pyrogen detection methods, expansion into emerging markets, and the ongoing development of innovative testing technologies.
Medical Device Pyrogenicity Testing Service Segmentation
-
1. Application
- 1.1. Implantable Devices
- 1.2. Blood-Contacting Devices
- 1.3. Others
-
2. Types
- 2.1. Bacterial Endotoxin Testing
- 2.2. Monocyte Activation Testing
- 2.3. Others
Medical Device Pyrogenicity Testing Service Segmentation By Geography
-
1. North America
- 1.1. United States
- 1.2. Canada
- 1.3. Mexico
-
2. South America
- 2.1. Brazil
- 2.2. Argentina
- 2.3. Rest of South America
-
3. Europe
- 3.1. United Kingdom
- 3.2. Germany
- 3.3. France
- 3.4. Italy
- 3.5. Spain
- 3.6. Russia
- 3.7. Benelux
- 3.8. Nordics
- 3.9. Rest of Europe
-
4. Middle East & Africa
- 4.1. Turkey
- 4.2. Israel
- 4.3. GCC
- 4.4. North Africa
- 4.5. South Africa
- 4.6. Rest of Middle East & Africa
-
5. Asia Pacific
- 5.1. China
- 5.2. India
- 5.3. Japan
- 5.4. South Korea
- 5.5. ASEAN
- 5.6. Oceania
- 5.7. Rest of Asia Pacific
Medical Device Pyrogenicity Testing Service REPORT HIGHLIGHTS
| Aspects | Details |
|---|---|
| Study Period | 2019-2033 |
| Base Year | 2024 |
| Estimated Year | 2025 |
| Forecast Period | 2025-2033 |
| Historical Period | 2019-2024 |
| Growth Rate | CAGR of XX% from 2019-2033 |
| Segmentation |
|
Table of Contents
- 1. Introduction
- 1.1. Research Scope
- 1.2. Market Segmentation
- 1.3. Research Methodology
- 1.4. Definitions and Assumptions
- 2. Executive Summary
- 2.1. Introduction
- 3. Market Dynamics
- 3.1. Introduction
- 3.2. Market Drivers
- 3.3. Market Restrains
- 3.4. Market Trends
- 4. Market Factor Analysis
- 4.1. Porters Five Forces
- 4.2. Supply/Value Chain
- 4.3. PESTEL analysis
- 4.4. Market Entropy
- 4.5. Patent/Trademark Analysis
- 5. Global Medical Device Pyrogenicity Testing Service Analysis, Insights and Forecast, 2019-2031
- 5.1. Market Analysis, Insights and Forecast - by Application
- 5.1.1. Implantable Devices
- 5.1.2. Blood-Contacting Devices
- 5.1.3. Others
- 5.2. Market Analysis, Insights and Forecast - by Types
- 5.2.1. Bacterial Endotoxin Testing
- 5.2.2. Monocyte Activation Testing
- 5.2.3. Others
- 5.3. Market Analysis, Insights and Forecast - by Region
- 5.3.1. North America
- 5.3.2. South America
- 5.3.3. Europe
- 5.3.4. Middle East & Africa
- 5.3.5. Asia Pacific
- 5.1. Market Analysis, Insights and Forecast - by Application
- 6. North America Medical Device Pyrogenicity Testing Service Analysis, Insights and Forecast, 2019-2031
- 6.1. Market Analysis, Insights and Forecast - by Application
- 6.1.1. Implantable Devices
- 6.1.2. Blood-Contacting Devices
- 6.1.3. Others
- 6.2. Market Analysis, Insights and Forecast - by Types
- 6.2.1. Bacterial Endotoxin Testing
- 6.2.2. Monocyte Activation Testing
- 6.2.3. Others
- 6.1. Market Analysis, Insights and Forecast - by Application
- 7. South America Medical Device Pyrogenicity Testing Service Analysis, Insights and Forecast, 2019-2031
- 7.1. Market Analysis, Insights and Forecast - by Application
- 7.1.1. Implantable Devices
- 7.1.2. Blood-Contacting Devices
- 7.1.3. Others
- 7.2. Market Analysis, Insights and Forecast - by Types
- 7.2.1. Bacterial Endotoxin Testing
- 7.2.2. Monocyte Activation Testing
- 7.2.3. Others
- 7.1. Market Analysis, Insights and Forecast - by Application
- 8. Europe Medical Device Pyrogenicity Testing Service Analysis, Insights and Forecast, 2019-2031
- 8.1. Market Analysis, Insights and Forecast - by Application
- 8.1.1. Implantable Devices
- 8.1.2. Blood-Contacting Devices
- 8.1.3. Others
- 8.2. Market Analysis, Insights and Forecast - by Types
- 8.2.1. Bacterial Endotoxin Testing
- 8.2.2. Monocyte Activation Testing
- 8.2.3. Others
- 8.1. Market Analysis, Insights and Forecast - by Application
- 9. Middle East & Africa Medical Device Pyrogenicity Testing Service Analysis, Insights and Forecast, 2019-2031
- 9.1. Market Analysis, Insights and Forecast - by Application
- 9.1.1. Implantable Devices
- 9.1.2. Blood-Contacting Devices
- 9.1.3. Others
- 9.2. Market Analysis, Insights and Forecast - by Types
- 9.2.1. Bacterial Endotoxin Testing
- 9.2.2. Monocyte Activation Testing
- 9.2.3. Others
- 9.1. Market Analysis, Insights and Forecast - by Application
- 10. Asia Pacific Medical Device Pyrogenicity Testing Service Analysis, Insights and Forecast, 2019-2031
- 10.1. Market Analysis, Insights and Forecast - by Application
- 10.1.1. Implantable Devices
- 10.1.2. Blood-Contacting Devices
- 10.1.3. Others
- 10.2. Market Analysis, Insights and Forecast - by Types
- 10.2.1. Bacterial Endotoxin Testing
- 10.2.2. Monocyte Activation Testing
- 10.2.3. Others
- 10.1. Market Analysis, Insights and Forecast - by Application
- 11. Competitive Analysis
- 11.1. Global Market Share Analysis 2024
- 11.2. Company Profiles
- 11.2.1 Eurofins
- 11.2.1.1. Overview
- 11.2.1.2. Products
- 11.2.1.3. SWOT Analysis
- 11.2.1.4. Recent Developments
- 11.2.1.5. Financials (Based on Availability)
- 11.2.2 Nelson Laboratories
- 11.2.2.1. Overview
- 11.2.2.2. Products
- 11.2.2.3. SWOT Analysis
- 11.2.2.4. Recent Developments
- 11.2.2.5. Financials (Based on Availability)
- 11.2.3 Pacific BioLabs
- 11.2.3.1. Overview
- 11.2.3.2. Products
- 11.2.3.3. SWOT Analysis
- 11.2.3.4. Recent Developments
- 11.2.3.5. Financials (Based on Availability)
- 11.2.4 GenScript
- 11.2.4.1. Overview
- 11.2.4.2. Products
- 11.2.4.3. SWOT Analysis
- 11.2.4.4. Recent Developments
- 11.2.4.5. Financials (Based on Availability)
- 11.2.5 SGS
- 11.2.5.1. Overview
- 11.2.5.2. Products
- 11.2.5.3. SWOT Analysis
- 11.2.5.4. Recent Developments
- 11.2.5.5. Financials (Based on Availability)
- 11.2.6 Sartorius AG
- 11.2.6.1. Overview
- 11.2.6.2. Products
- 11.2.6.3. SWOT Analysis
- 11.2.6.4. Recent Developments
- 11.2.6.5. Financials (Based on Availability)
- 11.2.7 Iuvo
- 11.2.7.1. Overview
- 11.2.7.2. Products
- 11.2.7.3. SWOT Analysis
- 11.2.7.4. Recent Developments
- 11.2.7.5. Financials (Based on Availability)
- 11.2.8 Microcoat
- 11.2.8.1. Overview
- 11.2.8.2. Products
- 11.2.8.3. SWOT Analysis
- 11.2.8.4. Recent Developments
- 11.2.8.5. Financials (Based on Availability)
- 11.2.9 Measurlabs
- 11.2.9.1. Overview
- 11.2.9.2. Products
- 11.2.9.3. SWOT Analysis
- 11.2.9.4. Recent Developments
- 11.2.9.5. Financials (Based on Availability)
- 11.2.10 Charles River
- 11.2.10.1. Overview
- 11.2.10.2. Products
- 11.2.10.3. SWOT Analysis
- 11.2.10.4. Recent Developments
- 11.2.10.5. Financials (Based on Availability)
- 11.2.11 TUV SUD
- 11.2.11.1. Overview
- 11.2.11.2. Products
- 11.2.11.3. SWOT Analysis
- 11.2.11.4. Recent Developments
- 11.2.11.5. Financials (Based on Availability)
- 11.2.12 MAT Research
- 11.2.12.1. Overview
- 11.2.12.2. Products
- 11.2.12.3. SWOT Analysis
- 11.2.12.4. Recent Developments
- 11.2.12.5. Financials (Based on Availability)
- 11.2.13 Ethide Labs
- 11.2.13.1. Overview
- 11.2.13.2. Products
- 11.2.13.3. SWOT Analysis
- 11.2.13.4. Recent Developments
- 11.2.13.5. Financials (Based on Availability)
- 11.2.14 Wickham Micro
- 11.2.14.1. Overview
- 11.2.14.2. Products
- 11.2.14.3. SWOT Analysis
- 11.2.14.4. Recent Developments
- 11.2.14.5. Financials (Based on Availability)
- 11.2.1 Eurofins
List of Figures
- Figure 1: Global Medical Device Pyrogenicity Testing Service Revenue Breakdown (million, %) by Region 2024 & 2032
- Figure 2: North America Medical Device Pyrogenicity Testing Service Revenue (million), by Application 2024 & 2032
- Figure 3: North America Medical Device Pyrogenicity Testing Service Revenue Share (%), by Application 2024 & 2032
- Figure 4: North America Medical Device Pyrogenicity Testing Service Revenue (million), by Types 2024 & 2032
- Figure 5: North America Medical Device Pyrogenicity Testing Service Revenue Share (%), by Types 2024 & 2032
- Figure 6: North America Medical Device Pyrogenicity Testing Service Revenue (million), by Country 2024 & 2032
- Figure 7: North America Medical Device Pyrogenicity Testing Service Revenue Share (%), by Country 2024 & 2032
- Figure 8: South America Medical Device Pyrogenicity Testing Service Revenue (million), by Application 2024 & 2032
- Figure 9: South America Medical Device Pyrogenicity Testing Service Revenue Share (%), by Application 2024 & 2032
- Figure 10: South America Medical Device Pyrogenicity Testing Service Revenue (million), by Types 2024 & 2032
- Figure 11: South America Medical Device Pyrogenicity Testing Service Revenue Share (%), by Types 2024 & 2032
- Figure 12: South America Medical Device Pyrogenicity Testing Service Revenue (million), by Country 2024 & 2032
- Figure 13: South America Medical Device Pyrogenicity Testing Service Revenue Share (%), by Country 2024 & 2032
- Figure 14: Europe Medical Device Pyrogenicity Testing Service Revenue (million), by Application 2024 & 2032
- Figure 15: Europe Medical Device Pyrogenicity Testing Service Revenue Share (%), by Application 2024 & 2032
- Figure 16: Europe Medical Device Pyrogenicity Testing Service Revenue (million), by Types 2024 & 2032
- Figure 17: Europe Medical Device Pyrogenicity Testing Service Revenue Share (%), by Types 2024 & 2032
- Figure 18: Europe Medical Device Pyrogenicity Testing Service Revenue (million), by Country 2024 & 2032
- Figure 19: Europe Medical Device Pyrogenicity Testing Service Revenue Share (%), by Country 2024 & 2032
- Figure 20: Middle East & Africa Medical Device Pyrogenicity Testing Service Revenue (million), by Application 2024 & 2032
- Figure 21: Middle East & Africa Medical Device Pyrogenicity Testing Service Revenue Share (%), by Application 2024 & 2032
- Figure 22: Middle East & Africa Medical Device Pyrogenicity Testing Service Revenue (million), by Types 2024 & 2032
- Figure 23: Middle East & Africa Medical Device Pyrogenicity Testing Service Revenue Share (%), by Types 2024 & 2032
- Figure 24: Middle East & Africa Medical Device Pyrogenicity Testing Service Revenue (million), by Country 2024 & 2032
- Figure 25: Middle East & Africa Medical Device Pyrogenicity Testing Service Revenue Share (%), by Country 2024 & 2032
- Figure 26: Asia Pacific Medical Device Pyrogenicity Testing Service Revenue (million), by Application 2024 & 2032
- Figure 27: Asia Pacific Medical Device Pyrogenicity Testing Service Revenue Share (%), by Application 2024 & 2032
- Figure 28: Asia Pacific Medical Device Pyrogenicity Testing Service Revenue (million), by Types 2024 & 2032
- Figure 29: Asia Pacific Medical Device Pyrogenicity Testing Service Revenue Share (%), by Types 2024 & 2032
- Figure 30: Asia Pacific Medical Device Pyrogenicity Testing Service Revenue (million), by Country 2024 & 2032
- Figure 31: Asia Pacific Medical Device Pyrogenicity Testing Service Revenue Share (%), by Country 2024 & 2032
List of Tables
- Table 1: Global Medical Device Pyrogenicity Testing Service Revenue million Forecast, by Region 2019 & 2032
- Table 2: Global Medical Device Pyrogenicity Testing Service Revenue million Forecast, by Application 2019 & 2032
- Table 3: Global Medical Device Pyrogenicity Testing Service Revenue million Forecast, by Types 2019 & 2032
- Table 4: Global Medical Device Pyrogenicity Testing Service Revenue million Forecast, by Region 2019 & 2032
- Table 5: Global Medical Device Pyrogenicity Testing Service Revenue million Forecast, by Application 2019 & 2032
- Table 6: Global Medical Device Pyrogenicity Testing Service Revenue million Forecast, by Types 2019 & 2032
- Table 7: Global Medical Device Pyrogenicity Testing Service Revenue million Forecast, by Country 2019 & 2032
- Table 8: United States Medical Device Pyrogenicity Testing Service Revenue (million) Forecast, by Application 2019 & 2032
- Table 9: Canada Medical Device Pyrogenicity Testing Service Revenue (million) Forecast, by Application 2019 & 2032
- Table 10: Mexico Medical Device Pyrogenicity Testing Service Revenue (million) Forecast, by Application 2019 & 2032
- Table 11: Global Medical Device Pyrogenicity Testing Service Revenue million Forecast, by Application 2019 & 2032
- Table 12: Global Medical Device Pyrogenicity Testing Service Revenue million Forecast, by Types 2019 & 2032
- Table 13: Global Medical Device Pyrogenicity Testing Service Revenue million Forecast, by Country 2019 & 2032
- Table 14: Brazil Medical Device Pyrogenicity Testing Service Revenue (million) Forecast, by Application 2019 & 2032
- Table 15: Argentina Medical Device Pyrogenicity Testing Service Revenue (million) Forecast, by Application 2019 & 2032
- Table 16: Rest of South America Medical Device Pyrogenicity Testing Service Revenue (million) Forecast, by Application 2019 & 2032
- Table 17: Global Medical Device Pyrogenicity Testing Service Revenue million Forecast, by Application 2019 & 2032
- Table 18: Global Medical Device Pyrogenicity Testing Service Revenue million Forecast, by Types 2019 & 2032
- Table 19: Global Medical Device Pyrogenicity Testing Service Revenue million Forecast, by Country 2019 & 2032
- Table 20: United Kingdom Medical Device Pyrogenicity Testing Service Revenue (million) Forecast, by Application 2019 & 2032
- Table 21: Germany Medical Device Pyrogenicity Testing Service Revenue (million) Forecast, by Application 2019 & 2032
- Table 22: France Medical Device Pyrogenicity Testing Service Revenue (million) Forecast, by Application 2019 & 2032
- Table 23: Italy Medical Device Pyrogenicity Testing Service Revenue (million) Forecast, by Application 2019 & 2032
- Table 24: Spain Medical Device Pyrogenicity Testing Service Revenue (million) Forecast, by Application 2019 & 2032
- Table 25: Russia Medical Device Pyrogenicity Testing Service Revenue (million) Forecast, by Application 2019 & 2032
- Table 26: Benelux Medical Device Pyrogenicity Testing Service Revenue (million) Forecast, by Application 2019 & 2032
- Table 27: Nordics Medical Device Pyrogenicity Testing Service Revenue (million) Forecast, by Application 2019 & 2032
- Table 28: Rest of Europe Medical Device Pyrogenicity Testing Service Revenue (million) Forecast, by Application 2019 & 2032
- Table 29: Global Medical Device Pyrogenicity Testing Service Revenue million Forecast, by Application 2019 & 2032
- Table 30: Global Medical Device Pyrogenicity Testing Service Revenue million Forecast, by Types 2019 & 2032
- Table 31: Global Medical Device Pyrogenicity Testing Service Revenue million Forecast, by Country 2019 & 2032
- Table 32: Turkey Medical Device Pyrogenicity Testing Service Revenue (million) Forecast, by Application 2019 & 2032
- Table 33: Israel Medical Device Pyrogenicity Testing Service Revenue (million) Forecast, by Application 2019 & 2032
- Table 34: GCC Medical Device Pyrogenicity Testing Service Revenue (million) Forecast, by Application 2019 & 2032
- Table 35: North Africa Medical Device Pyrogenicity Testing Service Revenue (million) Forecast, by Application 2019 & 2032
- Table 36: South Africa Medical Device Pyrogenicity Testing Service Revenue (million) Forecast, by Application 2019 & 2032
- Table 37: Rest of Middle East & Africa Medical Device Pyrogenicity Testing Service Revenue (million) Forecast, by Application 2019 & 2032
- Table 38: Global Medical Device Pyrogenicity Testing Service Revenue million Forecast, by Application 2019 & 2032
- Table 39: Global Medical Device Pyrogenicity Testing Service Revenue million Forecast, by Types 2019 & 2032
- Table 40: Global Medical Device Pyrogenicity Testing Service Revenue million Forecast, by Country 2019 & 2032
- Table 41: China Medical Device Pyrogenicity Testing Service Revenue (million) Forecast, by Application 2019 & 2032
- Table 42: India Medical Device Pyrogenicity Testing Service Revenue (million) Forecast, by Application 2019 & 2032
- Table 43: Japan Medical Device Pyrogenicity Testing Service Revenue (million) Forecast, by Application 2019 & 2032
- Table 44: South Korea Medical Device Pyrogenicity Testing Service Revenue (million) Forecast, by Application 2019 & 2032
- Table 45: ASEAN Medical Device Pyrogenicity Testing Service Revenue (million) Forecast, by Application 2019 & 2032
- Table 46: Oceania Medical Device Pyrogenicity Testing Service Revenue (million) Forecast, by Application 2019 & 2032
- Table 47: Rest of Asia Pacific Medical Device Pyrogenicity Testing Service Revenue (million) Forecast, by Application 2019 & 2032
Frequently Asked Questions
1. What is the projected Compound Annual Growth Rate (CAGR) of the Medical Device Pyrogenicity Testing Service?
The projected CAGR is approximately XX%.
2. Which companies are prominent players in the Medical Device Pyrogenicity Testing Service?
Key companies in the market include Eurofins, Nelson Laboratories, Pacific BioLabs, GenScript, SGS, Sartorius AG, Iuvo, Microcoat, Measurlabs, Charles River, TUV SUD, MAT Research, Ethide Labs, Wickham Micro.
3. What are the main segments of the Medical Device Pyrogenicity Testing Service?
The market segments include Application, Types.
4. Can you provide details about the market size?
The market size is estimated to be USD XXX million as of 2022.
5. What are some drivers contributing to market growth?
N/A
6. What are the notable trends driving market growth?
N/A
7. Are there any restraints impacting market growth?
N/A
8. Can you provide examples of recent developments in the market?
N/A
9. What pricing options are available for accessing the report?
Pricing options include single-user, multi-user, and enterprise licenses priced at USD 4350.00, USD 6525.00, and USD 8700.00 respectively.
10. Is the market size provided in terms of value or volume?
The market size is provided in terms of value, measured in million.
11. Are there any specific market keywords associated with the report?
Yes, the market keyword associated with the report is "Medical Device Pyrogenicity Testing Service," which aids in identifying and referencing the specific market segment covered.
12. How do I determine which pricing option suits my needs best?
The pricing options vary based on user requirements and access needs. Individual users may opt for single-user licenses, while businesses requiring broader access may choose multi-user or enterprise licenses for cost-effective access to the report.
13. Are there any additional resources or data provided in the Medical Device Pyrogenicity Testing Service report?
While the report offers comprehensive insights, it's advisable to review the specific contents or supplementary materials provided to ascertain if additional resources or data are available.
14. How can I stay updated on further developments or reports in the Medical Device Pyrogenicity Testing Service?
To stay informed about further developments, trends, and reports in the Medical Device Pyrogenicity Testing Service, consider subscribing to industry newsletters, following relevant companies and organizations, or regularly checking reputable industry news sources and publications.
Methodology
Step 1 - Identification of Relevant Samples Size from Population Database


Step 2 - Approaches for Defining Global Market Size (Value, Volume* & Price*)

Note*: In applicable scenarios
Step 3 - Data Sources
Primary Research
- Web Analytics
- Survey Reports
- Research Institute
- Latest Research Reports
- Opinion Leaders
Secondary Research
- Annual Reports
- White Paper
- Latest Press Release
- Industry Association
- Paid Database
- Investor Presentations

Step 4 - Data Triangulation
Involves using different sources of information in order to increase the validity of a study
These sources are likely to be stakeholders in a program - participants, other researchers, program staff, other community members, and so on.
Then we put all data in single framework & apply various statistical tools to find out the dynamic on the market.
During the analysis stage, feedback from the stakeholder groups would be compared to determine areas of agreement as well as areas of divergence
