

Key Insights
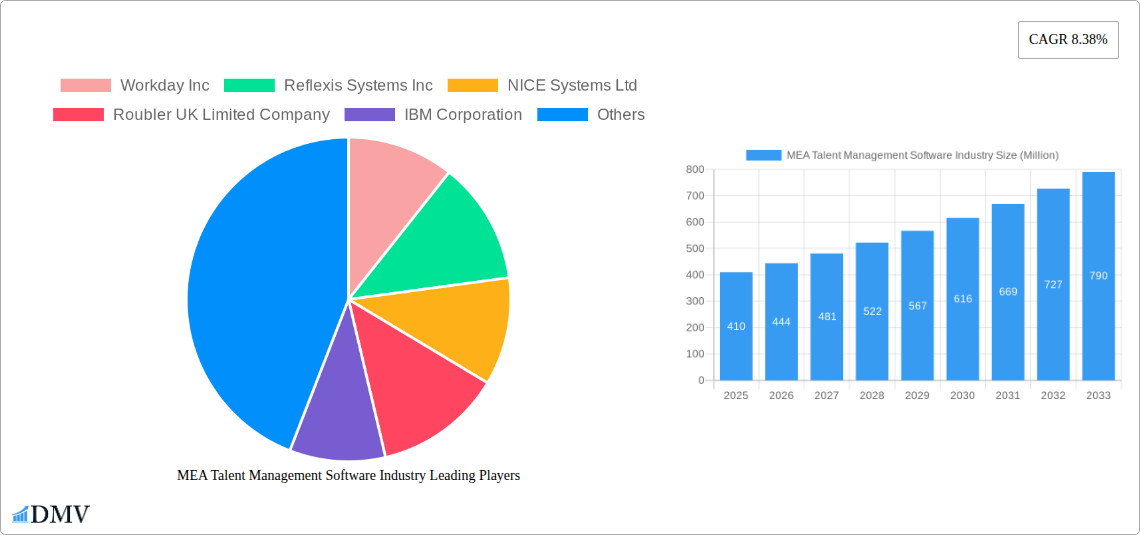
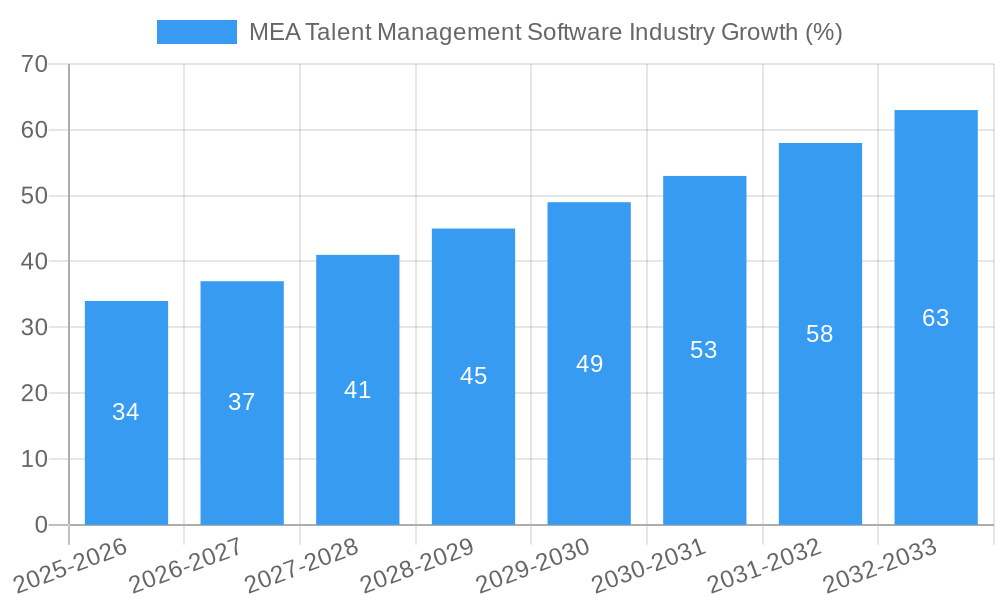
The Middle East and Africa (MEA) Talent Management Software market, currently valued at $410 million (based on a 0.41 billion market size in 2025), is experiencing robust growth, projected to expand at a Compound Annual Growth Rate (CAGR) of 8.38% from 2025 to 2033. This growth is fueled by several key drivers. The increasing adoption of cloud-based solutions offers scalability and cost-effectiveness, particularly appealing to businesses of all sizes across diverse sectors like BFSI, retail, and manufacturing. Furthermore, the rising need for improved workforce productivity and enhanced employee engagement is driving demand for advanced features like workforce analytics and performance management tools. Government initiatives focused on digital transformation across the region also contribute to market expansion. However, challenges remain, including the need for robust cybersecurity measures to protect sensitive employee data and a potential skills gap in implementing and managing these complex software systems. The market segmentation reveals a strong preference for cloud deployment models, underscoring the trend towards flexible and accessible solutions. The diverse range of software functionalities, from scheduling and analytics to performance management and absence tracking, caters to the varied needs of businesses operating within the MEA region.
The competitive landscape is characterized by a mix of global giants like Workday, IBM, and SAP, alongside regional players and specialized providers. This dynamic competition fosters innovation and ensures a diverse range of solutions are available. Growth is expected to be particularly strong in countries like the United Arab Emirates and Saudi Arabia, driven by substantial investments in digital infrastructure and a growing focus on human capital development. South Africa, while having a smaller market share currently, presents a significant growth opportunity due to its evolving technological landscape and increasing adoption of talent management technologies. The forecast period (2025-2033) suggests continued market expansion, driven by the ongoing digital transformation efforts and the increasing awareness of the strategic importance of effective talent management for sustained business success in the MEA region. Future growth will likely depend on addressing the aforementioned challenges and adapting to the evolving technological landscape of the region.
MEA Talent Management Software Industry Market Report: 2019-2033
This comprehensive report provides a detailed analysis of the Middle East and Africa (MEA) talent management software industry, offering invaluable insights for stakeholders seeking to navigate this rapidly evolving market. With a study period spanning 2019-2033, a base year of 2025, and a forecast period of 2025-2033, this report offers a robust understanding of historical trends and future projections. The market size in 2025 is estimated at $XX Million.
MEA Talent Management Software Industry Market Composition & Trends
The MEA talent management software market is characterized by a moderately concentrated landscape, with key players like Workday Inc, IBM Corporation, and Oracle Corporation holding significant market share. However, the emergence of niche players and innovative solutions is fostering increased competition. Market share distribution in 2025 is estimated as follows: Workday Inc (15%), IBM Corporation (12%), Oracle Corporation (10%), and others (63%). The market is driven by increasing adoption of cloud-based solutions, growing demand for workforce analytics, and stringent regulatory compliance requirements across various sectors.
- Market Concentration: Moderately concentrated, with top players holding a significant, yet not dominant, share.
- Innovation Catalysts: Growing demand for AI-powered solutions, improved data analytics capabilities, and mobile-first accessibility.
- Regulatory Landscape: Varying data privacy regulations across MEA countries influence software adoption and vendor strategies.
- Substitute Products: Traditional HR management methods and spreadsheet-based solutions still exist but are gradually being replaced.
- End-User Profiles: The market caters to a wide range of end-user verticals, including BFSI, retail, manufacturing, and healthcare.
- M&A Activities: The past five years have seen $XX Million in M&A deals, with a focus on expanding capabilities and market reach. Examples include [insert specific examples if available, otherwise use "strategic acquisitions by major players to enhance their product portfolios and geographic presence"].
MEA Talent Management Software Industry Industry Evolution
The MEA talent management software market has witnessed significant growth over the historical period (2019-2024), experiencing a Compound Annual Growth Rate (CAGR) of XX%. This growth is primarily attributed to the increasing adoption of cloud-based solutions, the rising demand for advanced analytics, and a growing need for efficient workforce management in organizations across the region. Technological advancements, such as the integration of artificial intelligence (AI) and machine learning (ML) for predictive analytics and automated processes, have significantly impacted market dynamics. Shifting consumer demands toward user-friendly interfaces and mobile accessibility further fuel market growth. The forecast period (2025-2033) projects continued expansion, with a projected CAGR of XX%, driven by increasing digital transformation initiatives within organizations and the growing awareness of the value of data-driven workforce management. The adoption rate of cloud-based solutions is expected to increase from XX% in 2024 to XX% in 2033.
Leading Regions, Countries, or Segments in MEA Talent Management Software Industry
- By Type: Workforce Scheduling and Workforce Analytics segment is currently leading, driven by the need for optimized resource allocation and data-driven decision-making. Time and Attendance Management also shows strong growth due to increasing regulatory compliance requirements.
- By Deployment Mode: Cloud-based deployment is the dominant segment due to scalability, cost-effectiveness, and accessibility advantages.
- By End-user Vertical: BFSI and Consumer Goods and Retail sectors are major adopters, due to their large workforces and complex operational requirements.
- By Country: The United Arab Emirates and Saudi Arabia are leading markets, driven by significant investments in digital transformation and a burgeoning economy.
Key Drivers:
- UAE & Saudi Arabia: Significant government investments in digital infrastructure and initiatives promoting digital transformation in the private sector.
- South Africa: Growing focus on improving workforce productivity and efficiency across various industries.
- Rest of MEA: Increasing adoption of technology across various sectors, including healthcare and manufacturing.
The dominance of these segments and regions is attributable to a combination of factors, including robust economic growth, supportive regulatory environments, and a rising focus on enhancing operational efficiencies through technology adoption.
MEA Talent Management Software Industry Product Innovations
Recent innovations focus on AI-powered predictive analytics for workforce planning, integrated platforms combining multiple HR functions, and mobile-first solutions improving accessibility and employee engagement. These advancements offer unique selling propositions such as improved forecasting accuracy, reduced administrative burden, and enhanced employee self-service capabilities. The integration of blockchain technology for secure data management and improved compliance is also emerging as a key innovation driver.
Propelling Factors for MEA Talent Management Software Industry Growth
Technological advancements, particularly AI and ML, are revolutionizing workforce management, leading to increased efficiency and data-driven decision-making. Economic growth across the MEA region fuels investment in technology upgrades and improves the adoption of software solutions. Furthermore, regulatory compliance requirements across various sectors mandate the adoption of sophisticated talent management systems.
Obstacles in the MEA Talent Management Software Industry Market
High implementation costs, lack of skilled IT professionals to manage complex systems, and cybersecurity concerns act as significant barriers to market growth. Furthermore, the lack of digital infrastructure in certain regions hinders the adoption of cloud-based solutions. Supply chain disruptions and fluctuating currency exchange rates also pose challenges for vendors operating within the region.
Future Opportunities in MEA Talent Management Software Industry
The expanding SME sector presents a significant growth opportunity. The adoption of emerging technologies such as extended reality (XR) and the metaverse for training and development offers potential for innovative solutions. Furthermore, a focus on personalized employee experiences and data privacy solutions will shape future market development.
Major Players in the MEA Talent Management Software Industry Ecosystem
- Workday Inc
- Reflexis Systems Inc
- NICE Systems Ltd
- Roubler UK Limited Company
- IBM Corporation
- Blue Yonder Group Inc
- Active Operations Management International LLP
- Sage Group PLC
- Kronos Incorporated (UKG Inc)
- 7shifts
- ServiceMax Inc
- Infor Group
- Atoss Software AG
- Oracle Corporation
- ADP LLC
- Tamigo UK Ltd
- SISQUAL
- WorkForce Software LLC
- SAP SE
- Mitrefinch Ltd
- Kirona Solutions Limited
Key Developments in MEA Talent Management Software Industry Industry
- October 2022: Darwinbox expands its MEA presence by opening an office in Dubai, strengthening its market reach.
- January 2023: BrightPlan launches a workforce financial wellness gauge, providing data-driven insights to organizations in the MEA region. This highlights the growing demand for holistic employee well-being solutions.
Strategic MEA Talent Management Software Industry Market Forecast
The MEA talent management software market is poised for robust growth, driven by increasing digitization, rising demand for data-driven insights, and government initiatives promoting digital transformation. The market's future potential is substantial, with ongoing technological advancements and a growing awareness of the strategic value of effective talent management creating a fertile ground for expansion. The projected CAGR of XX% for the forecast period signifies significant growth opportunities for both established players and new entrants.
MEA Talent Management Software Industry Segmentation
-
1. Type
- 1.1. Workforce Scheduling and Workforce Analytics
- 1.2. Time and Attendance Management
- 1.3. Performance and Goal Management
- 1.4. Absence and Leave Management
- 1.5. Other So
-
2. Deployment Mode
- 2.1. On-premise
- 2.2. Cloud
-
3. End-user Vertical
- 3.1. BFSI
- 3.2. Consumer Goods and Retail
- 3.3. Automotive
- 3.4. Energy and Utilities
- 3.5. Healthcare
- 3.6. Manufacturing
- 3.7. Other End-user Verticals
MEA Talent Management Software Industry Segmentation By Geography
-
1. North America
- 1.1. United States
- 1.2. Canada
- 1.3. Mexico
-
2. South America
- 2.1. Brazil
- 2.2. Argentina
- 2.3. Rest of South America
-
3. Europe
- 3.1. United Kingdom
- 3.2. Germany
- 3.3. France
- 3.4. Italy
- 3.5. Spain
- 3.6. Russia
- 3.7. Benelux
- 3.8. Nordics
- 3.9. Rest of Europe
-
4. Middle East & Africa
- 4.1. Turkey
- 4.2. Israel
- 4.3. GCC
- 4.4. North Africa
- 4.5. South Africa
- 4.6. Rest of Middle East & Africa
-
5. Asia Pacific
- 5.1. China
- 5.2. India
- 5.3. Japan
- 5.4. South Korea
- 5.5. ASEAN
- 5.6. Oceania
- 5.7. Rest of Asia Pacific
MEA Talent Management Software Industry REPORT HIGHLIGHTS
| Aspects | Details |
|---|---|
| Study Period | 2019-2033 |
| Base Year | 2024 |
| Estimated Year | 2025 |
| Forecast Period | 2025-2033 |
| Historical Period | 2019-2024 |
| Growth Rate | CAGR of 8.38% from 2019-2033 |
| Segmentation |
|
Table of Contents
- 1. Introduction
- 1.1. Research Scope
- 1.2. Market Segmentation
- 1.3. Research Methodology
- 1.4. Definitions and Assumptions
- 2. Executive Summary
- 2.1. Introduction
- 3. Market Dynamics
- 3.1. Introduction
- 3.2. Market Drivers
- 3.2.1. Increasing Adoption of Internet of Things (IoT) and Cloud-based Solutions Expanding the Market; Growing Adoption of Analytical Solutions and WFM by SMEs Driving Market Growth
- 3.3. Market Restrains
- 3.3.1. ; Availability of open-source alternatives
- 3.4. Market Trends
- 3.4.1. Workforce Scheduling and Workforce Analytics Type is Expected to Hold Significant Market Share
- 4. Market Factor Analysis
- 4.1. Porters Five Forces
- 4.2. Supply/Value Chain
- 4.3. PESTEL analysis
- 4.4. Market Entropy
- 4.5. Patent/Trademark Analysis
- 5. Global MEA Talent Management Software Industry Analysis, Insights and Forecast, 2019-2031
- 5.1. Market Analysis, Insights and Forecast - by Type
- 5.1.1. Workforce Scheduling and Workforce Analytics
- 5.1.2. Time and Attendance Management
- 5.1.3. Performance and Goal Management
- 5.1.4. Absence and Leave Management
- 5.1.5. Other So
- 5.2. Market Analysis, Insights and Forecast - by Deployment Mode
- 5.2.1. On-premise
- 5.2.2. Cloud
- 5.3. Market Analysis, Insights and Forecast - by End-user Vertical
- 5.3.1. BFSI
- 5.3.2. Consumer Goods and Retail
- 5.3.3. Automotive
- 5.3.4. Energy and Utilities
- 5.3.5. Healthcare
- 5.3.6. Manufacturing
- 5.3.7. Other End-user Verticals
- 5.4. Market Analysis, Insights and Forecast - by Region
- 5.4.1. North America
- 5.4.2. South America
- 5.4.3. Europe
- 5.4.4. Middle East & Africa
- 5.4.5. Asia Pacific
- 5.1. Market Analysis, Insights and Forecast - by Type
- 6. North America MEA Talent Management Software Industry Analysis, Insights and Forecast, 2019-2031
- 6.1. Market Analysis, Insights and Forecast - by Type
- 6.1.1. Workforce Scheduling and Workforce Analytics
- 6.1.2. Time and Attendance Management
- 6.1.3. Performance and Goal Management
- 6.1.4. Absence and Leave Management
- 6.1.5. Other So
- 6.2. Market Analysis, Insights and Forecast - by Deployment Mode
- 6.2.1. On-premise
- 6.2.2. Cloud
- 6.3. Market Analysis, Insights and Forecast - by End-user Vertical
- 6.3.1. BFSI
- 6.3.2. Consumer Goods and Retail
- 6.3.3. Automotive
- 6.3.4. Energy and Utilities
- 6.3.5. Healthcare
- 6.3.6. Manufacturing
- 6.3.7. Other End-user Verticals
- 6.1. Market Analysis, Insights and Forecast - by Type
- 7. South America MEA Talent Management Software Industry Analysis, Insights and Forecast, 2019-2031
- 7.1. Market Analysis, Insights and Forecast - by Type
- 7.1.1. Workforce Scheduling and Workforce Analytics
- 7.1.2. Time and Attendance Management
- 7.1.3. Performance and Goal Management
- 7.1.4. Absence and Leave Management
- 7.1.5. Other So
- 7.2. Market Analysis, Insights and Forecast - by Deployment Mode
- 7.2.1. On-premise
- 7.2.2. Cloud
- 7.3. Market Analysis, Insights and Forecast - by End-user Vertical
- 7.3.1. BFSI
- 7.3.2. Consumer Goods and Retail
- 7.3.3. Automotive
- 7.3.4. Energy and Utilities
- 7.3.5. Healthcare
- 7.3.6. Manufacturing
- 7.3.7. Other End-user Verticals
- 7.1. Market Analysis, Insights and Forecast - by Type
- 8. Europe MEA Talent Management Software Industry Analysis, Insights and Forecast, 2019-2031
- 8.1. Market Analysis, Insights and Forecast - by Type
- 8.1.1. Workforce Scheduling and Workforce Analytics
- 8.1.2. Time and Attendance Management
- 8.1.3. Performance and Goal Management
- 8.1.4. Absence and Leave Management
- 8.1.5. Other So
- 8.2. Market Analysis, Insights and Forecast - by Deployment Mode
- 8.2.1. On-premise
- 8.2.2. Cloud
- 8.3. Market Analysis, Insights and Forecast - by End-user Vertical
- 8.3.1. BFSI
- 8.3.2. Consumer Goods and Retail
- 8.3.3. Automotive
- 8.3.4. Energy and Utilities
- 8.3.5. Healthcare
- 8.3.6. Manufacturing
- 8.3.7. Other End-user Verticals
- 8.1. Market Analysis, Insights and Forecast - by Type
- 9. Middle East & Africa MEA Talent Management Software Industry Analysis, Insights and Forecast, 2019-2031
- 9.1. Market Analysis, Insights and Forecast - by Type
- 9.1.1. Workforce Scheduling and Workforce Analytics
- 9.1.2. Time and Attendance Management
- 9.1.3. Performance and Goal Management
- 9.1.4. Absence and Leave Management
- 9.1.5. Other So
- 9.2. Market Analysis, Insights and Forecast - by Deployment Mode
- 9.2.1. On-premise
- 9.2.2. Cloud
- 9.3. Market Analysis, Insights and Forecast - by End-user Vertical
- 9.3.1. BFSI
- 9.3.2. Consumer Goods and Retail
- 9.3.3. Automotive
- 9.3.4. Energy and Utilities
- 9.3.5. Healthcare
- 9.3.6. Manufacturing
- 9.3.7. Other End-user Verticals
- 9.1. Market Analysis, Insights and Forecast - by Type
- 10. Asia Pacific MEA Talent Management Software Industry Analysis, Insights and Forecast, 2019-2031
- 10.1. Market Analysis, Insights and Forecast - by Type
- 10.1.1. Workforce Scheduling and Workforce Analytics
- 10.1.2. Time and Attendance Management
- 10.1.3. Performance and Goal Management
- 10.1.4. Absence and Leave Management
- 10.1.5. Other So
- 10.2. Market Analysis, Insights and Forecast - by Deployment Mode
- 10.2.1. On-premise
- 10.2.2. Cloud
- 10.3. Market Analysis, Insights and Forecast - by End-user Vertical
- 10.3.1. BFSI
- 10.3.2. Consumer Goods and Retail
- 10.3.3. Automotive
- 10.3.4. Energy and Utilities
- 10.3.5. Healthcare
- 10.3.6. Manufacturing
- 10.3.7. Other End-user Verticals
- 10.1. Market Analysis, Insights and Forecast - by Type
- 11. North America MEA Talent Management Software Industry Analysis, Insights and Forecast, 2019-2031
- 11.1. Market Analysis, Insights and Forecast - By Country/Sub-region
- 11.1.1.
- 12. Europe MEA Talent Management Software Industry Analysis, Insights and Forecast, 2019-2031
- 12.1. Market Analysis, Insights and Forecast - By Country/Sub-region
- 12.1.1.
- 13. Asia Pacific MEA Talent Management Software Industry Analysis, Insights and Forecast, 2019-2031
- 13.1. Market Analysis, Insights and Forecast - By Country/Sub-region
- 13.1.1.
- 14. Latin America MEA Talent Management Software Industry Analysis, Insights and Forecast, 2019-2031
- 14.1. Market Analysis, Insights and Forecast - By Country/Sub-region
- 14.1.1.
- 15. Middle East MEA Talent Management Software Industry Analysis, Insights and Forecast, 2019-2031
- 15.1. Market Analysis, Insights and Forecast - By Country/Sub-region
- 15.1.1.
- 16. Competitive Analysis
- 16.1. Global Market Share Analysis 2024
- 16.2. Company Profiles
- 16.2.1 Workday Inc
- 16.2.1.1. Overview
- 16.2.1.2. Products
- 16.2.1.3. SWOT Analysis
- 16.2.1.4. Recent Developments
- 16.2.1.5. Financials (Based on Availability)
- 16.2.2 Reflexis Systems Inc
- 16.2.2.1. Overview
- 16.2.2.2. Products
- 16.2.2.3. SWOT Analysis
- 16.2.2.4. Recent Developments
- 16.2.2.5. Financials (Based on Availability)
- 16.2.3 NICE Systems Ltd
- 16.2.3.1. Overview
- 16.2.3.2. Products
- 16.2.3.3. SWOT Analysis
- 16.2.3.4. Recent Developments
- 16.2.3.5. Financials (Based on Availability)
- 16.2.4 Roubler UK Limited Company
- 16.2.4.1. Overview
- 16.2.4.2. Products
- 16.2.4.3. SWOT Analysis
- 16.2.4.4. Recent Developments
- 16.2.4.5. Financials (Based on Availability)
- 16.2.5 IBM Corporation
- 16.2.5.1. Overview
- 16.2.5.2. Products
- 16.2.5.3. SWOT Analysis
- 16.2.5.4. Recent Developments
- 16.2.5.5. Financials (Based on Availability)
- 16.2.6 Blue Yonder Group Inc
- 16.2.6.1. Overview
- 16.2.6.2. Products
- 16.2.6.3. SWOT Analysis
- 16.2.6.4. Recent Developments
- 16.2.6.5. Financials (Based on Availability)
- 16.2.7 Active Operations Management International LLP
- 16.2.7.1. Overview
- 16.2.7.2. Products
- 16.2.7.3. SWOT Analysis
- 16.2.7.4. Recent Developments
- 16.2.7.5. Financials (Based on Availability)
- 16.2.8 Sage Group PLC
- 16.2.8.1. Overview
- 16.2.8.2. Products
- 16.2.8.3. SWOT Analysis
- 16.2.8.4. Recent Developments
- 16.2.8.5. Financials (Based on Availability)
- 16.2.9 Kronos Incorporated (UKG Inc )
- 16.2.9.1. Overview
- 16.2.9.2. Products
- 16.2.9.3. SWOT Analysis
- 16.2.9.4. Recent Developments
- 16.2.9.5. Financials (Based on Availability)
- 16.2.10 7shifts
- 16.2.10.1. Overview
- 16.2.10.2. Products
- 16.2.10.3. SWOT Analysis
- 16.2.10.4. Recent Developments
- 16.2.10.5. Financials (Based on Availability)
- 16.2.11 ServiceMax Inc
- 16.2.11.1. Overview
- 16.2.11.2. Products
- 16.2.11.3. SWOT Analysis
- 16.2.11.4. Recent Developments
- 16.2.11.5. Financials (Based on Availability)
- 16.2.12 Infor Group
- 16.2.12.1. Overview
- 16.2.12.2. Products
- 16.2.12.3. SWOT Analysis
- 16.2.12.4. Recent Developments
- 16.2.12.5. Financials (Based on Availability)
- 16.2.13 Atoss Software AG
- 16.2.13.1. Overview
- 16.2.13.2. Products
- 16.2.13.3. SWOT Analysis
- 16.2.13.4. Recent Developments
- 16.2.13.5. Financials (Based on Availability)
- 16.2.14 Oracle Corporation
- 16.2.14.1. Overview
- 16.2.14.2. Products
- 16.2.14.3. SWOT Analysis
- 16.2.14.4. Recent Developments
- 16.2.14.5. Financials (Based on Availability)
- 16.2.15 ADP LLC
- 16.2.15.1. Overview
- 16.2.15.2. Products
- 16.2.15.3. SWOT Analysis
- 16.2.15.4. Recent Developments
- 16.2.15.5. Financials (Based on Availability)
- 16.2.16 Tamigo UK Ltd
- 16.2.16.1. Overview
- 16.2.16.2. Products
- 16.2.16.3. SWOT Analysis
- 16.2.16.4. Recent Developments
- 16.2.16.5. Financials (Based on Availability)
- 16.2.17 SISQUAL
- 16.2.17.1. Overview
- 16.2.17.2. Products
- 16.2.17.3. SWOT Analysis
- 16.2.17.4. Recent Developments
- 16.2.17.5. Financials (Based on Availability)
- 16.2.18 WorkForce Software LLC
- 16.2.18.1. Overview
- 16.2.18.2. Products
- 16.2.18.3. SWOT Analysis
- 16.2.18.4. Recent Developments
- 16.2.18.5. Financials (Based on Availability)
- 16.2.19 SAP SE
- 16.2.19.1. Overview
- 16.2.19.2. Products
- 16.2.19.3. SWOT Analysis
- 16.2.19.4. Recent Developments
- 16.2.19.5. Financials (Based on Availability)
- 16.2.20 Mitrefinch Ltd
- 16.2.20.1. Overview
- 16.2.20.2. Products
- 16.2.20.3. SWOT Analysis
- 16.2.20.4. Recent Developments
- 16.2.20.5. Financials (Based on Availability)
- 16.2.21 Kirona Solutions Limited
- 16.2.21.1. Overview
- 16.2.21.2. Products
- 16.2.21.3. SWOT Analysis
- 16.2.21.4. Recent Developments
- 16.2.21.5. Financials (Based on Availability)
- 16.2.1 Workday Inc
List of Figures
- Figure 1: Global MEA Talent Management Software Industry Revenue Breakdown (Million, %) by Region 2024 & 2032
- Figure 2: Global MEA Talent Management Software Industry Volume Breakdown (K Unit, %) by Region 2024 & 2032
- Figure 3: North America MEA Talent Management Software Industry Revenue (Million), by Country 2024 & 2032
- Figure 4: North America MEA Talent Management Software Industry Volume (K Unit), by Country 2024 & 2032
- Figure 5: North America MEA Talent Management Software Industry Revenue Share (%), by Country 2024 & 2032
- Figure 6: North America MEA Talent Management Software Industry Volume Share (%), by Country 2024 & 2032
- Figure 7: Europe MEA Talent Management Software Industry Revenue (Million), by Country 2024 & 2032
- Figure 8: Europe MEA Talent Management Software Industry Volume (K Unit), by Country 2024 & 2032
- Figure 9: Europe MEA Talent Management Software Industry Revenue Share (%), by Country 2024 & 2032
- Figure 10: Europe MEA Talent Management Software Industry Volume Share (%), by Country 2024 & 2032
- Figure 11: Asia Pacific MEA Talent Management Software Industry Revenue (Million), by Country 2024 & 2032
- Figure 12: Asia Pacific MEA Talent Management Software Industry Volume (K Unit), by Country 2024 & 2032
- Figure 13: Asia Pacific MEA Talent Management Software Industry Revenue Share (%), by Country 2024 & 2032
- Figure 14: Asia Pacific MEA Talent Management Software Industry Volume Share (%), by Country 2024 & 2032
- Figure 15: Latin America MEA Talent Management Software Industry Revenue (Million), by Country 2024 & 2032
- Figure 16: Latin America MEA Talent Management Software Industry Volume (K Unit), by Country 2024 & 2032
- Figure 17: Latin America MEA Talent Management Software Industry Revenue Share (%), by Country 2024 & 2032
- Figure 18: Latin America MEA Talent Management Software Industry Volume Share (%), by Country 2024 & 2032
- Figure 19: Middle East MEA Talent Management Software Industry Revenue (Million), by Country 2024 & 2032
- Figure 20: Middle East MEA Talent Management Software Industry Volume (K Unit), by Country 2024 & 2032
- Figure 21: Middle East MEA Talent Management Software Industry Revenue Share (%), by Country 2024 & 2032
- Figure 22: Middle East MEA Talent Management Software Industry Volume Share (%), by Country 2024 & 2032
- Figure 23: North America MEA Talent Management Software Industry Revenue (Million), by Type 2024 & 2032
- Figure 24: North America MEA Talent Management Software Industry Volume (K Unit), by Type 2024 & 2032
- Figure 25: North America MEA Talent Management Software Industry Revenue Share (%), by Type 2024 & 2032
- Figure 26: North America MEA Talent Management Software Industry Volume Share (%), by Type 2024 & 2032
- Figure 27: North America MEA Talent Management Software Industry Revenue (Million), by Deployment Mode 2024 & 2032
- Figure 28: North America MEA Talent Management Software Industry Volume (K Unit), by Deployment Mode 2024 & 2032
- Figure 29: North America MEA Talent Management Software Industry Revenue Share (%), by Deployment Mode 2024 & 2032
- Figure 30: North America MEA Talent Management Software Industry Volume Share (%), by Deployment Mode 2024 & 2032
- Figure 31: North America MEA Talent Management Software Industry Revenue (Million), by End-user Vertical 2024 & 2032
- Figure 32: North America MEA Talent Management Software Industry Volume (K Unit), by End-user Vertical 2024 & 2032
- Figure 33: North America MEA Talent Management Software Industry Revenue Share (%), by End-user Vertical 2024 & 2032
- Figure 34: North America MEA Talent Management Software Industry Volume Share (%), by End-user Vertical 2024 & 2032
- Figure 35: North America MEA Talent Management Software Industry Revenue (Million), by Country 2024 & 2032
- Figure 36: North America MEA Talent Management Software Industry Volume (K Unit), by Country 2024 & 2032
- Figure 37: North America MEA Talent Management Software Industry Revenue Share (%), by Country 2024 & 2032
- Figure 38: North America MEA Talent Management Software Industry Volume Share (%), by Country 2024 & 2032
- Figure 39: South America MEA Talent Management Software Industry Revenue (Million), by Type 2024 & 2032
- Figure 40: South America MEA Talent Management Software Industry Volume (K Unit), by Type 2024 & 2032
- Figure 41: South America MEA Talent Management Software Industry Revenue Share (%), by Type 2024 & 2032
- Figure 42: South America MEA Talent Management Software Industry Volume Share (%), by Type 2024 & 2032
- Figure 43: South America MEA Talent Management Software Industry Revenue (Million), by Deployment Mode 2024 & 2032
- Figure 44: South America MEA Talent Management Software Industry Volume (K Unit), by Deployment Mode 2024 & 2032
- Figure 45: South America MEA Talent Management Software Industry Revenue Share (%), by Deployment Mode 2024 & 2032
- Figure 46: South America MEA Talent Management Software Industry Volume Share (%), by Deployment Mode 2024 & 2032
- Figure 47: South America MEA Talent Management Software Industry Revenue (Million), by End-user Vertical 2024 & 2032
- Figure 48: South America MEA Talent Management Software Industry Volume (K Unit), by End-user Vertical 2024 & 2032
- Figure 49: South America MEA Talent Management Software Industry Revenue Share (%), by End-user Vertical 2024 & 2032
- Figure 50: South America MEA Talent Management Software Industry Volume Share (%), by End-user Vertical 2024 & 2032
- Figure 51: South America MEA Talent Management Software Industry Revenue (Million), by Country 2024 & 2032
- Figure 52: South America MEA Talent Management Software Industry Volume (K Unit), by Country 2024 & 2032
- Figure 53: South America MEA Talent Management Software Industry Revenue Share (%), by Country 2024 & 2032
- Figure 54: South America MEA Talent Management Software Industry Volume Share (%), by Country 2024 & 2032
- Figure 55: Europe MEA Talent Management Software Industry Revenue (Million), by Type 2024 & 2032
- Figure 56: Europe MEA Talent Management Software Industry Volume (K Unit), by Type 2024 & 2032
- Figure 57: Europe MEA Talent Management Software Industry Revenue Share (%), by Type 2024 & 2032
- Figure 58: Europe MEA Talent Management Software Industry Volume Share (%), by Type 2024 & 2032
- Figure 59: Europe MEA Talent Management Software Industry Revenue (Million), by Deployment Mode 2024 & 2032
- Figure 60: Europe MEA Talent Management Software Industry Volume (K Unit), by Deployment Mode 2024 & 2032
- Figure 61: Europe MEA Talent Management Software Industry Revenue Share (%), by Deployment Mode 2024 & 2032
- Figure 62: Europe MEA Talent Management Software Industry Volume Share (%), by Deployment Mode 2024 & 2032
- Figure 63: Europe MEA Talent Management Software Industry Revenue (Million), by End-user Vertical 2024 & 2032
- Figure 64: Europe MEA Talent Management Software Industry Volume (K Unit), by End-user Vertical 2024 & 2032
- Figure 65: Europe MEA Talent Management Software Industry Revenue Share (%), by End-user Vertical 2024 & 2032
- Figure 66: Europe MEA Talent Management Software Industry Volume Share (%), by End-user Vertical 2024 & 2032
- Figure 67: Europe MEA Talent Management Software Industry Revenue (Million), by Country 2024 & 2032
- Figure 68: Europe MEA Talent Management Software Industry Volume (K Unit), by Country 2024 & 2032
- Figure 69: Europe MEA Talent Management Software Industry Revenue Share (%), by Country 2024 & 2032
- Figure 70: Europe MEA Talent Management Software Industry Volume Share (%), by Country 2024 & 2032
- Figure 71: Middle East & Africa MEA Talent Management Software Industry Revenue (Million), by Type 2024 & 2032
- Figure 72: Middle East & Africa MEA Talent Management Software Industry Volume (K Unit), by Type 2024 & 2032
- Figure 73: Middle East & Africa MEA Talent Management Software Industry Revenue Share (%), by Type 2024 & 2032
- Figure 74: Middle East & Africa MEA Talent Management Software Industry Volume Share (%), by Type 2024 & 2032
- Figure 75: Middle East & Africa MEA Talent Management Software Industry Revenue (Million), by Deployment Mode 2024 & 2032
- Figure 76: Middle East & Africa MEA Talent Management Software Industry Volume (K Unit), by Deployment Mode 2024 & 2032
- Figure 77: Middle East & Africa MEA Talent Management Software Industry Revenue Share (%), by Deployment Mode 2024 & 2032
- Figure 78: Middle East & Africa MEA Talent Management Software Industry Volume Share (%), by Deployment Mode 2024 & 2032
- Figure 79: Middle East & Africa MEA Talent Management Software Industry Revenue (Million), by End-user Vertical 2024 & 2032
- Figure 80: Middle East & Africa MEA Talent Management Software Industry Volume (K Unit), by End-user Vertical 2024 & 2032
- Figure 81: Middle East & Africa MEA Talent Management Software Industry Revenue Share (%), by End-user Vertical 2024 & 2032
- Figure 82: Middle East & Africa MEA Talent Management Software Industry Volume Share (%), by End-user Vertical 2024 & 2032
- Figure 83: Middle East & Africa MEA Talent Management Software Industry Revenue (Million), by Country 2024 & 2032
- Figure 84: Middle East & Africa MEA Talent Management Software Industry Volume (K Unit), by Country 2024 & 2032
- Figure 85: Middle East & Africa MEA Talent Management Software Industry Revenue Share (%), by Country 2024 & 2032
- Figure 86: Middle East & Africa MEA Talent Management Software Industry Volume Share (%), by Country 2024 & 2032
- Figure 87: Asia Pacific MEA Talent Management Software Industry Revenue (Million), by Type 2024 & 2032
- Figure 88: Asia Pacific MEA Talent Management Software Industry Volume (K Unit), by Type 2024 & 2032
- Figure 89: Asia Pacific MEA Talent Management Software Industry Revenue Share (%), by Type 2024 & 2032
- Figure 90: Asia Pacific MEA Talent Management Software Industry Volume Share (%), by Type 2024 & 2032
- Figure 91: Asia Pacific MEA Talent Management Software Industry Revenue (Million), by Deployment Mode 2024 & 2032
- Figure 92: Asia Pacific MEA Talent Management Software Industry Volume (K Unit), by Deployment Mode 2024 & 2032
- Figure 93: Asia Pacific MEA Talent Management Software Industry Revenue Share (%), by Deployment Mode 2024 & 2032
- Figure 94: Asia Pacific MEA Talent Management Software Industry Volume Share (%), by Deployment Mode 2024 & 2032
- Figure 95: Asia Pacific MEA Talent Management Software Industry Revenue (Million), by End-user Vertical 2024 & 2032
- Figure 96: Asia Pacific MEA Talent Management Software Industry Volume (K Unit), by End-user Vertical 2024 & 2032
- Figure 97: Asia Pacific MEA Talent Management Software Industry Revenue Share (%), by End-user Vertical 2024 & 2032
- Figure 98: Asia Pacific MEA Talent Management Software Industry Volume Share (%), by End-user Vertical 2024 & 2032
- Figure 99: Asia Pacific MEA Talent Management Software Industry Revenue (Million), by Country 2024 & 2032
- Figure 100: Asia Pacific MEA Talent Management Software Industry Volume (K Unit), by Country 2024 & 2032
- Figure 101: Asia Pacific MEA Talent Management Software Industry Revenue Share (%), by Country 2024 & 2032
- Figure 102: Asia Pacific MEA Talent Management Software Industry Volume Share (%), by Country 2024 & 2032
List of Tables
- Table 1: Global MEA Talent Management Software Industry Revenue Million Forecast, by Region 2019 & 2032
- Table 2: Global MEA Talent Management Software Industry Volume K Unit Forecast, by Region 2019 & 2032
- Table 3: Global MEA Talent Management Software Industry Revenue Million Forecast, by Type 2019 & 2032
- Table 4: Global MEA Talent Management Software Industry Volume K Unit Forecast, by Type 2019 & 2032
- Table 5: Global MEA Talent Management Software Industry Revenue Million Forecast, by Deployment Mode 2019 & 2032
- Table 6: Global MEA Talent Management Software Industry Volume K Unit Forecast, by Deployment Mode 2019 & 2032
- Table 7: Global MEA Talent Management Software Industry Revenue Million Forecast, by End-user Vertical 2019 & 2032
- Table 8: Global MEA Talent Management Software Industry Volume K Unit Forecast, by End-user Vertical 2019 & 2032
- Table 9: Global MEA Talent Management Software Industry Revenue Million Forecast, by Region 2019 & 2032
- Table 10: Global MEA Talent Management Software Industry Volume K Unit Forecast, by Region 2019 & 2032
- Table 11: Global MEA Talent Management Software Industry Revenue Million Forecast, by Country 2019 & 2032
- Table 12: Global MEA Talent Management Software Industry Volume K Unit Forecast, by Country 2019 & 2032
- Table 13: MEA Talent Management Software Industry Revenue (Million) Forecast, by Application 2019 & 2032
- Table 14: MEA Talent Management Software Industry Volume (K Unit) Forecast, by Application 2019 & 2032
- Table 15: Global MEA Talent Management Software Industry Revenue Million Forecast, by Country 2019 & 2032
- Table 16: Global MEA Talent Management Software Industry Volume K Unit Forecast, by Country 2019 & 2032
- Table 17: MEA Talent Management Software Industry Revenue (Million) Forecast, by Application 2019 & 2032
- Table 18: MEA Talent Management Software Industry Volume (K Unit) Forecast, by Application 2019 & 2032
- Table 19: Global MEA Talent Management Software Industry Revenue Million Forecast, by Country 2019 & 2032
- Table 20: Global MEA Talent Management Software Industry Volume K Unit Forecast, by Country 2019 & 2032
- Table 21: MEA Talent Management Software Industry Revenue (Million) Forecast, by Application 2019 & 2032
- Table 22: MEA Talent Management Software Industry Volume (K Unit) Forecast, by Application 2019 & 2032
- Table 23: Global MEA Talent Management Software Industry Revenue Million Forecast, by Country 2019 & 2032
- Table 24: Global MEA Talent Management Software Industry Volume K Unit Forecast, by Country 2019 & 2032
- Table 25: MEA Talent Management Software Industry Revenue (Million) Forecast, by Application 2019 & 2032
- Table 26: MEA Talent Management Software Industry Volume (K Unit) Forecast, by Application 2019 & 2032
- Table 27: Global MEA Talent Management Software Industry Revenue Million Forecast, by Country 2019 & 2032
- Table 28: Global MEA Talent Management Software Industry Volume K Unit Forecast, by Country 2019 & 2032
- Table 29: MEA Talent Management Software Industry Revenue (Million) Forecast, by Application 2019 & 2032
- Table 30: MEA Talent Management Software Industry Volume (K Unit) Forecast, by Application 2019 & 2032
- Table 31: Global MEA Talent Management Software Industry Revenue Million Forecast, by Type 2019 & 2032
- Table 32: Global MEA Talent Management Software Industry Volume K Unit Forecast, by Type 2019 & 2032
- Table 33: Global MEA Talent Management Software Industry Revenue Million Forecast, by Deployment Mode 2019 & 2032
- Table 34: Global MEA Talent Management Software Industry Volume K Unit Forecast, by Deployment Mode 2019 & 2032
- Table 35: Global MEA Talent Management Software Industry Revenue Million Forecast, by End-user Vertical 2019 & 2032
- Table 36: Global MEA Talent Management Software Industry Volume K Unit Forecast, by End-user Vertical 2019 & 2032
- Table 37: Global MEA Talent Management Software Industry Revenue Million Forecast, by Country 2019 & 2032
- Table 38: Global MEA Talent Management Software Industry Volume K Unit Forecast, by Country 2019 & 2032
- Table 39: United States MEA Talent Management Software Industry Revenue (Million) Forecast, by Application 2019 & 2032
- Table 40: United States MEA Talent Management Software Industry Volume (K Unit) Forecast, by Application 2019 & 2032
- Table 41: Canada MEA Talent Management Software Industry Revenue (Million) Forecast, by Application 2019 & 2032
- Table 42: Canada MEA Talent Management Software Industry Volume (K Unit) Forecast, by Application 2019 & 2032
- Table 43: Mexico MEA Talent Management Software Industry Revenue (Million) Forecast, by Application 2019 & 2032
- Table 44: Mexico MEA Talent Management Software Industry Volume (K Unit) Forecast, by Application 2019 & 2032
- Table 45: Global MEA Talent Management Software Industry Revenue Million Forecast, by Type 2019 & 2032
- Table 46: Global MEA Talent Management Software Industry Volume K Unit Forecast, by Type 2019 & 2032
- Table 47: Global MEA Talent Management Software Industry Revenue Million Forecast, by Deployment Mode 2019 & 2032
- Table 48: Global MEA Talent Management Software Industry Volume K Unit Forecast, by Deployment Mode 2019 & 2032
- Table 49: Global MEA Talent Management Software Industry Revenue Million Forecast, by End-user Vertical 2019 & 2032
- Table 50: Global MEA Talent Management Software Industry Volume K Unit Forecast, by End-user Vertical 2019 & 2032
- Table 51: Global MEA Talent Management Software Industry Revenue Million Forecast, by Country 2019 & 2032
- Table 52: Global MEA Talent Management Software Industry Volume K Unit Forecast, by Country 2019 & 2032
- Table 53: Brazil MEA Talent Management Software Industry Revenue (Million) Forecast, by Application 2019 & 2032
- Table 54: Brazil MEA Talent Management Software Industry Volume (K Unit) Forecast, by Application 2019 & 2032
- Table 55: Argentina MEA Talent Management Software Industry Revenue (Million) Forecast, by Application 2019 & 2032
- Table 56: Argentina MEA Talent Management Software Industry Volume (K Unit) Forecast, by Application 2019 & 2032
- Table 57: Rest of South America MEA Talent Management Software Industry Revenue (Million) Forecast, by Application 2019 & 2032
- Table 58: Rest of South America MEA Talent Management Software Industry Volume (K Unit) Forecast, by Application 2019 & 2032
- Table 59: Global MEA Talent Management Software Industry Revenue Million Forecast, by Type 2019 & 2032
- Table 60: Global MEA Talent Management Software Industry Volume K Unit Forecast, by Type 2019 & 2032
- Table 61: Global MEA Talent Management Software Industry Revenue Million Forecast, by Deployment Mode 2019 & 2032
- Table 62: Global MEA Talent Management Software Industry Volume K Unit Forecast, by Deployment Mode 2019 & 2032
- Table 63: Global MEA Talent Management Software Industry Revenue Million Forecast, by End-user Vertical 2019 & 2032
- Table 64: Global MEA Talent Management Software Industry Volume K Unit Forecast, by End-user Vertical 2019 & 2032
- Table 65: Global MEA Talent Management Software Industry Revenue Million Forecast, by Country 2019 & 2032
- Table 66: Global MEA Talent Management Software Industry Volume K Unit Forecast, by Country 2019 & 2032
- Table 67: United Kingdom MEA Talent Management Software Industry Revenue (Million) Forecast, by Application 2019 & 2032
- Table 68: United Kingdom MEA Talent Management Software Industry Volume (K Unit) Forecast, by Application 2019 & 2032
- Table 69: Germany MEA Talent Management Software Industry Revenue (Million) Forecast, by Application 2019 & 2032
- Table 70: Germany MEA Talent Management Software Industry Volume (K Unit) Forecast, by Application 2019 & 2032
- Table 71: France MEA Talent Management Software Industry Revenue (Million) Forecast, by Application 2019 & 2032
- Table 72: France MEA Talent Management Software Industry Volume (K Unit) Forecast, by Application 2019 & 2032
- Table 73: Italy MEA Talent Management Software Industry Revenue (Million) Forecast, by Application 2019 & 2032
- Table 74: Italy MEA Talent Management Software Industry Volume (K Unit) Forecast, by Application 2019 & 2032
- Table 75: Spain MEA Talent Management Software Industry Revenue (Million) Forecast, by Application 2019 & 2032
- Table 76: Spain MEA Talent Management Software Industry Volume (K Unit) Forecast, by Application 2019 & 2032
- Table 77: Russia MEA Talent Management Software Industry Revenue (Million) Forecast, by Application 2019 & 2032
- Table 78: Russia MEA Talent Management Software Industry Volume (K Unit) Forecast, by Application 2019 & 2032
- Table 79: Benelux MEA Talent Management Software Industry Revenue (Million) Forecast, by Application 2019 & 2032
- Table 80: Benelux MEA Talent Management Software Industry Volume (K Unit) Forecast, by Application 2019 & 2032
- Table 81: Nordics MEA Talent Management Software Industry Revenue (Million) Forecast, by Application 2019 & 2032
- Table 82: Nordics MEA Talent Management Software Industry Volume (K Unit) Forecast, by Application 2019 & 2032
- Table 83: Rest of Europe MEA Talent Management Software Industry Revenue (Million) Forecast, by Application 2019 & 2032
- Table 84: Rest of Europe MEA Talent Management Software Industry Volume (K Unit) Forecast, by Application 2019 & 2032
- Table 85: Global MEA Talent Management Software Industry Revenue Million Forecast, by Type 2019 & 2032
- Table 86: Global MEA Talent Management Software Industry Volume K Unit Forecast, by Type 2019 & 2032
- Table 87: Global MEA Talent Management Software Industry Revenue Million Forecast, by Deployment Mode 2019 & 2032
- Table 88: Global MEA Talent Management Software Industry Volume K Unit Forecast, by Deployment Mode 2019 & 2032
- Table 89: Global MEA Talent Management Software Industry Revenue Million Forecast, by End-user Vertical 2019 & 2032
- Table 90: Global MEA Talent Management Software Industry Volume K Unit Forecast, by End-user Vertical 2019 & 2032
- Table 91: Global MEA Talent Management Software Industry Revenue Million Forecast, by Country 2019 & 2032
- Table 92: Global MEA Talent Management Software Industry Volume K Unit Forecast, by Country 2019 & 2032
- Table 93: Turkey MEA Talent Management Software Industry Revenue (Million) Forecast, by Application 2019 & 2032
- Table 94: Turkey MEA Talent Management Software Industry Volume (K Unit) Forecast, by Application 2019 & 2032
- Table 95: Israel MEA Talent Management Software Industry Revenue (Million) Forecast, by Application 2019 & 2032
- Table 96: Israel MEA Talent Management Software Industry Volume (K Unit) Forecast, by Application 2019 & 2032
- Table 97: GCC MEA Talent Management Software Industry Revenue (Million) Forecast, by Application 2019 & 2032
- Table 98: GCC MEA Talent Management Software Industry Volume (K Unit) Forecast, by Application 2019 & 2032
- Table 99: North Africa MEA Talent Management Software Industry Revenue (Million) Forecast, by Application 2019 & 2032
- Table 100: North Africa MEA Talent Management Software Industry Volume (K Unit) Forecast, by Application 2019 & 2032
- Table 101: South Africa MEA Talent Management Software Industry Revenue (Million) Forecast, by Application 2019 & 2032
- Table 102: South Africa MEA Talent Management Software Industry Volume (K Unit) Forecast, by Application 2019 & 2032
- Table 103: Rest of Middle East & Africa MEA Talent Management Software Industry Revenue (Million) Forecast, by Application 2019 & 2032
- Table 104: Rest of Middle East & Africa MEA Talent Management Software Industry Volume (K Unit) Forecast, by Application 2019 & 2032
- Table 105: Global MEA Talent Management Software Industry Revenue Million Forecast, by Type 2019 & 2032
- Table 106: Global MEA Talent Management Software Industry Volume K Unit Forecast, by Type 2019 & 2032
- Table 107: Global MEA Talent Management Software Industry Revenue Million Forecast, by Deployment Mode 2019 & 2032
- Table 108: Global MEA Talent Management Software Industry Volume K Unit Forecast, by Deployment Mode 2019 & 2032
- Table 109: Global MEA Talent Management Software Industry Revenue Million Forecast, by End-user Vertical 2019 & 2032
- Table 110: Global MEA Talent Management Software Industry Volume K Unit Forecast, by End-user Vertical 2019 & 2032
- Table 111: Global MEA Talent Management Software Industry Revenue Million Forecast, by Country 2019 & 2032
- Table 112: Global MEA Talent Management Software Industry Volume K Unit Forecast, by Country 2019 & 2032
- Table 113: China MEA Talent Management Software Industry Revenue (Million) Forecast, by Application 2019 & 2032
- Table 114: China MEA Talent Management Software Industry Volume (K Unit) Forecast, by Application 2019 & 2032
- Table 115: India MEA Talent Management Software Industry Revenue (Million) Forecast, by Application 2019 & 2032
- Table 116: India MEA Talent Management Software Industry Volume (K Unit) Forecast, by Application 2019 & 2032
- Table 117: Japan MEA Talent Management Software Industry Revenue (Million) Forecast, by Application 2019 & 2032
- Table 118: Japan MEA Talent Management Software Industry Volume (K Unit) Forecast, by Application 2019 & 2032
- Table 119: South Korea MEA Talent Management Software Industry Revenue (Million) Forecast, by Application 2019 & 2032
- Table 120: South Korea MEA Talent Management Software Industry Volume (K Unit) Forecast, by Application 2019 & 2032
- Table 121: ASEAN MEA Talent Management Software Industry Revenue (Million) Forecast, by Application 2019 & 2032
- Table 122: ASEAN MEA Talent Management Software Industry Volume (K Unit) Forecast, by Application 2019 & 2032
- Table 123: Oceania MEA Talent Management Software Industry Revenue (Million) Forecast, by Application 2019 & 2032
- Table 124: Oceania MEA Talent Management Software Industry Volume (K Unit) Forecast, by Application 2019 & 2032
- Table 125: Rest of Asia Pacific MEA Talent Management Software Industry Revenue (Million) Forecast, by Application 2019 & 2032
- Table 126: Rest of Asia Pacific MEA Talent Management Software Industry Volume (K Unit) Forecast, by Application 2019 & 2032
Frequently Asked Questions
1. What is the projected Compound Annual Growth Rate (CAGR) of the MEA Talent Management Software Industry?
The projected CAGR is approximately 8.38%.
2. Which companies are prominent players in the MEA Talent Management Software Industry?
Key companies in the market include Workday Inc, Reflexis Systems Inc, NICE Systems Ltd, Roubler UK Limited Company, IBM Corporation, Blue Yonder Group Inc, Active Operations Management International LLP, Sage Group PLC, Kronos Incorporated (UKG Inc ), 7shifts, ServiceMax Inc, Infor Group, Atoss Software AG, Oracle Corporation, ADP LLC, Tamigo UK Ltd, SISQUAL, WorkForce Software LLC, SAP SE, Mitrefinch Ltd, Kirona Solutions Limited.
3. What are the main segments of the MEA Talent Management Software Industry?
The market segments include Type, Deployment Mode, End-user Vertical.
4. Can you provide details about the market size?
The market size is estimated to be USD 0.41 Million as of 2022.
5. What are some drivers contributing to market growth?
Increasing Adoption of Internet of Things (IoT) and Cloud-based Solutions Expanding the Market; Growing Adoption of Analytical Solutions and WFM by SMEs Driving Market Growth.
6. What are the notable trends driving market growth?
Workforce Scheduling and Workforce Analytics Type is Expected to Hold Significant Market Share.
7. Are there any restraints impacting market growth?
; Availability of open-source alternatives.
8. Can you provide examples of recent developments in the market?
January 2023: BrightPlan, a United States-based company, launched a new workforce financial wellness gauge, providing data-driven insights for organizations to uncover key workforce strengths and gaps in the Middle East and Africa region. BrightPlan's Total Financial Wellness solution, powered by patented AI technology, transforms raw data into valuable insights and advice for employers and employees.
9. What pricing options are available for accessing the report?
Pricing options include single-user, multi-user, and enterprise licenses priced at USD 4750, USD 4950, and USD 6800 respectively.
10. Is the market size provided in terms of value or volume?
The market size is provided in terms of value, measured in Million and volume, measured in K Unit.
11. Are there any specific market keywords associated with the report?
Yes, the market keyword associated with the report is "MEA Talent Management Software Industry," which aids in identifying and referencing the specific market segment covered.
12. How do I determine which pricing option suits my needs best?
The pricing options vary based on user requirements and access needs. Individual users may opt for single-user licenses, while businesses requiring broader access may choose multi-user or enterprise licenses for cost-effective access to the report.
13. Are there any additional resources or data provided in the MEA Talent Management Software Industry report?
While the report offers comprehensive insights, it's advisable to review the specific contents or supplementary materials provided to ascertain if additional resources or data are available.
14. How can I stay updated on further developments or reports in the MEA Talent Management Software Industry?
To stay informed about further developments, trends, and reports in the MEA Talent Management Software Industry, consider subscribing to industry newsletters, following relevant companies and organizations, or regularly checking reputable industry news sources and publications.
Methodology
Step 1 - Identification of Relevant Samples Size from Population Database


Step 2 - Approaches for Defining Global Market Size (Value, Volume* & Price*)

Note*: In applicable scenarios
Step 3 - Data Sources
Primary Research
- Web Analytics
- Survey Reports
- Research Institute
- Latest Research Reports
- Opinion Leaders
Secondary Research
- Annual Reports
- White Paper
- Latest Press Release
- Industry Association
- Paid Database
- Investor Presentations

Step 4 - Data Triangulation
Involves using different sources of information in order to increase the validity of a study
These sources are likely to be stakeholders in a program - participants, other researchers, program staff, other community members, and so on.
Then we put all data in single framework & apply various statistical tools to find out the dynamic on the market.
During the analysis stage, feedback from the stakeholder groups would be compared to determine areas of agreement as well as areas of divergence
