

Key Insights
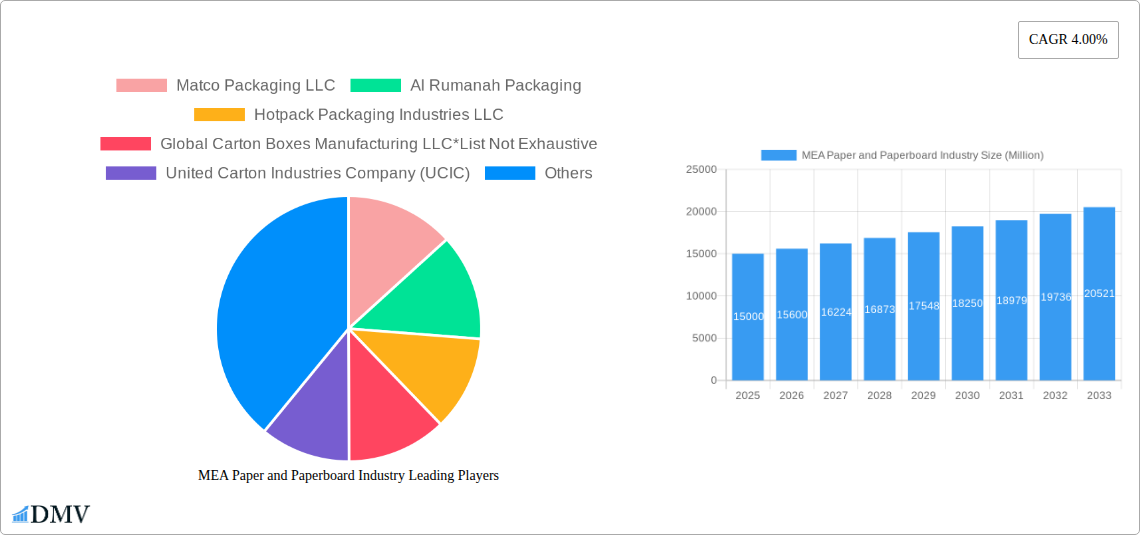
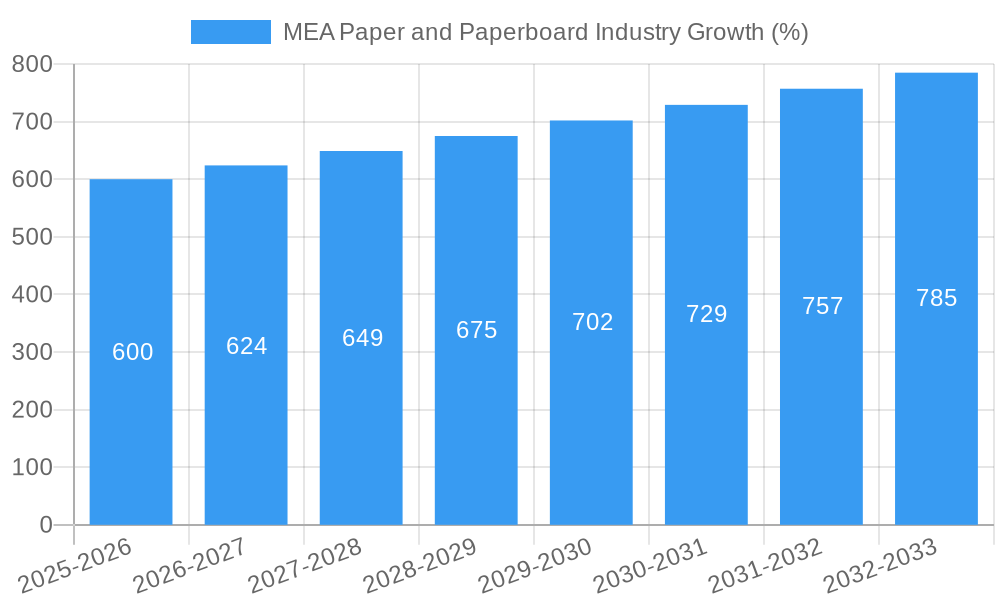
The Middle East and Africa (MEA) paper and paperboard industry exhibits robust growth potential, driven by a burgeoning population, expanding urbanization, and a rising demand across diverse sectors. The 4% CAGR indicates a steady, consistent expansion, projected to continue through 2033. Key drivers include the increasing consumption of packaged food and beverages, fueled by changing lifestyles and a growing preference for convenience. The processed food and beverage segments are particularly significant contributors to this growth, with packaging playing a vital role in maintaining product quality and extending shelf life. Furthermore, the growth of the e-commerce sector is indirectly boosting demand for paper-based packaging materials. While the industry faces challenges like fluctuating raw material prices and environmental concerns surrounding sustainable sourcing, innovation in packaging design and the adoption of eco-friendly materials are mitigating these restraints. Regional variations exist, with countries like the UAE and Saudi Arabia leading the market due to their advanced economies and significant investments in infrastructure. Turkey also plays a considerable role, acting as a regional manufacturing hub. The industry is characterized by a mix of large multinational corporations and local players, fostering both competition and collaboration. The future growth trajectory will likely be shaped by advancements in recycling technologies and increasing regulatory pressure promoting sustainable practices, ultimately leading to a more environmentally responsible and economically vibrant paper and paperboard industry in the MEA region.
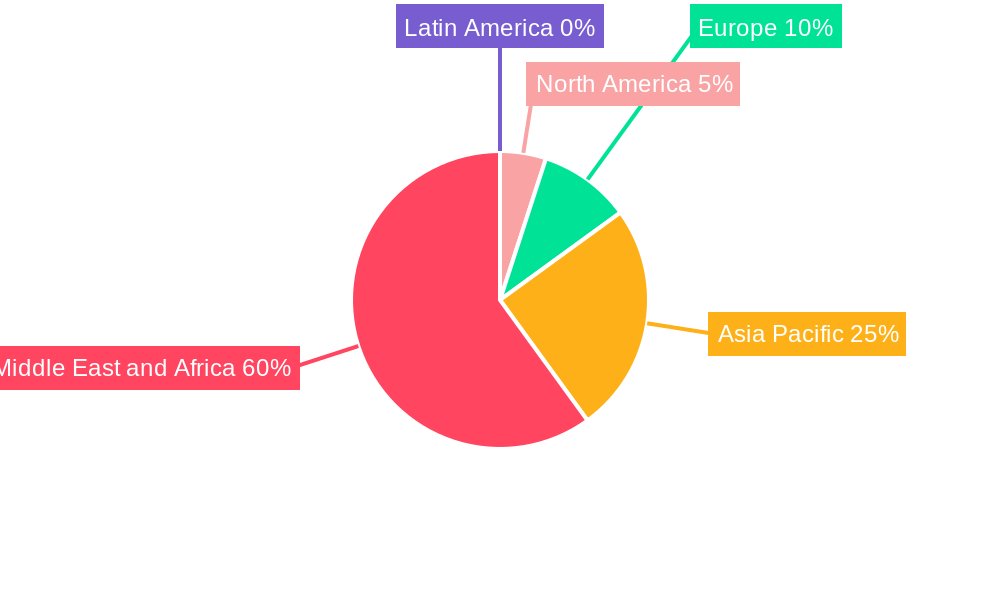
The MEA paper and paperboard market segmentation reveals a diverse landscape. The processed foods segment dominates, reflecting the region's expanding food processing industry. The beverages sector is a close second, driven by the popularity of packaged drinks. The paper products and electrical products sectors contribute substantially as well, showcasing the broad applications of paper and paperboard. Looking geographically, the UAE and Saudi Arabia represent the largest markets due to their higher disposable incomes and substantial consumption patterns. Turkey's significant manufacturing capabilities contribute to its strong position. Other countries within the MEA region present considerable untapped potential for growth. The forecast period (2025-2033) is expected to witness significant investments in new production facilities and capacity expansions, further accelerating market growth. A key trend is the shift toward sustainable and eco-friendly packaging solutions, as businesses and consumers become increasingly aware of environmental issues. This will influence future market dynamics and drive innovation within the industry.
MEA Paper and Paperboard Industry: A Comprehensive Market Report (2019-2033)
This insightful report provides a detailed analysis of the Middle East and Africa (MEA) paper and paperboard industry, offering a comprehensive overview of market dynamics, key players, and future growth prospects. The study period spans from 2019 to 2033, with 2025 serving as both the base and estimated year. The report is invaluable for stakeholders seeking to understand the current landscape and strategize for future success in this dynamic sector. With a projected market value of xx Million by 2033, the MEA paper and paperboard industry presents significant opportunities and challenges.
MEA Paper and Paperboard Industry Market Composition & Trends
This section delves into the competitive landscape of the MEA paper and paperboard market, analyzing market concentration, innovation drivers, regulatory frameworks, substitute products, and end-user profiles. We examine M&A activities, quantifying market share distribution and deal values (estimated at xx Million in total deal value for the period 2019-2024).
- Market Concentration: The MEA paper and paperboard industry exhibits a moderately concentrated market structure, with a few dominant players and a larger number of smaller regional companies. International Paper holds a significant market share, followed by regional leaders such as Matco Packaging LLC and Al Rumanah Packaging.
- Innovation Catalysts: Sustainability concerns are driving innovation towards recycled and eco-friendly paper products. Technological advancements in printing and packaging are also key drivers.
- Regulatory Landscape: Government regulations concerning waste management and environmental protection are shaping industry practices, influencing the adoption of sustainable materials and processes.
- Substitute Products: The industry faces competition from substitute materials such as plastic and digital alternatives. This report analyzes the impact of these substitutes on market growth.
- End-User Profiles: Processed foods, fresh food and produce, and beverages are significant end-use segments, driving demand for specialized packaging solutions.
- M&A Activity: Consolidation is expected to continue, with larger players seeking to expand their market share and geographical reach. The report analyzes past M&A deals and projects future activity.
MEA Paper and Paperboard Industry Industry Evolution
This section traces the evolution of the MEA paper and paperboard industry, highlighting market growth trajectories, technological advancements, and evolving consumer preferences. The report analyzes historical data from 2019-2024 and forecasts growth until 2033. The market experienced a Compound Annual Growth Rate (CAGR) of xx% during the historical period (2019-2024) and is projected to grow at a CAGR of xx% during the forecast period (2025-2033). Factors driving this growth include increased urbanization, rising disposable incomes, and the burgeoning food and beverage sector. The adoption of advanced packaging technologies, such as flexible packaging and sustainable materials, is accelerating. Consumer demand is increasingly focused on eco-friendly and convenient packaging solutions.
Leading Regions, Countries, or Segments in MEA Paper and Paperboard Industry
This section identifies the leading regions, countries, and end-user segments within the MEA paper and paperboard industry.
By Country:
- United Arab Emirates: The UAE leads the MEA region in paper and paperboard consumption, driven by its robust economy, expanding population, and significant presence of food and beverage companies. Key drivers include significant infrastructure investment and supportive government policies.
- Saudi Arabia: Saudi Arabia holds a substantial market share, fueled by a large population and a growing demand for packaging materials across various industries. Government initiatives promoting industrial diversification contribute to market growth.
- Turkey: Turkey represents a significant market, benefiting from its strategic geographic location and relatively developed manufacturing sector. A growing middle class and expanding domestic consumption drive demand.
- Rest of Middle East and Africa: This segment shows promising growth potential, driven by increasing urbanization and economic development in several countries.
By End-user Industry:
- Processed Foods: This segment dominates the industry due to the increasing consumption of processed foods and the need for robust packaging solutions.
- Fresh Food and Produce: The demand for packaging solutions to preserve freshness and extend shelf life is growing, presenting a strong opportunity for the industry.
- Beverages: The beverage industry consistently drives demand for paper and paperboard packaging, particularly cartons and labels.
MEA Paper and Paperboard Industry Product Innovations
The MEA paper and paperboard industry is witnessing significant product innovations focusing on sustainability and enhanced performance. Companies are introducing lightweight, recyclable, and biodegradable packaging solutions made from renewable resources. Advanced printing technologies enhance packaging aesthetics and branding while improving shelf appeal and product protection. The adoption of smart packaging, incorporating features like RFID tags and QR codes for enhanced traceability and consumer engagement, is gradually increasing.
Propelling Factors for MEA Paper and Paperboard Industry Growth
Several key factors drive the growth of the MEA paper and paperboard industry. The expanding food and beverage sector, coupled with rising disposable incomes, fuels demand for packaging solutions. Government initiatives promoting sustainable packaging and reducing reliance on plastics provide further impetus. Technological advancements in printing and packaging technologies continue to enhance efficiency and product quality.
Obstacles in the MEA Paper and Paperboard Industry Market
Challenges faced by the industry include fluctuating raw material prices, supply chain disruptions, and increasing competition from substitute materials. Environmental regulations, although promoting sustainable practices, can increase production costs. The industry also faces pressure to adopt more efficient and sustainable packaging solutions to reduce its environmental footprint.
Future Opportunities in MEA Paper and Paperboard Industry
Future opportunities lie in the growth of e-commerce and the increased demand for customized packaging solutions. Expansion into new markets across Africa, coupled with the development of biodegradable and recyclable packaging options, offers significant potential for growth. Furthermore, leveraging digital technologies to improve supply chain efficiency and enhance consumer experiences creates new avenues for success.
Major Players in the MEA Paper and Paperboard Industry Ecosystem
- Matco Packaging LLC
- Al Rumanah Packaging
- Hotpack Packaging Industries LLC
- Global Carton Boxes Manufacturing LLC
- United Carton Industries Company (UCIC)
- IFFCO
- Tarboosh Packaging Co LLC
- Green Packaging Boxes Ind LLC
- Arabian Packaging Co LLC
- International Paper
Key Developments in MEA Paper and Paperboard Industry Industry
- 2022 Q3: Matco Packaging LLC launched a new line of eco-friendly packaging solutions.
- 2023 Q1: A major merger between two regional players resulted in a significant increase in market share. (Specific details of merger omitted due to lack of data)
- 2024 Q4: New regulations concerning plastic packaging came into effect, influencing industry practices.
Strategic MEA Paper and Paperboard Industry Market Forecast
The MEA paper and paperboard industry is poised for robust growth, driven by continued economic expansion, population growth, and increasing demand for packaged goods. The focus on sustainable packaging and technological advancements will shape the future of the industry. New market entrants and innovative product offerings will further diversify the sector. The market is projected to reach xx Million by 2033, representing substantial growth opportunities for businesses operating in this dynamic market.
MEA Paper and Paperboard Industry Segmentation
-
1. Type
- 1.1. Printing and Writing
- 1.2. Newsprint
- 1.3. Tissue
- 1.4. Cartonboard
- 1.5. Containerboard
- 1.6. Other Types
-
2. End-user Industry
- 2.1. Processed Foods
- 2.2. Fresh Food and Produces
- 2.3. Beverages
- 2.4. Paper Products
- 2.5. Electrical Products
- 2.6. Other End-user Industries
MEA Paper and Paperboard Industry Segmentation By Geography
-
1. North America
- 1.1. United States
- 1.2. Canada
- 1.3. Mexico
-
2. South America
- 2.1. Brazil
- 2.2. Argentina
- 2.3. Rest of South America
-
3. Europe
- 3.1. United Kingdom
- 3.2. Germany
- 3.3. France
- 3.4. Italy
- 3.5. Spain
- 3.6. Russia
- 3.7. Benelux
- 3.8. Nordics
- 3.9. Rest of Europe
-
4. Middle East & Africa
- 4.1. Turkey
- 4.2. Israel
- 4.3. GCC
- 4.4. North Africa
- 4.5. South Africa
- 4.6. Rest of Middle East & Africa
-
5. Asia Pacific
- 5.1. China
- 5.2. India
- 5.3. Japan
- 5.4. South Korea
- 5.5. ASEAN
- 5.6. Oceania
- 5.7. Rest of Asia Pacific
MEA Paper and Paperboard Industry REPORT HIGHLIGHTS
| Aspects | Details |
|---|---|
| Study Period | 2019-2033 |
| Base Year | 2024 |
| Estimated Year | 2025 |
| Forecast Period | 2025-2033 |
| Historical Period | 2019-2024 |
| Growth Rate | CAGR of 4.00% from 2019-2033 |
| Segmentation |
|
Table of Contents
- 1. Introduction
- 1.1. Research Scope
- 1.2. Market Segmentation
- 1.3. Research Methodology
- 1.4. Definitions and Assumptions
- 2. Executive Summary
- 2.1. Introduction
- 3. Market Dynamics
- 3.1. Introduction
- 3.2. Market Drivers
- 3.2.1. Introduction of Advanced Packaging Technologies to Increase Sales; Increasing Demand for Packaging from Logistics and Transportation
- 3.3. Market Restrains
- 3.3.1. High Costs and Import Duties Pose a Challenge for New Customers; Fluctuations in Raw Material Prices
- 3.4. Market Trends
- 3.4.1. Container Board to Witness the Fastest Market Growth
- 4. Market Factor Analysis
- 4.1. Porters Five Forces
- 4.2. Supply/Value Chain
- 4.3. PESTEL analysis
- 4.4. Market Entropy
- 4.5. Patent/Trademark Analysis
- 5. Global MEA Paper and Paperboard Industry Analysis, Insights and Forecast, 2019-2031
- 5.1. Market Analysis, Insights and Forecast - by Type
- 5.1.1. Printing and Writing
- 5.1.2. Newsprint
- 5.1.3. Tissue
- 5.1.4. Cartonboard
- 5.1.5. Containerboard
- 5.1.6. Other Types
- 5.2. Market Analysis, Insights and Forecast - by End-user Industry
- 5.2.1. Processed Foods
- 5.2.2. Fresh Food and Produces
- 5.2.3. Beverages
- 5.2.4. Paper Products
- 5.2.5. Electrical Products
- 5.2.6. Other End-user Industries
- 5.3. Market Analysis, Insights and Forecast - by Region
- 5.3.1. North America
- 5.3.2. South America
- 5.3.3. Europe
- 5.3.4. Middle East & Africa
- 5.3.5. Asia Pacific
- 5.1. Market Analysis, Insights and Forecast - by Type
- 6. North America MEA Paper and Paperboard Industry Analysis, Insights and Forecast, 2019-2031
- 6.1. Market Analysis, Insights and Forecast - by Type
- 6.1.1. Printing and Writing
- 6.1.2. Newsprint
- 6.1.3. Tissue
- 6.1.4. Cartonboard
- 6.1.5. Containerboard
- 6.1.6. Other Types
- 6.2. Market Analysis, Insights and Forecast - by End-user Industry
- 6.2.1. Processed Foods
- 6.2.2. Fresh Food and Produces
- 6.2.3. Beverages
- 6.2.4. Paper Products
- 6.2.5. Electrical Products
- 6.2.6. Other End-user Industries
- 6.1. Market Analysis, Insights and Forecast - by Type
- 7. South America MEA Paper and Paperboard Industry Analysis, Insights and Forecast, 2019-2031
- 7.1. Market Analysis, Insights and Forecast - by Type
- 7.1.1. Printing and Writing
- 7.1.2. Newsprint
- 7.1.3. Tissue
- 7.1.4. Cartonboard
- 7.1.5. Containerboard
- 7.1.6. Other Types
- 7.2. Market Analysis, Insights and Forecast - by End-user Industry
- 7.2.1. Processed Foods
- 7.2.2. Fresh Food and Produces
- 7.2.3. Beverages
- 7.2.4. Paper Products
- 7.2.5. Electrical Products
- 7.2.6. Other End-user Industries
- 7.1. Market Analysis, Insights and Forecast - by Type
- 8. Europe MEA Paper and Paperboard Industry Analysis, Insights and Forecast, 2019-2031
- 8.1. Market Analysis, Insights and Forecast - by Type
- 8.1.1. Printing and Writing
- 8.1.2. Newsprint
- 8.1.3. Tissue
- 8.1.4. Cartonboard
- 8.1.5. Containerboard
- 8.1.6. Other Types
- 8.2. Market Analysis, Insights and Forecast - by End-user Industry
- 8.2.1. Processed Foods
- 8.2.2. Fresh Food and Produces
- 8.2.3. Beverages
- 8.2.4. Paper Products
- 8.2.5. Electrical Products
- 8.2.6. Other End-user Industries
- 8.1. Market Analysis, Insights and Forecast - by Type
- 9. Middle East & Africa MEA Paper and Paperboard Industry Analysis, Insights and Forecast, 2019-2031
- 9.1. Market Analysis, Insights and Forecast - by Type
- 9.1.1. Printing and Writing
- 9.1.2. Newsprint
- 9.1.3. Tissue
- 9.1.4. Cartonboard
- 9.1.5. Containerboard
- 9.1.6. Other Types
- 9.2. Market Analysis, Insights and Forecast - by End-user Industry
- 9.2.1. Processed Foods
- 9.2.2. Fresh Food and Produces
- 9.2.3. Beverages
- 9.2.4. Paper Products
- 9.2.5. Electrical Products
- 9.2.6. Other End-user Industries
- 9.1. Market Analysis, Insights and Forecast - by Type
- 10. Asia Pacific MEA Paper and Paperboard Industry Analysis, Insights and Forecast, 2019-2031
- 10.1. Market Analysis, Insights and Forecast - by Type
- 10.1.1. Printing and Writing
- 10.1.2. Newsprint
- 10.1.3. Tissue
- 10.1.4. Cartonboard
- 10.1.5. Containerboard
- 10.1.6. Other Types
- 10.2. Market Analysis, Insights and Forecast - by End-user Industry
- 10.2.1. Processed Foods
- 10.2.2. Fresh Food and Produces
- 10.2.3. Beverages
- 10.2.4. Paper Products
- 10.2.5. Electrical Products
- 10.2.6. Other End-user Industries
- 10.1. Market Analysis, Insights and Forecast - by Type
- 11. North America MEA Paper and Paperboard Industry Analysis, Insights and Forecast, 2019-2031
- 11.1. Market Analysis, Insights and Forecast - By Country/Sub-region
- 11.1.1.
- 12. Asia Pacific MEA Paper and Paperboard Industry Analysis, Insights and Forecast, 2019-2031
- 12.1. Market Analysis, Insights and Forecast - By Country/Sub-region
- 12.1.1.
- 13. Europe MEA Paper and Paperboard Industry Analysis, Insights and Forecast, 2019-2031
- 13.1. Market Analysis, Insights and Forecast - By Country/Sub-region
- 13.1.1.
- 14. Middle East and Africa MEA Paper and Paperboard Industry Analysis, Insights and Forecast, 2019-2031
- 14.1. Market Analysis, Insights and Forecast - By Country/Sub-region
- 14.1.1.
- 15. Latin America MEA Paper and Paperboard Industry Analysis, Insights and Forecast, 2019-2031
- 15.1. Market Analysis, Insights and Forecast - By Country/Sub-region
- 15.1.1.
- 16. Competitive Analysis
- 16.1. Global Market Share Analysis 2024
- 16.2. Company Profiles
- 16.2.1 Matco Packaging LLC
- 16.2.1.1. Overview
- 16.2.1.2. Products
- 16.2.1.3. SWOT Analysis
- 16.2.1.4. Recent Developments
- 16.2.1.5. Financials (Based on Availability)
- 16.2.2 Al Rumanah Packaging
- 16.2.2.1. Overview
- 16.2.2.2. Products
- 16.2.2.3. SWOT Analysis
- 16.2.2.4. Recent Developments
- 16.2.2.5. Financials (Based on Availability)
- 16.2.3 Hotpack Packaging Industries LLC
- 16.2.3.1. Overview
- 16.2.3.2. Products
- 16.2.3.3. SWOT Analysis
- 16.2.3.4. Recent Developments
- 16.2.3.5. Financials (Based on Availability)
- 16.2.4 Global Carton Boxes Manufacturing LLC*List Not Exhaustive
- 16.2.4.1. Overview
- 16.2.4.2. Products
- 16.2.4.3. SWOT Analysis
- 16.2.4.4. Recent Developments
- 16.2.4.5. Financials (Based on Availability)
- 16.2.5 United Carton Industries Company (UCIC)
- 16.2.5.1. Overview
- 16.2.5.2. Products
- 16.2.5.3. SWOT Analysis
- 16.2.5.4. Recent Developments
- 16.2.5.5. Financials (Based on Availability)
- 16.2.6 IFFCO
- 16.2.6.1. Overview
- 16.2.6.2. Products
- 16.2.6.3. SWOT Analysis
- 16.2.6.4. Recent Developments
- 16.2.6.5. Financials (Based on Availability)
- 16.2.7 Tarboosh Packaging Co LLC
- 16.2.7.1. Overview
- 16.2.7.2. Products
- 16.2.7.3. SWOT Analysis
- 16.2.7.4. Recent Developments
- 16.2.7.5. Financials (Based on Availability)
- 16.2.8 Green Packaging Boxes Ind LLC
- 16.2.8.1. Overview
- 16.2.8.2. Products
- 16.2.8.3. SWOT Analysis
- 16.2.8.4. Recent Developments
- 16.2.8.5. Financials (Based on Availability)
- 16.2.9 Arabian Packaging Co LLC
- 16.2.9.1. Overview
- 16.2.9.2. Products
- 16.2.9.3. SWOT Analysis
- 16.2.9.4. Recent Developments
- 16.2.9.5. Financials (Based on Availability)
- 16.2.10 International Paper
- 16.2.10.1. Overview
- 16.2.10.2. Products
- 16.2.10.3. SWOT Analysis
- 16.2.10.4. Recent Developments
- 16.2.10.5. Financials (Based on Availability)
- 16.2.1 Matco Packaging LLC
List of Figures
- Figure 1: Global MEA Paper and Paperboard Industry Revenue Breakdown (Million, %) by Region 2024 & 2032
- Figure 2: North America MEA Paper and Paperboard Industry Revenue (Million), by Country 2024 & 2032
- Figure 3: North America MEA Paper and Paperboard Industry Revenue Share (%), by Country 2024 & 2032
- Figure 4: Asia Pacific MEA Paper and Paperboard Industry Revenue (Million), by Country 2024 & 2032
- Figure 5: Asia Pacific MEA Paper and Paperboard Industry Revenue Share (%), by Country 2024 & 2032
- Figure 6: Europe MEA Paper and Paperboard Industry Revenue (Million), by Country 2024 & 2032
- Figure 7: Europe MEA Paper and Paperboard Industry Revenue Share (%), by Country 2024 & 2032
- Figure 8: Middle East and Africa MEA Paper and Paperboard Industry Revenue (Million), by Country 2024 & 2032
- Figure 9: Middle East and Africa MEA Paper and Paperboard Industry Revenue Share (%), by Country 2024 & 2032
- Figure 10: Latin America MEA Paper and Paperboard Industry Revenue (Million), by Country 2024 & 2032
- Figure 11: Latin America MEA Paper and Paperboard Industry Revenue Share (%), by Country 2024 & 2032
- Figure 12: North America MEA Paper and Paperboard Industry Revenue (Million), by Type 2024 & 2032
- Figure 13: North America MEA Paper and Paperboard Industry Revenue Share (%), by Type 2024 & 2032
- Figure 14: North America MEA Paper and Paperboard Industry Revenue (Million), by End-user Industry 2024 & 2032
- Figure 15: North America MEA Paper and Paperboard Industry Revenue Share (%), by End-user Industry 2024 & 2032
- Figure 16: North America MEA Paper and Paperboard Industry Revenue (Million), by Country 2024 & 2032
- Figure 17: North America MEA Paper and Paperboard Industry Revenue Share (%), by Country 2024 & 2032
- Figure 18: South America MEA Paper and Paperboard Industry Revenue (Million), by Type 2024 & 2032
- Figure 19: South America MEA Paper and Paperboard Industry Revenue Share (%), by Type 2024 & 2032
- Figure 20: South America MEA Paper and Paperboard Industry Revenue (Million), by End-user Industry 2024 & 2032
- Figure 21: South America MEA Paper and Paperboard Industry Revenue Share (%), by End-user Industry 2024 & 2032
- Figure 22: South America MEA Paper and Paperboard Industry Revenue (Million), by Country 2024 & 2032
- Figure 23: South America MEA Paper and Paperboard Industry Revenue Share (%), by Country 2024 & 2032
- Figure 24: Europe MEA Paper and Paperboard Industry Revenue (Million), by Type 2024 & 2032
- Figure 25: Europe MEA Paper and Paperboard Industry Revenue Share (%), by Type 2024 & 2032
- Figure 26: Europe MEA Paper and Paperboard Industry Revenue (Million), by End-user Industry 2024 & 2032
- Figure 27: Europe MEA Paper and Paperboard Industry Revenue Share (%), by End-user Industry 2024 & 2032
- Figure 28: Europe MEA Paper and Paperboard Industry Revenue (Million), by Country 2024 & 2032
- Figure 29: Europe MEA Paper and Paperboard Industry Revenue Share (%), by Country 2024 & 2032
- Figure 30: Middle East & Africa MEA Paper and Paperboard Industry Revenue (Million), by Type 2024 & 2032
- Figure 31: Middle East & Africa MEA Paper and Paperboard Industry Revenue Share (%), by Type 2024 & 2032
- Figure 32: Middle East & Africa MEA Paper and Paperboard Industry Revenue (Million), by End-user Industry 2024 & 2032
- Figure 33: Middle East & Africa MEA Paper and Paperboard Industry Revenue Share (%), by End-user Industry 2024 & 2032
- Figure 34: Middle East & Africa MEA Paper and Paperboard Industry Revenue (Million), by Country 2024 & 2032
- Figure 35: Middle East & Africa MEA Paper and Paperboard Industry Revenue Share (%), by Country 2024 & 2032
- Figure 36: Asia Pacific MEA Paper and Paperboard Industry Revenue (Million), by Type 2024 & 2032
- Figure 37: Asia Pacific MEA Paper and Paperboard Industry Revenue Share (%), by Type 2024 & 2032
- Figure 38: Asia Pacific MEA Paper and Paperboard Industry Revenue (Million), by End-user Industry 2024 & 2032
- Figure 39: Asia Pacific MEA Paper and Paperboard Industry Revenue Share (%), by End-user Industry 2024 & 2032
- Figure 40: Asia Pacific MEA Paper and Paperboard Industry Revenue (Million), by Country 2024 & 2032
- Figure 41: Asia Pacific MEA Paper and Paperboard Industry Revenue Share (%), by Country 2024 & 2032
List of Tables
- Table 1: Global MEA Paper and Paperboard Industry Revenue Million Forecast, by Region 2019 & 2032
- Table 2: Global MEA Paper and Paperboard Industry Revenue Million Forecast, by Type 2019 & 2032
- Table 3: Global MEA Paper and Paperboard Industry Revenue Million Forecast, by End-user Industry 2019 & 2032
- Table 4: Global MEA Paper and Paperboard Industry Revenue Million Forecast, by Region 2019 & 2032
- Table 5: Global MEA Paper and Paperboard Industry Revenue Million Forecast, by Country 2019 & 2032
- Table 6: MEA Paper and Paperboard Industry Revenue (Million) Forecast, by Application 2019 & 2032
- Table 7: Global MEA Paper and Paperboard Industry Revenue Million Forecast, by Country 2019 & 2032
- Table 8: MEA Paper and Paperboard Industry Revenue (Million) Forecast, by Application 2019 & 2032
- Table 9: Global MEA Paper and Paperboard Industry Revenue Million Forecast, by Country 2019 & 2032
- Table 10: MEA Paper and Paperboard Industry Revenue (Million) Forecast, by Application 2019 & 2032
- Table 11: Global MEA Paper and Paperboard Industry Revenue Million Forecast, by Country 2019 & 2032
- Table 12: MEA Paper and Paperboard Industry Revenue (Million) Forecast, by Application 2019 & 2032
- Table 13: Global MEA Paper and Paperboard Industry Revenue Million Forecast, by Country 2019 & 2032
- Table 14: MEA Paper and Paperboard Industry Revenue (Million) Forecast, by Application 2019 & 2032
- Table 15: Global MEA Paper and Paperboard Industry Revenue Million Forecast, by Type 2019 & 2032
- Table 16: Global MEA Paper and Paperboard Industry Revenue Million Forecast, by End-user Industry 2019 & 2032
- Table 17: Global MEA Paper and Paperboard Industry Revenue Million Forecast, by Country 2019 & 2032
- Table 18: United States MEA Paper and Paperboard Industry Revenue (Million) Forecast, by Application 2019 & 2032
- Table 19: Canada MEA Paper and Paperboard Industry Revenue (Million) Forecast, by Application 2019 & 2032
- Table 20: Mexico MEA Paper and Paperboard Industry Revenue (Million) Forecast, by Application 2019 & 2032
- Table 21: Global MEA Paper and Paperboard Industry Revenue Million Forecast, by Type 2019 & 2032
- Table 22: Global MEA Paper and Paperboard Industry Revenue Million Forecast, by End-user Industry 2019 & 2032
- Table 23: Global MEA Paper and Paperboard Industry Revenue Million Forecast, by Country 2019 & 2032
- Table 24: Brazil MEA Paper and Paperboard Industry Revenue (Million) Forecast, by Application 2019 & 2032
- Table 25: Argentina MEA Paper and Paperboard Industry Revenue (Million) Forecast, by Application 2019 & 2032
- Table 26: Rest of South America MEA Paper and Paperboard Industry Revenue (Million) Forecast, by Application 2019 & 2032
- Table 27: Global MEA Paper and Paperboard Industry Revenue Million Forecast, by Type 2019 & 2032
- Table 28: Global MEA Paper and Paperboard Industry Revenue Million Forecast, by End-user Industry 2019 & 2032
- Table 29: Global MEA Paper and Paperboard Industry Revenue Million Forecast, by Country 2019 & 2032
- Table 30: United Kingdom MEA Paper and Paperboard Industry Revenue (Million) Forecast, by Application 2019 & 2032
- Table 31: Germany MEA Paper and Paperboard Industry Revenue (Million) Forecast, by Application 2019 & 2032
- Table 32: France MEA Paper and Paperboard Industry Revenue (Million) Forecast, by Application 2019 & 2032
- Table 33: Italy MEA Paper and Paperboard Industry Revenue (Million) Forecast, by Application 2019 & 2032
- Table 34: Spain MEA Paper and Paperboard Industry Revenue (Million) Forecast, by Application 2019 & 2032
- Table 35: Russia MEA Paper and Paperboard Industry Revenue (Million) Forecast, by Application 2019 & 2032
- Table 36: Benelux MEA Paper and Paperboard Industry Revenue (Million) Forecast, by Application 2019 & 2032
- Table 37: Nordics MEA Paper and Paperboard Industry Revenue (Million) Forecast, by Application 2019 & 2032
- Table 38: Rest of Europe MEA Paper and Paperboard Industry Revenue (Million) Forecast, by Application 2019 & 2032
- Table 39: Global MEA Paper and Paperboard Industry Revenue Million Forecast, by Type 2019 & 2032
- Table 40: Global MEA Paper and Paperboard Industry Revenue Million Forecast, by End-user Industry 2019 & 2032
- Table 41: Global MEA Paper and Paperboard Industry Revenue Million Forecast, by Country 2019 & 2032
- Table 42: Turkey MEA Paper and Paperboard Industry Revenue (Million) Forecast, by Application 2019 & 2032
- Table 43: Israel MEA Paper and Paperboard Industry Revenue (Million) Forecast, by Application 2019 & 2032
- Table 44: GCC MEA Paper and Paperboard Industry Revenue (Million) Forecast, by Application 2019 & 2032
- Table 45: North Africa MEA Paper and Paperboard Industry Revenue (Million) Forecast, by Application 2019 & 2032
- Table 46: South Africa MEA Paper and Paperboard Industry Revenue (Million) Forecast, by Application 2019 & 2032
- Table 47: Rest of Middle East & Africa MEA Paper and Paperboard Industry Revenue (Million) Forecast, by Application 2019 & 2032
- Table 48: Global MEA Paper and Paperboard Industry Revenue Million Forecast, by Type 2019 & 2032
- Table 49: Global MEA Paper and Paperboard Industry Revenue Million Forecast, by End-user Industry 2019 & 2032
- Table 50: Global MEA Paper and Paperboard Industry Revenue Million Forecast, by Country 2019 & 2032
- Table 51: China MEA Paper and Paperboard Industry Revenue (Million) Forecast, by Application 2019 & 2032
- Table 52: India MEA Paper and Paperboard Industry Revenue (Million) Forecast, by Application 2019 & 2032
- Table 53: Japan MEA Paper and Paperboard Industry Revenue (Million) Forecast, by Application 2019 & 2032
- Table 54: South Korea MEA Paper and Paperboard Industry Revenue (Million) Forecast, by Application 2019 & 2032
- Table 55: ASEAN MEA Paper and Paperboard Industry Revenue (Million) Forecast, by Application 2019 & 2032
- Table 56: Oceania MEA Paper and Paperboard Industry Revenue (Million) Forecast, by Application 2019 & 2032
- Table 57: Rest of Asia Pacific MEA Paper and Paperboard Industry Revenue (Million) Forecast, by Application 2019 & 2032
Frequently Asked Questions
1. What is the projected Compound Annual Growth Rate (CAGR) of the MEA Paper and Paperboard Industry?
The projected CAGR is approximately 4.00%.
2. Which companies are prominent players in the MEA Paper and Paperboard Industry?
Key companies in the market include Matco Packaging LLC, Al Rumanah Packaging, Hotpack Packaging Industries LLC, Global Carton Boxes Manufacturing LLC*List Not Exhaustive, United Carton Industries Company (UCIC), IFFCO, Tarboosh Packaging Co LLC, Green Packaging Boxes Ind LLC, Arabian Packaging Co LLC, International Paper.
3. What are the main segments of the MEA Paper and Paperboard Industry?
The market segments include Type, End-user Industry.
4. Can you provide details about the market size?
The market size is estimated to be USD XX Million as of 2022.
5. What are some drivers contributing to market growth?
Introduction of Advanced Packaging Technologies to Increase Sales; Increasing Demand for Packaging from Logistics and Transportation.
6. What are the notable trends driving market growth?
Container Board to Witness the Fastest Market Growth.
7. Are there any restraints impacting market growth?
High Costs and Import Duties Pose a Challenge for New Customers; Fluctuations in Raw Material Prices.
8. Can you provide examples of recent developments in the market?
N/A
9. What pricing options are available for accessing the report?
Pricing options include single-user, multi-user, and enterprise licenses priced at USD 4750, USD 4950, and USD 6800 respectively.
10. Is the market size provided in terms of value or volume?
The market size is provided in terms of value, measured in Million.
11. Are there any specific market keywords associated with the report?
Yes, the market keyword associated with the report is "MEA Paper and Paperboard Industry," which aids in identifying and referencing the specific market segment covered.
12. How do I determine which pricing option suits my needs best?
The pricing options vary based on user requirements and access needs. Individual users may opt for single-user licenses, while businesses requiring broader access may choose multi-user or enterprise licenses for cost-effective access to the report.
13. Are there any additional resources or data provided in the MEA Paper and Paperboard Industry report?
While the report offers comprehensive insights, it's advisable to review the specific contents or supplementary materials provided to ascertain if additional resources or data are available.
14. How can I stay updated on further developments or reports in the MEA Paper and Paperboard Industry?
To stay informed about further developments, trends, and reports in the MEA Paper and Paperboard Industry, consider subscribing to industry newsletters, following relevant companies and organizations, or regularly checking reputable industry news sources and publications.
Methodology
Step 1 - Identification of Relevant Samples Size from Population Database


Step 2 - Approaches for Defining Global Market Size (Value, Volume* & Price*)

Note*: In applicable scenarios
Step 3 - Data Sources
Primary Research
- Web Analytics
- Survey Reports
- Research Institute
- Latest Research Reports
- Opinion Leaders
Secondary Research
- Annual Reports
- White Paper
- Latest Press Release
- Industry Association
- Paid Database
- Investor Presentations

Step 4 - Data Triangulation
Involves using different sources of information in order to increase the validity of a study
These sources are likely to be stakeholders in a program - participants, other researchers, program staff, other community members, and so on.
Then we put all data in single framework & apply various statistical tools to find out the dynamic on the market.
During the analysis stage, feedback from the stakeholder groups would be compared to determine areas of agreement as well as areas of divergence
