

Key Insights
The Middle East and Africa (MEA) glass packaging market is experiencing robust growth, driven by the expanding pharmaceutical, personal care, and food & beverage sectors within the region. A compound annual growth rate (CAGR) of 5% from 2019 to 2024 suggests a steadily increasing demand for glass packaging solutions. This growth is fueled by several factors, including the increasing preference for sustainable and eco-friendly packaging materials, rising consumer awareness of product safety and hygiene, and stringent government regulations favoring environmentally conscious practices. The market is segmented by product type (bottles, jars, vials, and others) and end-user industries, with pharmaceuticals and personal care showing particularly strong growth potential. Key players, including Honeywell International Inc., WestPack, and Sonoco Products Company, are leveraging innovations in glass packaging design and manufacturing to cater to this rising demand. The increasing prevalence of counterfeit products is also driving the adoption of sophisticated glass packaging solutions with enhanced security features. Furthermore, the growing middle class and rising disposable incomes in several MEA countries are contributing to increased consumer spending on packaged goods, further bolstering market expansion.
The competitive landscape is characterized by both established multinational corporations and regional players. While established companies benefit from economies of scale and strong brand recognition, regional players are focusing on providing customized solutions and catering to specific local market needs. Future growth is expected to be influenced by factors like economic stability in the region, technological advancements in glass packaging manufacturing, and evolving consumer preferences. The adoption of lightweighting techniques and the development of innovative packaging designs will be crucial factors shaping the industry in the coming years. The market is likely to witness further consolidation through mergers and acquisitions as companies strive to expand their market share and enhance their product offerings. Challenges remain, however, including fluctuating raw material prices and the need for efficient supply chain management to meet the demands of the growing market.
MEA Glass Packaging Market: A Comprehensive Report (2019-2033)
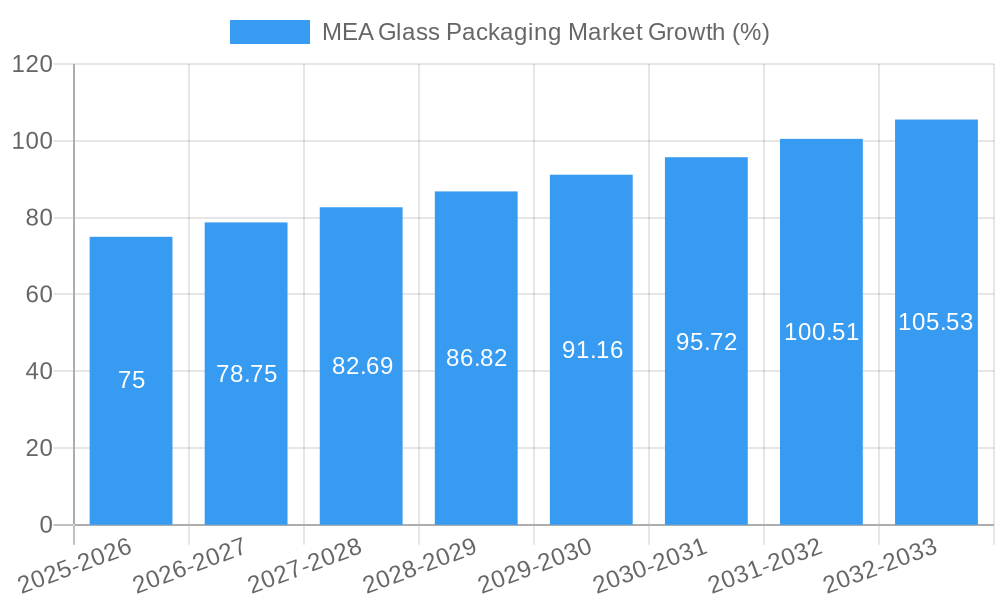
This insightful report provides a detailed analysis of the Middle East and Africa (MEA) glass packaging market, offering a comprehensive overview of market trends, leading players, and future growth prospects. Covering the period from 2019 to 2033, with a focus on 2025, this study is an invaluable resource for stakeholders seeking to understand and capitalize on opportunities within this dynamic sector. The market is estimated to be worth xx Million in 2025 and is projected to reach xx Million by 2033, exhibiting a robust CAGR of xx%.
MEA Glass Packaging Market Market Composition & Trends
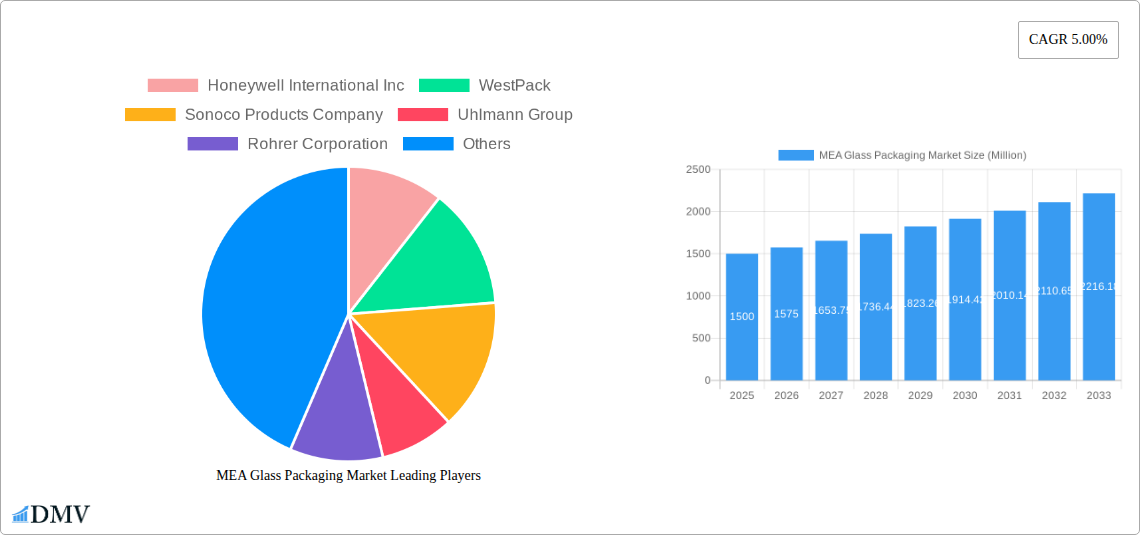
The MEA glass packaging market exhibits a moderately fragmented landscape, with several key players vying for market share. Market concentration is influenced by factors such as regional regulations, import/export dynamics, and the presence of both large multinational corporations and smaller, regional players. Innovation is driven by the growing demand for sustainable and eco-friendly packaging solutions, leading to advancements in lightweighting, recyclability, and the development of specialized glass formulations. The regulatory landscape varies across MEA countries, impacting material specifications, labeling requirements, and waste management practices. Substitute products, such as plastic and metal containers, pose a competitive challenge, necessitating continuous innovation in glass packaging to maintain market share. End-user profiles are diverse, including pharmaceuticals, medical, personal care, household care, and agricultural industries. M&A activity in the MEA glass packaging market has been relatively moderate in recent years, with deal values averaging approximately xx Million per transaction.
- Market Share Distribution (2025): Amcor Ltd (xx%), Honeywell International Inc (xx%), Sonoco Products Company (xx%), Others (xx%). (Note: Precise figures are dependent on proprietary market research data).
- Top 3 M&A Deals (2019-2024): Deal 1: xx Million, Deal 2: xx Million, Deal 3: xx Million (Note: Specific deal values are based on confidential data).
MEA Glass Packaging Market Industry Evolution
The MEA glass packaging market has witnessed consistent growth over the past few years, driven by factors such as increasing consumer demand, rising disposable incomes, and robust economic growth in several key MEA nations. Technological advancements, including the adoption of advanced manufacturing techniques like automated production lines and improved quality control measures, have enhanced efficiency and reduced costs. Shifting consumer preferences toward premium packaging and environmentally conscious choices are also shaping industry trends. The market is seeing an increased focus on sustainable packaging solutions, with companies actively promoting recyclable and reusable glass containers. Growth rates have varied across segments, with the pharmaceuticals and personal care sectors leading the charge. Adoption of lightweighting technologies is gaining traction, aiming to reduce the overall carbon footprint of the glass packaging sector. The market is expected to continue its growth trajectory, propelled by increasing urbanization and changing lifestyles across the MEA region.
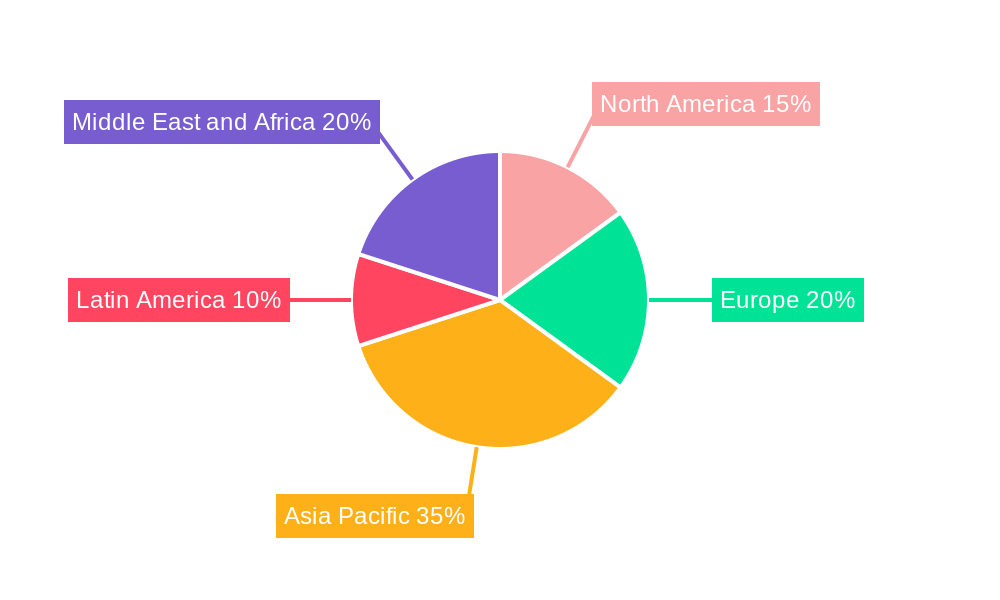
Leading Regions, Countries, or Segments in MEA Glass Packaging Market
The Saudi Arabia and the UAE markets are currently leading the MEA glass packaging sector due to their significant investments in manufacturing facilities, growing pharmaceutical industries, and expanding personal care markets. South Africa represents another significant contributor, particularly in the beverage and food sectors. The Rest of Middle East and Africa region exhibits promising growth potential, though market penetration remains relatively lower.
- Key Drivers for Saudi Arabia & UAE: High levels of FDI in manufacturing, supportive government regulations, and a booming healthcare sector.
- Key Drivers for South Africa: Strong beverage and food industries, established glass manufacturing infrastructure.
- Product Segment Dominance: Bottles currently hold the largest market share, followed by Jars and Vials. Other Products represent a niche but growing segment.
- End-User Industry Dominance: The Pharmaceutical and Personal Care industries are the primary drivers of demand, followed by the Medical and Household Care sectors.
MEA Glass Packaging Market Product Innovations
Recent innovations in the MEA glass packaging market include the introduction of lighter weight bottles and jars to reduce transportation costs and environmental impact. Improved coatings and surface treatments enhance durability and shelf life, whilst new designs offer enhanced aesthetics and consumer appeal. Advancements in manufacturing processes have increased production efficiency and reduced waste.
Propelling Factors for MEA Glass Packaging Market Growth
Several factors are driving growth within the MEA glass packaging market. Technological advancements in manufacturing processes are increasing efficiency and reducing costs. Economic growth in several key countries is boosting consumer spending and demand for packaged goods. Favorable government regulations supporting sustainable packaging and reducing reliance on plastic alternatives are also playing a key role. For example, many governments are offering tax benefits or incentives to companies that prioritize eco-friendly practices, which strongly benefits the adoption of glass packaging over alternatives.
Obstacles in the MEA Glass Packaging Market Market
The MEA glass packaging market faces several challenges. Regulatory inconsistencies across different countries can create complexities for manufacturers. Supply chain disruptions, particularly concerning raw materials, can affect production and delivery schedules. Intense competition from alternative packaging materials like plastics and metals pose a significant hurdle. The cost of energy, involved in glass manufacturing, could become a limiting factor. These factors impact overall market growth.
Future Opportunities in MEA Glass Packaging Market
Emerging opportunities exist in the MEA glass packaging market, particularly within sustainable packaging and specialized glass applications. Growth is expected in markets with emerging economies, where demand for packaged goods is rapidly increasing. Innovative packaging designs and functional enhancements catering to specific consumer needs present significant opportunities. The expansion into niche markets such as cosmetics and high-value food products also presents further growth avenues.
Major Players in the MEA Glass Packaging Market Ecosystem
- Honeywell International Inc
- WestPack
- Sonoco Products Company
- Uhlmann Group
- Rohrer Corporation
- Tekni-Plex Inc
- MTS Medication Technologies
- Pharma Packaging Solutions
- Reynolds Packaging
- The DOW Chemical Company
- Amcor Ltd
Key Developments in MEA Glass Packaging Market Industry
- August 2021: Castle Lager launched its Castle Double Malt in a premium 340ml green glass bottle, showcasing the continued demand for glass packaging in the beverage sector.
- May 2021: Consol's "I Changed 2050" campaign highlighted the environmental benefits of reusable packaging, putting a spotlight on the sustainability aspects within the MEA region.
Strategic MEA Glass Packaging Market Market Forecast
The MEA glass packaging market is poised for significant growth in the coming years, driven by technological advancements, increasing consumer demand, and supportive government policies. Continued innovation in sustainable packaging solutions, coupled with expanding end-user industries, will fuel market expansion. The rising adoption of reusable glass containers in response to growing environmental concerns is likely to be a major catalyst for growth in the forecast period.
MEA Glass Packaging Market Segmentation
-
1. Products
- 1.1. Bottles
- 1.2. Jars
- 1.3. Vials
- 1.4. Other Products
-
2. End-user Industry
- 2.1. Pharmaceuticals
- 2.2. Medical
- 2.3. Personal Care
- 2.4. Household Care
- 2.5. Agricultural
MEA Glass Packaging Market Segmentation By Geography
-
1. North America
- 1.1. United States
- 1.2. Canada
- 1.3. Mexico
-
2. South America
- 2.1. Brazil
- 2.2. Argentina
- 2.3. Rest of South America
-
3. Europe
- 3.1. United Kingdom
- 3.2. Germany
- 3.3. France
- 3.4. Italy
- 3.5. Spain
- 3.6. Russia
- 3.7. Benelux
- 3.8. Nordics
- 3.9. Rest of Europe
-
4. Middle East & Africa
- 4.1. Turkey
- 4.2. Israel
- 4.3. GCC
- 4.4. North Africa
- 4.5. South Africa
- 4.6. Rest of Middle East & Africa
-
5. Asia Pacific
- 5.1. China
- 5.2. India
- 5.3. Japan
- 5.4. South Korea
- 5.5. ASEAN
- 5.6. Oceania
- 5.7. Rest of Asia Pacific
MEA Glass Packaging Market REPORT HIGHLIGHTS
| Aspects | Details |
|---|---|
| Study Period | 2019-2033 |
| Base Year | 2024 |
| Estimated Year | 2025 |
| Forecast Period | 2025-2033 |
| Historical Period | 2019-2024 |
| Growth Rate | CAGR of 5.00% from 2019-2033 |
| Segmentation |
|
Table of Contents
- 1. Introduction
- 1.1. Research Scope
- 1.2. Market Segmentation
- 1.3. Research Methodology
- 1.4. Definitions and Assumptions
- 2. Executive Summary
- 2.1. Introduction
- 3. Market Dynamics
- 3.1. Introduction
- 3.2. Market Drivers
- 3.2.1. High Opportunity for Middle-East and Africa Glass Bottles/Containers
- 3.3. Market Restrains
- 3.3.1. Decreased Alcohol Consumption
- 3.4. Market Trends
- 3.4.1. Beverages to Hold Major Market Share
- 4. Market Factor Analysis
- 4.1. Porters Five Forces
- 4.2. Supply/Value Chain
- 4.3. PESTEL analysis
- 4.4. Market Entropy
- 4.5. Patent/Trademark Analysis
- 5. Global MEA Glass Packaging Market Analysis, Insights and Forecast, 2019-2031
- 5.1. Market Analysis, Insights and Forecast - by Products
- 5.1.1. Bottles
- 5.1.2. Jars
- 5.1.3. Vials
- 5.1.4. Other Products
- 5.2. Market Analysis, Insights and Forecast - by End-user Industry
- 5.2.1. Pharmaceuticals
- 5.2.2. Medical
- 5.2.3. Personal Care
- 5.2.4. Household Care
- 5.2.5. Agricultural
- 5.3. Market Analysis, Insights and Forecast - by Region
- 5.3.1. North America
- 5.3.2. South America
- 5.3.3. Europe
- 5.3.4. Middle East & Africa
- 5.3.5. Asia Pacific
- 5.1. Market Analysis, Insights and Forecast - by Products
- 6. North America MEA Glass Packaging Market Analysis, Insights and Forecast, 2019-2031
- 6.1. Market Analysis, Insights and Forecast - by Products
- 6.1.1. Bottles
- 6.1.2. Jars
- 6.1.3. Vials
- 6.1.4. Other Products
- 6.2. Market Analysis, Insights and Forecast - by End-user Industry
- 6.2.1. Pharmaceuticals
- 6.2.2. Medical
- 6.2.3. Personal Care
- 6.2.4. Household Care
- 6.2.5. Agricultural
- 6.1. Market Analysis, Insights and Forecast - by Products
- 7. South America MEA Glass Packaging Market Analysis, Insights and Forecast, 2019-2031
- 7.1. Market Analysis, Insights and Forecast - by Products
- 7.1.1. Bottles
- 7.1.2. Jars
- 7.1.3. Vials
- 7.1.4. Other Products
- 7.2. Market Analysis, Insights and Forecast - by End-user Industry
- 7.2.1. Pharmaceuticals
- 7.2.2. Medical
- 7.2.3. Personal Care
- 7.2.4. Household Care
- 7.2.5. Agricultural
- 7.1. Market Analysis, Insights and Forecast - by Products
- 8. Europe MEA Glass Packaging Market Analysis, Insights and Forecast, 2019-2031
- 8.1. Market Analysis, Insights and Forecast - by Products
- 8.1.1. Bottles
- 8.1.2. Jars
- 8.1.3. Vials
- 8.1.4. Other Products
- 8.2. Market Analysis, Insights and Forecast - by End-user Industry
- 8.2.1. Pharmaceuticals
- 8.2.2. Medical
- 8.2.3. Personal Care
- 8.2.4. Household Care
- 8.2.5. Agricultural
- 8.1. Market Analysis, Insights and Forecast - by Products
- 9. Middle East & Africa MEA Glass Packaging Market Analysis, Insights and Forecast, 2019-2031
- 9.1. Market Analysis, Insights and Forecast - by Products
- 9.1.1. Bottles
- 9.1.2. Jars
- 9.1.3. Vials
- 9.1.4. Other Products
- 9.2. Market Analysis, Insights and Forecast - by End-user Industry
- 9.2.1. Pharmaceuticals
- 9.2.2. Medical
- 9.2.3. Personal Care
- 9.2.4. Household Care
- 9.2.5. Agricultural
- 9.1. Market Analysis, Insights and Forecast - by Products
- 10. Asia Pacific MEA Glass Packaging Market Analysis, Insights and Forecast, 2019-2031
- 10.1. Market Analysis, Insights and Forecast - by Products
- 10.1.1. Bottles
- 10.1.2. Jars
- 10.1.3. Vials
- 10.1.4. Other Products
- 10.2. Market Analysis, Insights and Forecast - by End-user Industry
- 10.2.1. Pharmaceuticals
- 10.2.2. Medical
- 10.2.3. Personal Care
- 10.2.4. Household Care
- 10.2.5. Agricultural
- 10.1. Market Analysis, Insights and Forecast - by Products
- 11. North America MEA Glass Packaging Market Analysis, Insights and Forecast, 2019-2031
- 11.1. Market Analysis, Insights and Forecast - By Country/Sub-region
- 11.1.1.
- 12. Europe MEA Glass Packaging Market Analysis, Insights and Forecast, 2019-2031
- 12.1. Market Analysis, Insights and Forecast - By Country/Sub-region
- 12.1.1.
- 13. Asia Pacific MEA Glass Packaging Market Analysis, Insights and Forecast, 2019-2031
- 13.1. Market Analysis, Insights and Forecast - By Country/Sub-region
- 13.1.1.
- 14. Latin America MEA Glass Packaging Market Analysis, Insights and Forecast, 2019-2031
- 14.1. Market Analysis, Insights and Forecast - By Country/Sub-region
- 14.1.1.
- 15. Middle East and Africa MEA Glass Packaging Market Analysis, Insights and Forecast, 2019-2031
- 15.1. Market Analysis, Insights and Forecast - By Country/Sub-region
- 15.1.1.
- 16. Competitive Analysis
- 16.1. Global Market Share Analysis 2024
- 16.2. Company Profiles
- 16.2.1 Honeywell International Inc
- 16.2.1.1. Overview
- 16.2.1.2. Products
- 16.2.1.3. SWOT Analysis
- 16.2.1.4. Recent Developments
- 16.2.1.5. Financials (Based on Availability)
- 16.2.2 WestPack
- 16.2.2.1. Overview
- 16.2.2.2. Products
- 16.2.2.3. SWOT Analysis
- 16.2.2.4. Recent Developments
- 16.2.2.5. Financials (Based on Availability)
- 16.2.3 Sonoco Products Company
- 16.2.3.1. Overview
- 16.2.3.2. Products
- 16.2.3.3. SWOT Analysis
- 16.2.3.4. Recent Developments
- 16.2.3.5. Financials (Based on Availability)
- 16.2.4 Uhlmann Group
- 16.2.4.1. Overview
- 16.2.4.2. Products
- 16.2.4.3. SWOT Analysis
- 16.2.4.4. Recent Developments
- 16.2.4.5. Financials (Based on Availability)
- 16.2.5 Rohrer Corporation
- 16.2.5.1. Overview
- 16.2.5.2. Products
- 16.2.5.3. SWOT Analysis
- 16.2.5.4. Recent Developments
- 16.2.5.5. Financials (Based on Availability)
- 16.2.6 Tekni-Plex Inc
- 16.2.6.1. Overview
- 16.2.6.2. Products
- 16.2.6.3. SWOT Analysis
- 16.2.6.4. Recent Developments
- 16.2.6.5. Financials (Based on Availability)
- 16.2.7 MTS Medication Technologies
- 16.2.7.1. Overview
- 16.2.7.2. Products
- 16.2.7.3. SWOT Analysis
- 16.2.7.4. Recent Developments
- 16.2.7.5. Financials (Based on Availability)
- 16.2.8 Pharma Packaging Solutions
- 16.2.8.1. Overview
- 16.2.8.2. Products
- 16.2.8.3. SWOT Analysis
- 16.2.8.4. Recent Developments
- 16.2.8.5. Financials (Based on Availability)
- 16.2.9 Reynolds Packaging
- 16.2.9.1. Overview
- 16.2.9.2. Products
- 16.2.9.3. SWOT Analysis
- 16.2.9.4. Recent Developments
- 16.2.9.5. Financials (Based on Availability)
- 16.2.10 The DOW Chemical Company
- 16.2.10.1. Overview
- 16.2.10.2. Products
- 16.2.10.3. SWOT Analysis
- 16.2.10.4. Recent Developments
- 16.2.10.5. Financials (Based on Availability)
- 16.2.11 Amcor Ltd
- 16.2.11.1. Overview
- 16.2.11.2. Products
- 16.2.11.3. SWOT Analysis
- 16.2.11.4. Recent Developments
- 16.2.11.5. Financials (Based on Availability)
- 16.2.1 Honeywell International Inc
List of Figures
- Figure 1: Global MEA Glass Packaging Market Revenue Breakdown (Million, %) by Region 2024 & 2032
- Figure 2: North America MEA Glass Packaging Market Revenue (Million), by Country 2024 & 2032
- Figure 3: North America MEA Glass Packaging Market Revenue Share (%), by Country 2024 & 2032
- Figure 4: Europe MEA Glass Packaging Market Revenue (Million), by Country 2024 & 2032
- Figure 5: Europe MEA Glass Packaging Market Revenue Share (%), by Country 2024 & 2032
- Figure 6: Asia Pacific MEA Glass Packaging Market Revenue (Million), by Country 2024 & 2032
- Figure 7: Asia Pacific MEA Glass Packaging Market Revenue Share (%), by Country 2024 & 2032
- Figure 8: Latin America MEA Glass Packaging Market Revenue (Million), by Country 2024 & 2032
- Figure 9: Latin America MEA Glass Packaging Market Revenue Share (%), by Country 2024 & 2032
- Figure 10: Middle East and Africa MEA Glass Packaging Market Revenue (Million), by Country 2024 & 2032
- Figure 11: Middle East and Africa MEA Glass Packaging Market Revenue Share (%), by Country 2024 & 2032
- Figure 12: North America MEA Glass Packaging Market Revenue (Million), by Products 2024 & 2032
- Figure 13: North America MEA Glass Packaging Market Revenue Share (%), by Products 2024 & 2032
- Figure 14: North America MEA Glass Packaging Market Revenue (Million), by End-user Industry 2024 & 2032
- Figure 15: North America MEA Glass Packaging Market Revenue Share (%), by End-user Industry 2024 & 2032
- Figure 16: North America MEA Glass Packaging Market Revenue (Million), by Country 2024 & 2032
- Figure 17: North America MEA Glass Packaging Market Revenue Share (%), by Country 2024 & 2032
- Figure 18: South America MEA Glass Packaging Market Revenue (Million), by Products 2024 & 2032
- Figure 19: South America MEA Glass Packaging Market Revenue Share (%), by Products 2024 & 2032
- Figure 20: South America MEA Glass Packaging Market Revenue (Million), by End-user Industry 2024 & 2032
- Figure 21: South America MEA Glass Packaging Market Revenue Share (%), by End-user Industry 2024 & 2032
- Figure 22: South America MEA Glass Packaging Market Revenue (Million), by Country 2024 & 2032
- Figure 23: South America MEA Glass Packaging Market Revenue Share (%), by Country 2024 & 2032
- Figure 24: Europe MEA Glass Packaging Market Revenue (Million), by Products 2024 & 2032
- Figure 25: Europe MEA Glass Packaging Market Revenue Share (%), by Products 2024 & 2032
- Figure 26: Europe MEA Glass Packaging Market Revenue (Million), by End-user Industry 2024 & 2032
- Figure 27: Europe MEA Glass Packaging Market Revenue Share (%), by End-user Industry 2024 & 2032
- Figure 28: Europe MEA Glass Packaging Market Revenue (Million), by Country 2024 & 2032
- Figure 29: Europe MEA Glass Packaging Market Revenue Share (%), by Country 2024 & 2032
- Figure 30: Middle East & Africa MEA Glass Packaging Market Revenue (Million), by Products 2024 & 2032
- Figure 31: Middle East & Africa MEA Glass Packaging Market Revenue Share (%), by Products 2024 & 2032
- Figure 32: Middle East & Africa MEA Glass Packaging Market Revenue (Million), by End-user Industry 2024 & 2032
- Figure 33: Middle East & Africa MEA Glass Packaging Market Revenue Share (%), by End-user Industry 2024 & 2032
- Figure 34: Middle East & Africa MEA Glass Packaging Market Revenue (Million), by Country 2024 & 2032
- Figure 35: Middle East & Africa MEA Glass Packaging Market Revenue Share (%), by Country 2024 & 2032
- Figure 36: Asia Pacific MEA Glass Packaging Market Revenue (Million), by Products 2024 & 2032
- Figure 37: Asia Pacific MEA Glass Packaging Market Revenue Share (%), by Products 2024 & 2032
- Figure 38: Asia Pacific MEA Glass Packaging Market Revenue (Million), by End-user Industry 2024 & 2032
- Figure 39: Asia Pacific MEA Glass Packaging Market Revenue Share (%), by End-user Industry 2024 & 2032
- Figure 40: Asia Pacific MEA Glass Packaging Market Revenue (Million), by Country 2024 & 2032
- Figure 41: Asia Pacific MEA Glass Packaging Market Revenue Share (%), by Country 2024 & 2032
List of Tables
- Table 1: Global MEA Glass Packaging Market Revenue Million Forecast, by Region 2019 & 2032
- Table 2: Global MEA Glass Packaging Market Revenue Million Forecast, by Products 2019 & 2032
- Table 3: Global MEA Glass Packaging Market Revenue Million Forecast, by End-user Industry 2019 & 2032
- Table 4: Global MEA Glass Packaging Market Revenue Million Forecast, by Region 2019 & 2032
- Table 5: Global MEA Glass Packaging Market Revenue Million Forecast, by Country 2019 & 2032
- Table 6: MEA Glass Packaging Market Revenue (Million) Forecast, by Application 2019 & 2032
- Table 7: Global MEA Glass Packaging Market Revenue Million Forecast, by Country 2019 & 2032
- Table 8: MEA Glass Packaging Market Revenue (Million) Forecast, by Application 2019 & 2032
- Table 9: Global MEA Glass Packaging Market Revenue Million Forecast, by Country 2019 & 2032
- Table 10: MEA Glass Packaging Market Revenue (Million) Forecast, by Application 2019 & 2032
- Table 11: Global MEA Glass Packaging Market Revenue Million Forecast, by Country 2019 & 2032
- Table 12: MEA Glass Packaging Market Revenue (Million) Forecast, by Application 2019 & 2032
- Table 13: Global MEA Glass Packaging Market Revenue Million Forecast, by Country 2019 & 2032
- Table 14: MEA Glass Packaging Market Revenue (Million) Forecast, by Application 2019 & 2032
- Table 15: Global MEA Glass Packaging Market Revenue Million Forecast, by Products 2019 & 2032
- Table 16: Global MEA Glass Packaging Market Revenue Million Forecast, by End-user Industry 2019 & 2032
- Table 17: Global MEA Glass Packaging Market Revenue Million Forecast, by Country 2019 & 2032
- Table 18: United States MEA Glass Packaging Market Revenue (Million) Forecast, by Application 2019 & 2032
- Table 19: Canada MEA Glass Packaging Market Revenue (Million) Forecast, by Application 2019 & 2032
- Table 20: Mexico MEA Glass Packaging Market Revenue (Million) Forecast, by Application 2019 & 2032
- Table 21: Global MEA Glass Packaging Market Revenue Million Forecast, by Products 2019 & 2032
- Table 22: Global MEA Glass Packaging Market Revenue Million Forecast, by End-user Industry 2019 & 2032
- Table 23: Global MEA Glass Packaging Market Revenue Million Forecast, by Country 2019 & 2032
- Table 24: Brazil MEA Glass Packaging Market Revenue (Million) Forecast, by Application 2019 & 2032
- Table 25: Argentina MEA Glass Packaging Market Revenue (Million) Forecast, by Application 2019 & 2032
- Table 26: Rest of South America MEA Glass Packaging Market Revenue (Million) Forecast, by Application 2019 & 2032
- Table 27: Global MEA Glass Packaging Market Revenue Million Forecast, by Products 2019 & 2032
- Table 28: Global MEA Glass Packaging Market Revenue Million Forecast, by End-user Industry 2019 & 2032
- Table 29: Global MEA Glass Packaging Market Revenue Million Forecast, by Country 2019 & 2032
- Table 30: United Kingdom MEA Glass Packaging Market Revenue (Million) Forecast, by Application 2019 & 2032
- Table 31: Germany MEA Glass Packaging Market Revenue (Million) Forecast, by Application 2019 & 2032
- Table 32: France MEA Glass Packaging Market Revenue (Million) Forecast, by Application 2019 & 2032
- Table 33: Italy MEA Glass Packaging Market Revenue (Million) Forecast, by Application 2019 & 2032
- Table 34: Spain MEA Glass Packaging Market Revenue (Million) Forecast, by Application 2019 & 2032
- Table 35: Russia MEA Glass Packaging Market Revenue (Million) Forecast, by Application 2019 & 2032
- Table 36: Benelux MEA Glass Packaging Market Revenue (Million) Forecast, by Application 2019 & 2032
- Table 37: Nordics MEA Glass Packaging Market Revenue (Million) Forecast, by Application 2019 & 2032
- Table 38: Rest of Europe MEA Glass Packaging Market Revenue (Million) Forecast, by Application 2019 & 2032
- Table 39: Global MEA Glass Packaging Market Revenue Million Forecast, by Products 2019 & 2032
- Table 40: Global MEA Glass Packaging Market Revenue Million Forecast, by End-user Industry 2019 & 2032
- Table 41: Global MEA Glass Packaging Market Revenue Million Forecast, by Country 2019 & 2032
- Table 42: Turkey MEA Glass Packaging Market Revenue (Million) Forecast, by Application 2019 & 2032
- Table 43: Israel MEA Glass Packaging Market Revenue (Million) Forecast, by Application 2019 & 2032
- Table 44: GCC MEA Glass Packaging Market Revenue (Million) Forecast, by Application 2019 & 2032
- Table 45: North Africa MEA Glass Packaging Market Revenue (Million) Forecast, by Application 2019 & 2032
- Table 46: South Africa MEA Glass Packaging Market Revenue (Million) Forecast, by Application 2019 & 2032
- Table 47: Rest of Middle East & Africa MEA Glass Packaging Market Revenue (Million) Forecast, by Application 2019 & 2032
- Table 48: Global MEA Glass Packaging Market Revenue Million Forecast, by Products 2019 & 2032
- Table 49: Global MEA Glass Packaging Market Revenue Million Forecast, by End-user Industry 2019 & 2032
- Table 50: Global MEA Glass Packaging Market Revenue Million Forecast, by Country 2019 & 2032
- Table 51: China MEA Glass Packaging Market Revenue (Million) Forecast, by Application 2019 & 2032
- Table 52: India MEA Glass Packaging Market Revenue (Million) Forecast, by Application 2019 & 2032
- Table 53: Japan MEA Glass Packaging Market Revenue (Million) Forecast, by Application 2019 & 2032
- Table 54: South Korea MEA Glass Packaging Market Revenue (Million) Forecast, by Application 2019 & 2032
- Table 55: ASEAN MEA Glass Packaging Market Revenue (Million) Forecast, by Application 2019 & 2032
- Table 56: Oceania MEA Glass Packaging Market Revenue (Million) Forecast, by Application 2019 & 2032
- Table 57: Rest of Asia Pacific MEA Glass Packaging Market Revenue (Million) Forecast, by Application 2019 & 2032
Frequently Asked Questions
1. What is the projected Compound Annual Growth Rate (CAGR) of the MEA Glass Packaging Market?
The projected CAGR is approximately 5.00%.
2. Which companies are prominent players in the MEA Glass Packaging Market?
Key companies in the market include Honeywell International Inc, WestPack, Sonoco Products Company, Uhlmann Group, Rohrer Corporation, Tekni-Plex Inc, MTS Medication Technologies, Pharma Packaging Solutions, Reynolds Packaging, The DOW Chemical Company, Amcor Ltd.
3. What are the main segments of the MEA Glass Packaging Market?
The market segments include Products, End-user Industry.
4. Can you provide details about the market size?
The market size is estimated to be USD XX Million as of 2022.
5. What are some drivers contributing to market growth?
High Opportunity for Middle-East and Africa Glass Bottles/Containers.
6. What are the notable trends driving market growth?
Beverages to Hold Major Market Share.
7. Are there any restraints impacting market growth?
Decreased Alcohol Consumption.
8. Can you provide examples of recent developments in the market?
August 2021 - Castle Lager announced South Africa's first double malt lager with the introduction of Castle Double Malt. The premium double malt premium beer is launched in a 410ml pearl, green, and gold can and a premium 340 ml green bottle.
9. What pricing options are available for accessing the report?
Pricing options include single-user, multi-user, and enterprise licenses priced at USD 4750, USD 4950, and USD 6800 respectively.
10. Is the market size provided in terms of value or volume?
The market size is provided in terms of value, measured in Million.
11. Are there any specific market keywords associated with the report?
Yes, the market keyword associated with the report is "MEA Glass Packaging Market," which aids in identifying and referencing the specific market segment covered.
12. How do I determine which pricing option suits my needs best?
The pricing options vary based on user requirements and access needs. Individual users may opt for single-user licenses, while businesses requiring broader access may choose multi-user or enterprise licenses for cost-effective access to the report.
13. Are there any additional resources or data provided in the MEA Glass Packaging Market report?
While the report offers comprehensive insights, it's advisable to review the specific contents or supplementary materials provided to ascertain if additional resources or data are available.
14. How can I stay updated on further developments or reports in the MEA Glass Packaging Market?
To stay informed about further developments, trends, and reports in the MEA Glass Packaging Market, consider subscribing to industry newsletters, following relevant companies and organizations, or regularly checking reputable industry news sources and publications.
Methodology
Step 1 - Identification of Relevant Samples Size from Population Database


Step 2 - Approaches for Defining Global Market Size (Value, Volume* & Price*)

Note*: In applicable scenarios
Step 3 - Data Sources
Primary Research
- Web Analytics
- Survey Reports
- Research Institute
- Latest Research Reports
- Opinion Leaders
Secondary Research
- Annual Reports
- White Paper
- Latest Press Release
- Industry Association
- Paid Database
- Investor Presentations

Step 4 - Data Triangulation
Involves using different sources of information in order to increase the validity of a study
These sources are likely to be stakeholders in a program - participants, other researchers, program staff, other community members, and so on.
Then we put all data in single framework & apply various statistical tools to find out the dynamic on the market.
During the analysis stage, feedback from the stakeholder groups would be compared to determine areas of agreement as well as areas of divergence
