

Key Insights
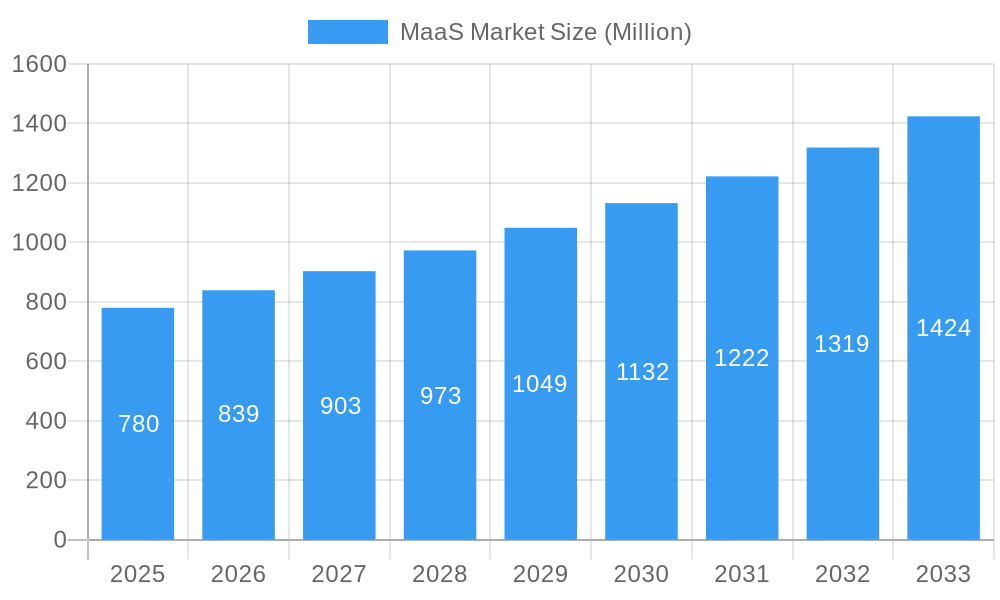
The Mobility as a Service (MaaS) market, valued at $0.78 billion in 2025, is projected to experience robust growth, driven by increasing urbanization, rising fuel costs, and a growing preference for sustainable transportation solutions. The 7.43% CAGR indicates a significant expansion over the forecast period (2025-2033). Key drivers include the integration of various transportation modes (car, bus, bike) into seamless, user-friendly platforms, expanding public transportation networks in major cities, and the increasing adoption of smart city initiatives. The market segmentation reveals strong demand across both public and private transportation sectors, with significant potential for growth in emerging markets like Asia-Pacific. Companies like Uber, Hertz, and others are leading this innovation, constantly improving their offerings through technological advancements such as real-time data integration, personalized trip planning, and integrated payment systems. The market faces challenges, including regulatory hurdles in implementing integrated transport systems and addressing concerns around data privacy and security. Nevertheless, the convenience and cost-effectiveness offered by MaaS platforms are likely to overcome these hurdles, driving further market expansion.
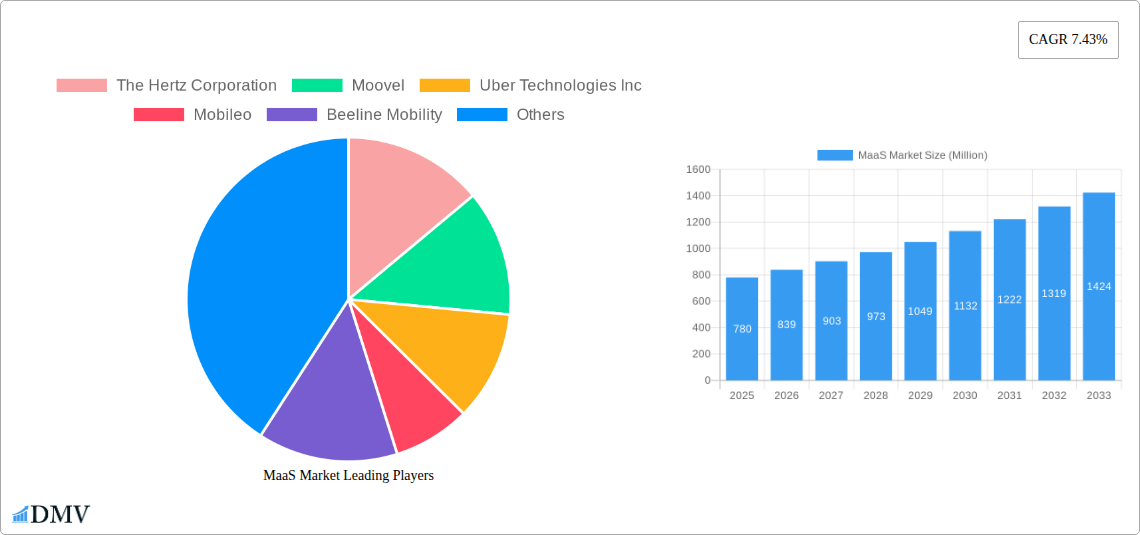
MaaS Market Market Size (In Million)
The competitive landscape is marked by a blend of established players and innovative startups. While large corporations such as Hertz and Uber leverage their existing infrastructure and customer base, smaller companies focusing on niche markets or specific technological advancements are also gaining traction. The continued investment in developing advanced functionalities, such as predictive analytics for optimizing routes and reducing congestion, will play a crucial role in shaping the future of the MaaS market. Geographical expansion, particularly in developing nations with burgeoning populations and rapidly developing transportation infrastructure, is another key growth area. The focus on sustainable transportation options, including electric vehicle integration and bike-sharing programs, contributes to the overall positive outlook for the MaaS market.
MaaS Market Company Market Share
MaaS Market: A Comprehensive Report (2019-2033)
This insightful report provides a detailed analysis of the Mobility as a Service (MaaS) market, encompassing historical data (2019-2024), the base year (2025), and a comprehensive forecast (2025-2033). It explores market dynamics, key players, technological advancements, and future growth potential, offering crucial insights for stakeholders across the MaaS ecosystem. The market is projected to reach xx Million by 2033, presenting significant opportunities for investment and expansion.
MaaS Market Market Composition & Trends
This section delves into the intricate structure of the MaaS market, examining its concentration, innovation drivers, regulatory environment, substitute offerings, user profiles, and mergers & acquisitions (M&A) activity. We analyze market share distribution among key players, providing a comprehensive overview of the competitive landscape. The analysis includes an assessment of the value of significant M&A deals, highlighting strategic shifts and market consolidation.
- Market Concentration: The MaaS market exhibits a [High/Medium/Low] level of concentration, with [xx%] market share held by the top 5 players.
- Innovation Catalysts: Technological advancements in areas such as AI, big data analytics, and IoT are driving innovation within the MaaS space, leading to improved service offerings and enhanced user experience.
- Regulatory Landscape: Varying regulations across different geographies significantly impact market growth and adoption rates. The report analyzes key regulatory factors and their influence on market dynamics.
- Substitute Products: Traditional transportation modes such as private car ownership and taxis present competition to MaaS solutions. This section analyzes the competitive threat posed by substitutes and their potential impact on market share.
- End-User Profiles: The report segments the user base by demographics, usage patterns, and preferences, providing a detailed understanding of the target audience for MaaS services.
- M&A Activities: Significant M&A activity has been observed in the MaaS sector, with deal values totaling xx Million in the past [Number] years. Key drivers for these acquisitions include market expansion, technological integration, and enhanced service offerings. Examples include [mention 1-2 relevant examples from the provided companies].
MaaS Market Industry Evolution
This section offers a thorough analysis of the MaaS market's evolutionary trajectory, encompassing growth patterns, technological advancements, and the transformation of consumer preferences. Specific data points, such as precise growth rates and adoption metrics, illuminate the market's dynamism. Factors such as rising urbanization, increasing traffic congestion, and growing environmental concerns are fueling the demand for MaaS solutions. The report examines the impact of these factors on market growth trajectories and the evolution of consumer behavior. We detail the transition from traditional transportation models to integrated, on-demand mobility services. The evolving technological landscape, including the integration of AI, big data, and IoT, are also thoroughly examined, revealing their influence on the market’s development.
Leading Regions, Countries, or Segments in MaaS Market
This section identifies the leading regions, countries, and segments within the MaaS market, focusing on "By Service Type (Car, Bus, Bike)" and "By Transportation Type (Public, Private)". The analysis explores the dominant factors contributing to their market leadership.
- Dominant Region/Country: [Name of Region/Country] currently holds the largest market share due to [Reasons for dominance: e.g., high levels of urbanization, strong government support for sustainable transportation, favorable regulatory environment].
- Dominant Service Type: [Car/Bus/Bike] services represent the largest segment, driven by [Reasons: e.g., high demand for personal transportation, established infrastructure, convenient accessibility].
- Dominant Transportation Type: [Public/Private] transportation holds a significant share due to [Reasons: e.g., cost-effectiveness, accessibility, government subsidies for public transport].
Key Drivers (Bullet Points):
- High levels of urbanization and population density.
- Increasing traffic congestion and parking challenges.
- Growing environmental concerns and the push for sustainable transportation.
- Government initiatives and incentives promoting MaaS adoption.
- Technological advancements in mobility solutions.
MaaS Market Product Innovations
The MaaS market witnesses continuous innovation, with new features and services aimed at enhancing user experience and expanding accessibility. Recent developments include multimodal trip planning, integrated payment systems, personalized recommendations, and real-time information updates. These innovations improve convenience, efficiency, and the overall appeal of MaaS platforms. Key performance indicators (KPIs) such as user satisfaction, adoption rates, and transaction volumes are also analyzed to gauge the success of these innovations.
Propelling Factors for MaaS Market Growth
Several factors are driving the growth of the MaaS market. Technological advancements, such as the development of sophisticated apps and integrated platforms, enable efficient multimodal journey planning and seamless payment processing. Economic factors, such as rising fuel costs and parking expenses, encourage users to opt for cost-effective MaaS options. Supportive government regulations, aimed at promoting sustainable transportation and reducing traffic congestion, also contribute to market expansion.
Obstacles in the MaaS Market Market
The MaaS market faces challenges such as inconsistent regulatory frameworks across different regions, hindering seamless service deployment and operation. Supply chain disruptions, particularly affecting the provision of vehicles and supporting technologies, can also impede market growth. Furthermore, intense competition among established players and emerging startups presents a significant obstacle.
Future Opportunities in MaaS Market
Future opportunities lie in expanding into new markets, particularly in developing regions with growing urban populations and inadequate public transportation infrastructure. The integration of emerging technologies, such as autonomous vehicles and advanced data analytics, will offer enhanced services and personalization. Emerging consumer trends, including increasing preference for shared mobility and sustainable travel choices, create fertile ground for MaaS market expansion.
Major Players in the MaaS Market Ecosystem
- The Hertz Corporation
- Moovel
- Uber Technologies Inc
- Mobileo
- Beeline Mobility
- Enterprise Holdings Inc
- Avis Budget Group
- Moovit Inc
- Whim (Maas Global)
- Didi Chuxing
- Bridj Technology Pty Ltd
- Ubigo (via-id)
- Citymapper
Key Developments in MaaS Market Industry
- December 2022: Moovit launched in Tampa, Florida, introducing a multimodal MaaS pilot program integrating various transportation modes. This signifies growing adoption of MaaS in smaller markets.
- January 2023: DiDi partnered with Jordan Transfer Guidance to integrate taxi services into their app, expanding MaaS offerings in the tourism sector. This demonstrates the potential for MaaS in niche markets.
- February 2023: Uber and HSBC collaborated on a digital payment solution in Egypt, improving financial inclusion for drivers and potentially broadening MaaS access. This highlights the importance of financial infrastructure for MaaS expansion.
Strategic MaaS Market Market Forecast
The MaaS market is poised for significant growth, driven by technological advancements, evolving consumer preferences, and supportive government policies. Expanding into new markets, particularly in developing countries, presents substantial opportunities. The integration of autonomous vehicles and enhanced data analytics will further refine service offerings and user experiences. These factors point towards a robust and expansive future for the MaaS market.
MaaS Market Segmentation
-
1. Service Type
- 1.1. Car
- 1.2. Bus
- 1.3. Bike
-
2. Transportation Type
- 2.1. Public
- 2.2. Private
MaaS Market Segmentation By Geography
-
1. North America
- 1.1. United States
- 1.2. Canada
- 1.3. Rest of North America
-
2. Europe
- 2.1. Germany
- 2.2. United Kingdom
- 2.3. France
- 2.4. Rest of Europe
-
3. Asia Pacific
- 3.1. India
- 3.2. China
- 3.3. Japan
- 3.4. South Korea
- 3.5. Rest of Asia Pacific
-
4. Rest of the World
- 4.1. South America
- 4.2. Middle East and Africa

MaaS Market Regional Market Share
Geographic Coverage of MaaS Market
MaaS Market REPORT HIGHLIGHTS
| Aspects | Details |
|---|---|
| Study Period | 2020-2034 |
| Base Year | 2025 |
| Estimated Year | 2026 |
| Forecast Period | 2026-2034 |
| Historical Period | 2020-2025 |
| Growth Rate | CAGR of 7.43% from 2020-2034 |
| Segmentation |
|
Table of Contents
- 1. Introduction
- 1.1. Research Scope
- 1.2. Market Segmentation
- 1.3. Research Methodology
- 1.4. Definitions and Assumptions
- 2. Executive Summary
- 2.1. Introduction
- 3. Market Dynamics
- 3.1. Introduction
- 3.2. Market Drivers
- 3.2.1. Increasing Vehicle Production; Emphasis on Vehicle Comfort and NVH Reduction
- 3.3. Market Restrains
- 3.3.1. Economic Fluctuations And Uncertainties
- 3.4. Market Trends
- 3.4.1. Increasing Traffic Congestion Drive the Demand in the Market
- 4. Market Factor Analysis
- 4.1. Porters Five Forces
- 4.2. Supply/Value Chain
- 4.3. PESTEL analysis
- 4.4. Market Entropy
- 4.5. Patent/Trademark Analysis
- 5. Global MaaS Market Analysis, Insights and Forecast, 2020-2032
- 5.1. Market Analysis, Insights and Forecast - by Service Type
- 5.1.1. Car
- 5.1.2. Bus
- 5.1.3. Bike
- 5.2. Market Analysis, Insights and Forecast - by Transportation Type
- 5.2.1. Public
- 5.2.2. Private
- 5.3. Market Analysis, Insights and Forecast - by Region
- 5.3.1. North America
- 5.3.2. Europe
- 5.3.3. Asia Pacific
- 5.3.4. Rest of the World
- 5.1. Market Analysis, Insights and Forecast - by Service Type
- 6. North America MaaS Market Analysis, Insights and Forecast, 2020-2032
- 6.1. Market Analysis, Insights and Forecast - by Service Type
- 6.1.1. Car
- 6.1.2. Bus
- 6.1.3. Bike
- 6.2. Market Analysis, Insights and Forecast - by Transportation Type
- 6.2.1. Public
- 6.2.2. Private
- 6.1. Market Analysis, Insights and Forecast - by Service Type
- 7. Europe MaaS Market Analysis, Insights and Forecast, 2020-2032
- 7.1. Market Analysis, Insights and Forecast - by Service Type
- 7.1.1. Car
- 7.1.2. Bus
- 7.1.3. Bike
- 7.2. Market Analysis, Insights and Forecast - by Transportation Type
- 7.2.1. Public
- 7.2.2. Private
- 7.1. Market Analysis, Insights and Forecast - by Service Type
- 8. Asia Pacific MaaS Market Analysis, Insights and Forecast, 2020-2032
- 8.1. Market Analysis, Insights and Forecast - by Service Type
- 8.1.1. Car
- 8.1.2. Bus
- 8.1.3. Bike
- 8.2. Market Analysis, Insights and Forecast - by Transportation Type
- 8.2.1. Public
- 8.2.2. Private
- 8.1. Market Analysis, Insights and Forecast - by Service Type
- 9. Rest of the World MaaS Market Analysis, Insights and Forecast, 2020-2032
- 9.1. Market Analysis, Insights and Forecast - by Service Type
- 9.1.1. Car
- 9.1.2. Bus
- 9.1.3. Bike
- 9.2. Market Analysis, Insights and Forecast - by Transportation Type
- 9.2.1. Public
- 9.2.2. Private
- 9.1. Market Analysis, Insights and Forecast - by Service Type
- 10. Competitive Analysis
- 10.1. Global Market Share Analysis 2025
- 10.2. Company Profiles
- 10.2.1 The Hertz Corporation
- 10.2.1.1. Overview
- 10.2.1.2. Products
- 10.2.1.3. SWOT Analysis
- 10.2.1.4. Recent Developments
- 10.2.1.5. Financials (Based on Availability)
- 10.2.2 Moovel
- 10.2.2.1. Overview
- 10.2.2.2. Products
- 10.2.2.3. SWOT Analysis
- 10.2.2.4. Recent Developments
- 10.2.2.5. Financials (Based on Availability)
- 10.2.3 Uber Technologies Inc
- 10.2.3.1. Overview
- 10.2.3.2. Products
- 10.2.3.3. SWOT Analysis
- 10.2.3.4. Recent Developments
- 10.2.3.5. Financials (Based on Availability)
- 10.2.4 Mobileo
- 10.2.4.1. Overview
- 10.2.4.2. Products
- 10.2.4.3. SWOT Analysis
- 10.2.4.4. Recent Developments
- 10.2.4.5. Financials (Based on Availability)
- 10.2.5 Beeline Mobility
- 10.2.5.1. Overview
- 10.2.5.2. Products
- 10.2.5.3. SWOT Analysis
- 10.2.5.4. Recent Developments
- 10.2.5.5. Financials (Based on Availability)
- 10.2.6 Enterprise Holdings Inc
- 10.2.6.1. Overview
- 10.2.6.2. Products
- 10.2.6.3. SWOT Analysis
- 10.2.6.4. Recent Developments
- 10.2.6.5. Financials (Based on Availability)
- 10.2.7 Avis Budget Group
- 10.2.7.1. Overview
- 10.2.7.2. Products
- 10.2.7.3. SWOT Analysis
- 10.2.7.4. Recent Developments
- 10.2.7.5. Financials (Based on Availability)
- 10.2.8 Moovit Inc
- 10.2.8.1. Overview
- 10.2.8.2. Products
- 10.2.8.3. SWOT Analysis
- 10.2.8.4. Recent Developments
- 10.2.8.5. Financials (Based on Availability)
- 10.2.9 Whim (Maas Global)
- 10.2.9.1. Overview
- 10.2.9.2. Products
- 10.2.9.3. SWOT Analysis
- 10.2.9.4. Recent Developments
- 10.2.9.5. Financials (Based on Availability)
- 10.2.10 Didi Chuxing
- 10.2.10.1. Overview
- 10.2.10.2. Products
- 10.2.10.3. SWOT Analysis
- 10.2.10.4. Recent Developments
- 10.2.10.5. Financials (Based on Availability)
- 10.2.11 Bridj Technology Pty Ltd
- 10.2.11.1. Overview
- 10.2.11.2. Products
- 10.2.11.3. SWOT Analysis
- 10.2.11.4. Recent Developments
- 10.2.11.5. Financials (Based on Availability)
- 10.2.12 Ubigo (via-id)
- 10.2.12.1. Overview
- 10.2.12.2. Products
- 10.2.12.3. SWOT Analysis
- 10.2.12.4. Recent Developments
- 10.2.12.5. Financials (Based on Availability)
- 10.2.13 Citymapper
- 10.2.13.1. Overview
- 10.2.13.2. Products
- 10.2.13.3. SWOT Analysis
- 10.2.13.4. Recent Developments
- 10.2.13.5. Financials (Based on Availability)
- 10.2.1 The Hertz Corporation
List of Figures
- Figure 1: Global MaaS Market Revenue Breakdown (Million, %) by Region 2025 & 2033
- Figure 2: North America MaaS Market Revenue (Million), by Service Type 2025 & 2033
- Figure 3: North America MaaS Market Revenue Share (%), by Service Type 2025 & 2033
- Figure 4: North America MaaS Market Revenue (Million), by Transportation Type 2025 & 2033
- Figure 5: North America MaaS Market Revenue Share (%), by Transportation Type 2025 & 2033
- Figure 6: North America MaaS Market Revenue (Million), by Country 2025 & 2033
- Figure 7: North America MaaS Market Revenue Share (%), by Country 2025 & 2033
- Figure 8: Europe MaaS Market Revenue (Million), by Service Type 2025 & 2033
- Figure 9: Europe MaaS Market Revenue Share (%), by Service Type 2025 & 2033
- Figure 10: Europe MaaS Market Revenue (Million), by Transportation Type 2025 & 2033
- Figure 11: Europe MaaS Market Revenue Share (%), by Transportation Type 2025 & 2033
- Figure 12: Europe MaaS Market Revenue (Million), by Country 2025 & 2033
- Figure 13: Europe MaaS Market Revenue Share (%), by Country 2025 & 2033
- Figure 14: Asia Pacific MaaS Market Revenue (Million), by Service Type 2025 & 2033
- Figure 15: Asia Pacific MaaS Market Revenue Share (%), by Service Type 2025 & 2033
- Figure 16: Asia Pacific MaaS Market Revenue (Million), by Transportation Type 2025 & 2033
- Figure 17: Asia Pacific MaaS Market Revenue Share (%), by Transportation Type 2025 & 2033
- Figure 18: Asia Pacific MaaS Market Revenue (Million), by Country 2025 & 2033
- Figure 19: Asia Pacific MaaS Market Revenue Share (%), by Country 2025 & 2033
- Figure 20: Rest of the World MaaS Market Revenue (Million), by Service Type 2025 & 2033
- Figure 21: Rest of the World MaaS Market Revenue Share (%), by Service Type 2025 & 2033
- Figure 22: Rest of the World MaaS Market Revenue (Million), by Transportation Type 2025 & 2033
- Figure 23: Rest of the World MaaS Market Revenue Share (%), by Transportation Type 2025 & 2033
- Figure 24: Rest of the World MaaS Market Revenue (Million), by Country 2025 & 2033
- Figure 25: Rest of the World MaaS Market Revenue Share (%), by Country 2025 & 2033
List of Tables
- Table 1: Global MaaS Market Revenue Million Forecast, by Service Type 2020 & 2033
- Table 2: Global MaaS Market Revenue Million Forecast, by Transportation Type 2020 & 2033
- Table 3: Global MaaS Market Revenue Million Forecast, by Region 2020 & 2033
- Table 4: Global MaaS Market Revenue Million Forecast, by Service Type 2020 & 2033
- Table 5: Global MaaS Market Revenue Million Forecast, by Transportation Type 2020 & 2033
- Table 6: Global MaaS Market Revenue Million Forecast, by Country 2020 & 2033
- Table 7: United States MaaS Market Revenue (Million) Forecast, by Application 2020 & 2033
- Table 8: Canada MaaS Market Revenue (Million) Forecast, by Application 2020 & 2033
- Table 9: Rest of North America MaaS Market Revenue (Million) Forecast, by Application 2020 & 2033
- Table 10: Global MaaS Market Revenue Million Forecast, by Service Type 2020 & 2033
- Table 11: Global MaaS Market Revenue Million Forecast, by Transportation Type 2020 & 2033
- Table 12: Global MaaS Market Revenue Million Forecast, by Country 2020 & 2033
- Table 13: Germany MaaS Market Revenue (Million) Forecast, by Application 2020 & 2033
- Table 14: United Kingdom MaaS Market Revenue (Million) Forecast, by Application 2020 & 2033
- Table 15: France MaaS Market Revenue (Million) Forecast, by Application 2020 & 2033
- Table 16: Rest of Europe MaaS Market Revenue (Million) Forecast, by Application 2020 & 2033
- Table 17: Global MaaS Market Revenue Million Forecast, by Service Type 2020 & 2033
- Table 18: Global MaaS Market Revenue Million Forecast, by Transportation Type 2020 & 2033
- Table 19: Global MaaS Market Revenue Million Forecast, by Country 2020 & 2033
- Table 20: India MaaS Market Revenue (Million) Forecast, by Application 2020 & 2033
- Table 21: China MaaS Market Revenue (Million) Forecast, by Application 2020 & 2033
- Table 22: Japan MaaS Market Revenue (Million) Forecast, by Application 2020 & 2033
- Table 23: South Korea MaaS Market Revenue (Million) Forecast, by Application 2020 & 2033
- Table 24: Rest of Asia Pacific MaaS Market Revenue (Million) Forecast, by Application 2020 & 2033
- Table 25: Global MaaS Market Revenue Million Forecast, by Service Type 2020 & 2033
- Table 26: Global MaaS Market Revenue Million Forecast, by Transportation Type 2020 & 2033
- Table 27: Global MaaS Market Revenue Million Forecast, by Country 2020 & 2033
- Table 28: South America MaaS Market Revenue (Million) Forecast, by Application 2020 & 2033
- Table 29: Middle East and Africa MaaS Market Revenue (Million) Forecast, by Application 2020 & 2033
Frequently Asked Questions
1. What is the projected Compound Annual Growth Rate (CAGR) of the MaaS Market?
The projected CAGR is approximately 7.43%.
2. Which companies are prominent players in the MaaS Market?
Key companies in the market include The Hertz Corporation, Moovel, Uber Technologies Inc, Mobileo, Beeline Mobility, Enterprise Holdings Inc, Avis Budget Group, Moovit Inc, Whim (Maas Global), Didi Chuxing, Bridj Technology Pty Ltd, Ubigo (via-id), Citymapper.
3. What are the main segments of the MaaS Market?
The market segments include Service Type, Transportation Type.
4. Can you provide details about the market size?
The market size is estimated to be USD 0.78 Million as of 2022.
5. What are some drivers contributing to market growth?
Increasing Vehicle Production; Emphasis on Vehicle Comfort and NVH Reduction.
6. What are the notable trends driving market growth?
Increasing Traffic Congestion Drive the Demand in the Market.
7. Are there any restraints impacting market growth?
Economic Fluctuations And Uncertainties.
8. Can you provide examples of recent developments in the market?
In February 2023, Uber partnered with financial services firm HSBC to launch a digital payments solution that allows unbanked drivers in Egypt to receive on-demand cash outs into mobile wallets. Through this collaboration, the companies hope to provide Uber platform drivers with access to 100% of their earnings in a timely and convenient manner via HSBC Net's payment solution.
9. What pricing options are available for accessing the report?
Pricing options include single-user, multi-user, and enterprise licenses priced at USD 4750, USD 5250, and USD 8750 respectively.
10. Is the market size provided in terms of value or volume?
The market size is provided in terms of value, measured in Million.
11. Are there any specific market keywords associated with the report?
Yes, the market keyword associated with the report is "MaaS Market," which aids in identifying and referencing the specific market segment covered.
12. How do I determine which pricing option suits my needs best?
The pricing options vary based on user requirements and access needs. Individual users may opt for single-user licenses, while businesses requiring broader access may choose multi-user or enterprise licenses for cost-effective access to the report.
13. Are there any additional resources or data provided in the MaaS Market report?
While the report offers comprehensive insights, it's advisable to review the specific contents or supplementary materials provided to ascertain if additional resources or data are available.
14. How can I stay updated on further developments or reports in the MaaS Market?
To stay informed about further developments, trends, and reports in the MaaS Market, consider subscribing to industry newsletters, following relevant companies and organizations, or regularly checking reputable industry news sources and publications.
Methodology
Step 1 - Identification of Relevant Samples Size from Population Database


Step 2 - Approaches for Defining Global Market Size (Value, Volume* & Price*)

Note*: In applicable scenarios
Step 3 - Data Sources
Primary Research
- Web Analytics
- Survey Reports
- Research Institute
- Latest Research Reports
- Opinion Leaders
Secondary Research
- Annual Reports
- White Paper
- Latest Press Release
- Industry Association
- Paid Database
- Investor Presentations

Step 4 - Data Triangulation
Involves using different sources of information in order to increase the validity of a study
These sources are likely to be stakeholders in a program - participants, other researchers, program staff, other community members, and so on.
Then we put all data in single framework & apply various statistical tools to find out the dynamic on the market.
During the analysis stage, feedback from the stakeholder groups would be compared to determine areas of agreement as well as areas of divergence