

Key Insights
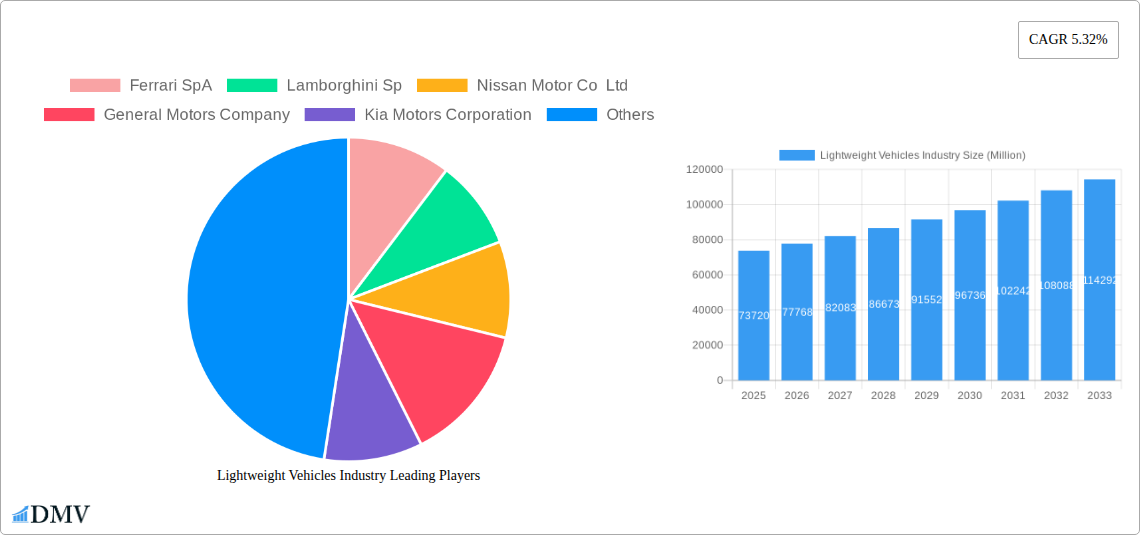
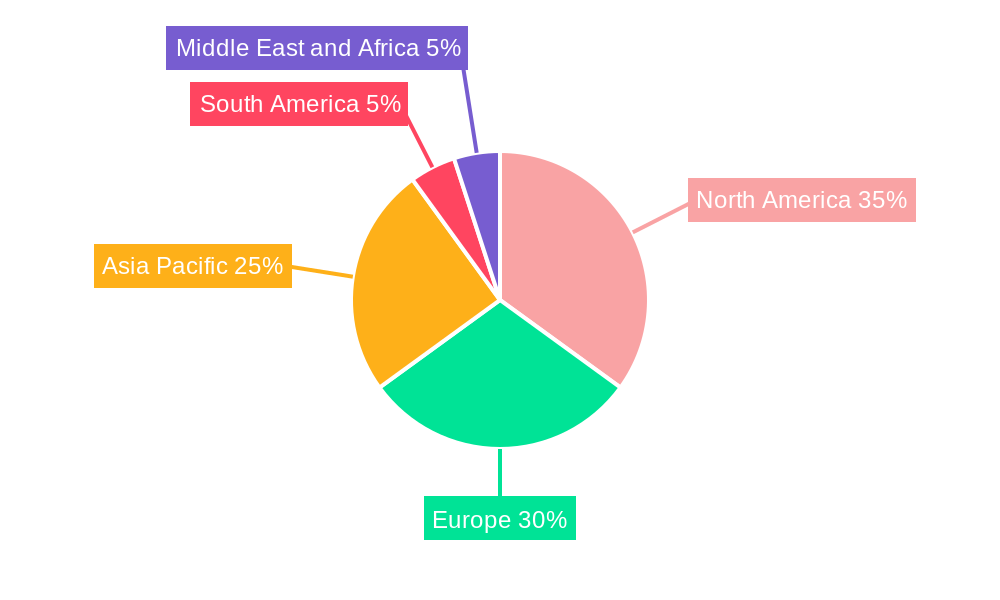
The lightweight vehicle market, valued at $73.72 billion in 2025, is projected to experience robust growth, driven by increasing demand for fuel efficiency and reduced carbon emissions. The compound annual growth rate (CAGR) of 5.32% from 2025 to 2033 indicates a significant expansion of this sector. Key drivers include stringent government regulations promoting fuel economy and the rising adoption of electric and hybrid vehicles, which inherently benefit from lightweight materials. Technological advancements in materials science, such as the development of stronger and lighter carbon fiber composites and high-strength steel alloys, are further accelerating market growth. The passenger car segment currently dominates the market, followed by the sports car segment, with a growing preference for materials like carbon fiber and glass fiber due to their superior strength-to-weight ratio. However, the high cost of these advanced materials remains a restraint, particularly impacting widespread adoption in mass-market vehicles. Regional growth will be diverse; North America and Europe will show strong growth due to established automotive industries and stringent emission regulations. The Asia-Pacific region, particularly China and India, is poised for significant expansion due to increasing vehicle sales and government initiatives promoting sustainable transportation. Competition amongst established automotive giants like Toyota, Volkswagen, and General Motors, alongside specialized sports car manufacturers like Ferrari and Lamborghini, fuels innovation and market dynamism. The next decade will witness increased focus on sustainable manufacturing practices and the integration of lightweighting solutions across various vehicle platforms.
The market segmentation across various car types and materials highlights evolving consumer preferences and technological advancements. Passenger cars remain the largest segment, reflecting the mass-market appeal of lightweighting technologies. The rising popularity of sports cars, however, fuels demand for high-performance lightweight materials such as carbon fiber, driving innovation and growth within this niche. The industry landscape is competitive, with both established and niche players vying for market share. Strategic partnerships and collaborations are emerging, combining material expertise with automotive manufacturing capabilities. Sustained investment in research and development continues to expand the range of available lightweighting solutions, offering manufacturers a broader selection to meet diverse vehicle specifications and environmental regulations. Future growth hinges on overcoming challenges related to cost and scalability while accelerating the transition towards more sustainable and efficient manufacturing processes.
Lightweight Vehicles Industry: A Comprehensive Market Report (2019-2033)
This insightful report provides a detailed analysis of the Lightweight Vehicles Industry, encompassing market trends, technological advancements, and future growth projections from 2019 to 2033. With a focus on key players like Ferrari SpA, Lamborghini SpA, Nissan Motor Co Ltd, General Motors Company, Kia Motors Corporation, Hyundai Motor Co, Toyota Motor Corporation, Honda Motor Co Ltd, Volkswagen, and Ford Motor Company, this report offers invaluable insights for stakeholders across the automotive value chain. The report leverages a robust dataset, culminating in a comprehensive forecast, with 2025 as the base and estimated year.
Lightweight Vehicles Industry Market Composition & Trends
This section delves into the current market landscape, analyzing market concentration, innovation drivers, regulatory frameworks, substitute products, end-user profiles, and merger & acquisition (M&A) activities. The global lightweight vehicles market is estimated at $XX Million in 2025, projected to reach $XX Million by 2033, exhibiting a CAGR of XX%.
- Market Share Distribution: The market is moderately concentrated, with leading players holding approximately XX% of the market share collectively. Toyota and Volkswagen likely hold the largest share, followed by GM and other major players. Precise figures are detailed within the full report.
- Innovation Catalysts: Stringent fuel efficiency regulations, growing demand for electric vehicles (EVs), and advancements in materials science are key drivers of innovation within the lightweight vehicle segment.
- Regulatory Landscape: Government regulations promoting fuel efficiency and emission reductions across different regions significantly influence the adoption of lightweight vehicle technologies. This includes carbon emission regulations and fuel economy standards.
- Substitute Products: While traditional steel remains a dominant material, substitutes like carbon fiber, glass fiber, and high-strength steel are gaining traction, driven by their lightweight and high-strength properties.
- End-User Profiles: The primary end users include passenger car manufacturers, sports car manufacturers, and commercial vehicle manufacturers.
- M&A Activities: The report details significant M&A activities in the lightweight vehicle sector, analyzing deal values (estimated at $XX Million annually in recent years) and their impact on market consolidation. Strategic alliances focused on material technology and manufacturing are prevalent.
Lightweight Vehicles Industry Evolution
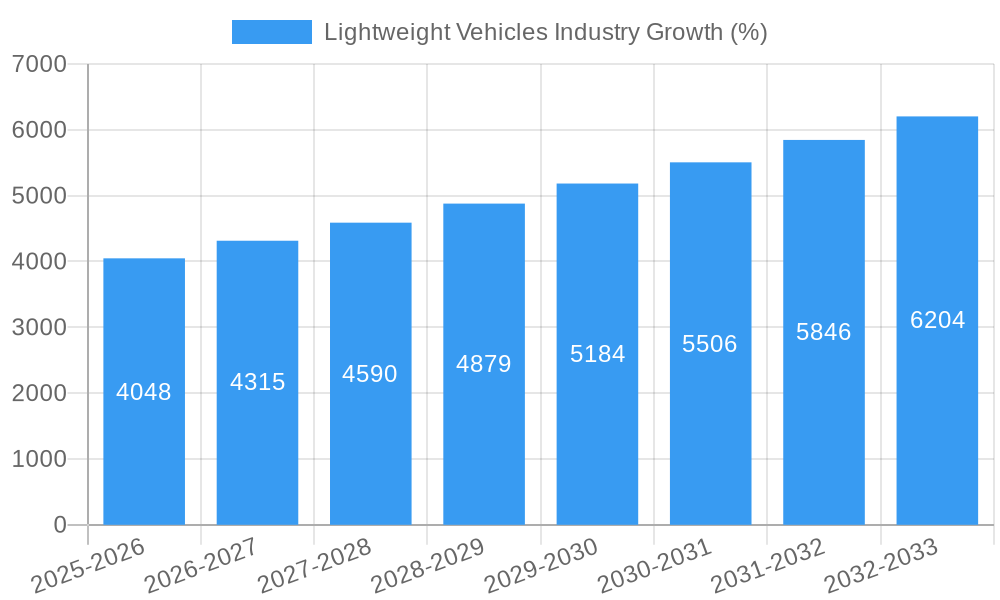
This section analyzes the evolutionary trajectory of the lightweight vehicles market, encompassing market growth trajectories, technological breakthroughs, and evolving consumer preferences. The historical period (2019-2024) reflects a steady rise, impacted by various factors, while the forecast period (2025-2033) projects continued growth, driven by increasing consumer demand for fuel-efficient and environmentally friendly vehicles. Growth rates are projected to fluctuate, peaking in XX and slightly decreasing thereafter, remaining robust overall. Adoption of lightweight materials is steadily increasing, with carbon fiber showing the most significant growth amongst the material types. The shift towards electric vehicles is strongly correlated with increased lightweight component adoption. The market is also witnessing increasing adoption of advanced manufacturing techniques like additive manufacturing for customized lightweight components.
Leading Regions, Countries, or Segments in Lightweight Vehicles Industry
This section identifies the dominant regions, countries, and segments within the lightweight vehicle industry. The report shows that currently North America and Europe are major markets but Asia-Pacific is showing highest growth.
- Key Drivers:
- Investment Trends: Significant investments in R&D, particularly in Asia-Pacific (driven by government incentives and growing domestic demand), are shaping the market landscape.
- Regulatory Support: Favorable government policies and incentives promoting fuel efficiency and emission reduction further fuel the market's growth in various regions.
- Dominance Factors: The dominance of specific regions is linked to factors such as established automotive manufacturing bases, robust supply chains, favorable government policies, and strong consumer demand for fuel-efficient vehicles. The strong focus on EVs in Asia-Pacific is likely to significantly propel the lightweight materials market in the coming years. Within material types, the use of high-strength steel is currently most prevalent. However, the fastest growth is expected within the carbon fiber segment.
Lightweight Vehicles Industry Product Innovations
Recent innovations include the development of lighter, stronger materials, advanced manufacturing processes (like additive manufacturing), and integrated system designs that optimize weight reduction while maintaining structural integrity. Key advancements involve carbon fiber reinforced polymers (CFRPs) in various vehicle components, resulting in weight reductions up to 30-40% compared to traditional steel counterparts. This contributes to improved fuel economy and reduced emissions, significantly impacting the overall performance and appeal of vehicles.
Propelling Factors for Lightweight Vehicles Industry Growth
The growth of the lightweight vehicles industry is primarily fueled by:
- Stringent Emission Regulations: Government regulations worldwide are pushing automakers to reduce vehicle emissions, driving the adoption of lighter materials to improve fuel efficiency.
- Rising Fuel Prices: Fluctuations in global fuel prices further incentivize the development and adoption of lightweight vehicles for cost savings.
- Technological Advancements: Innovations in materials science and manufacturing processes are leading to lighter, stronger, and more cost-effective lightweight components.
Obstacles in the Lightweight Vehicles Industry Market
Challenges facing the industry include:
- High Initial Costs: The high cost of lightweight materials like carbon fiber can be a barrier to widespread adoption, particularly in mass-market vehicles.
- Supply Chain Disruptions: Global supply chain issues can impact the availability and cost of raw materials, hindering production and potentially impacting delivery timelines.
- Competitive Pressures: Intense competition among manufacturers necessitates continuous innovation and cost optimization to maintain market share.
Future Opportunities in Lightweight Vehicles Industry
Future opportunities lie in:
- Expansion into Emerging Markets: Growing economies in Asia and other regions present significant untapped market potential.
- Development of Novel Materials: Research into new, even lighter and stronger materials will continue to drive innovation.
- Integration of Advanced Technologies: Combining lightweighting with other advanced technologies such as autonomous driving and connected car features will offer further opportunities.
Major Players in the Lightweight Vehicles Industry Ecosystem
- Ferrari SpA
- Lamborghini SpA
- Nissan Motor Co Ltd
- General Motors Company
- Kia Motors Corporation
- Hyundai Motor Co
- Toyota Motor Corporation
- Honda Motor Co Ltd
- Volkswagen
- Ford Motor Company
Key Developments in Lightweight Vehicles Industry Industry
- November 2023: Huawei partners with Changan Auto to develop automotive systems and components, signaling increased technological investment in the sector.
- August 2023: Clemson University, NETL, and Honda develop a 32% lighter carbon fiber vehicle door, demonstrating advancements in material science and design.
- June 2023: ZF unveils EVbeat, an electric concept vehicle showcasing ultra-lightweight drivetrain technology, highlighting efforts to enhance electric vehicle efficiency.
- May 2022: Mercedes-AMG unveils the Vision AMG, featuring a compact and lightweight Axial Flux Motor, emphasizing the role of innovative motor designs in lightweight vehicle development.
Strategic Lightweight Vehicles Industry Market Forecast
The lightweight vehicles market is poised for significant growth driven by the increasing demand for fuel-efficient and sustainable transportation solutions. Continued advancements in materials science, manufacturing techniques, and technological integration will shape the future of this dynamic industry. Government regulations, coupled with consumer preferences for environmentally conscious vehicles, will further propel this growth, leading to a substantial market expansion over the forecast period. The adoption of electric vehicles and hybrid technologies will become increasingly intertwined with the demand for lightweight components, creating a synergistic growth dynamic.
Lightweight Vehicles Industry Segmentation
-
1. Car Type
- 1.1. Passenger Cars
- 1.2. Sports Cars
-
2. Material Type
- 2.1. Glass Fiber
- 2.2. Carbon Fiber
- 2.3. High-strength Steel
- 2.4. Other Material Types
Lightweight Vehicles Industry Segmentation By Geography
-
1. North America
- 1.1. United States
- 1.2. Canada
- 1.3. Rest of North America
-
2. Europe
- 2.1. Germany
- 2.2. United Kingdom
- 2.3. France
- 2.4. Rest of Europe
-
3. Asia Pacific
- 3.1. China
- 3.2. Japan
- 3.3. India
- 3.4. South Korea
- 3.5. Rest of Asia Pacific
-
4. South America
- 4.1. Brazil
- 4.2. Rest of South America
-
5. Middle East and Africa
- 5.1. United Arab Emirates
- 5.2. South Africa
- 5.3. Rest of Middle East and Africa
Lightweight Vehicles Industry REPORT HIGHLIGHTS
| Aspects | Details |
|---|---|
| Study Period | 2019-2033 |
| Base Year | 2024 |
| Estimated Year | 2025 |
| Forecast Period | 2025-2033 |
| Historical Period | 2019-2024 |
| Growth Rate | CAGR of 5.32% from 2019-2033 |
| Segmentation |
|
Table of Contents
- 1. Introduction
- 1.1. Research Scope
- 1.2. Market Segmentation
- 1.3. Research Methodology
- 1.4. Definitions and Assumptions
- 2. Executive Summary
- 2.1. Introduction
- 3. Market Dynamics
- 3.1. Introduction
- 3.2. Market Drivers
- 3.2.1. Technological Innovations and Material Advancements is Likely to Fuel Demand
- 3.3. Market Restrains
- 3.3.1. High Cost of Lightweight Materials is Anticipated to Restrict the Market Growth Potential
- 3.4. Market Trends
- 3.4.1. Increasing Demand for Lightweight Passenger Cars
- 4. Market Factor Analysis
- 4.1. Porters Five Forces
- 4.2. Supply/Value Chain
- 4.3. PESTEL analysis
- 4.4. Market Entropy
- 4.5. Patent/Trademark Analysis
- 5. Global Lightweight Vehicles Industry Analysis, Insights and Forecast, 2019-2031
- 5.1. Market Analysis, Insights and Forecast - by Car Type
- 5.1.1. Passenger Cars
- 5.1.2. Sports Cars
- 5.2. Market Analysis, Insights and Forecast - by Material Type
- 5.2.1. Glass Fiber
- 5.2.2. Carbon Fiber
- 5.2.3. High-strength Steel
- 5.2.4. Other Material Types
- 5.3. Market Analysis, Insights and Forecast - by Region
- 5.3.1. North America
- 5.3.2. Europe
- 5.3.3. Asia Pacific
- 5.3.4. South America
- 5.3.5. Middle East and Africa
- 5.1. Market Analysis, Insights and Forecast - by Car Type
- 6. North America Lightweight Vehicles Industry Analysis, Insights and Forecast, 2019-2031
- 6.1. Market Analysis, Insights and Forecast - by Car Type
- 6.1.1. Passenger Cars
- 6.1.2. Sports Cars
- 6.2. Market Analysis, Insights and Forecast - by Material Type
- 6.2.1. Glass Fiber
- 6.2.2. Carbon Fiber
- 6.2.3. High-strength Steel
- 6.2.4. Other Material Types
- 6.1. Market Analysis, Insights and Forecast - by Car Type
- 7. Europe Lightweight Vehicles Industry Analysis, Insights and Forecast, 2019-2031
- 7.1. Market Analysis, Insights and Forecast - by Car Type
- 7.1.1. Passenger Cars
- 7.1.2. Sports Cars
- 7.2. Market Analysis, Insights and Forecast - by Material Type
- 7.2.1. Glass Fiber
- 7.2.2. Carbon Fiber
- 7.2.3. High-strength Steel
- 7.2.4. Other Material Types
- 7.1. Market Analysis, Insights and Forecast - by Car Type
- 8. Asia Pacific Lightweight Vehicles Industry Analysis, Insights and Forecast, 2019-2031
- 8.1. Market Analysis, Insights and Forecast - by Car Type
- 8.1.1. Passenger Cars
- 8.1.2. Sports Cars
- 8.2. Market Analysis, Insights and Forecast - by Material Type
- 8.2.1. Glass Fiber
- 8.2.2. Carbon Fiber
- 8.2.3. High-strength Steel
- 8.2.4. Other Material Types
- 8.1. Market Analysis, Insights and Forecast - by Car Type
- 9. South America Lightweight Vehicles Industry Analysis, Insights and Forecast, 2019-2031
- 9.1. Market Analysis, Insights and Forecast - by Car Type
- 9.1.1. Passenger Cars
- 9.1.2. Sports Cars
- 9.2. Market Analysis, Insights and Forecast - by Material Type
- 9.2.1. Glass Fiber
- 9.2.2. Carbon Fiber
- 9.2.3. High-strength Steel
- 9.2.4. Other Material Types
- 9.1. Market Analysis, Insights and Forecast - by Car Type
- 10. Middle East and Africa Lightweight Vehicles Industry Analysis, Insights and Forecast, 2019-2031
- 10.1. Market Analysis, Insights and Forecast - by Car Type
- 10.1.1. Passenger Cars
- 10.1.2. Sports Cars
- 10.2. Market Analysis, Insights and Forecast - by Material Type
- 10.2.1. Glass Fiber
- 10.2.2. Carbon Fiber
- 10.2.3. High-strength Steel
- 10.2.4. Other Material Types
- 10.1. Market Analysis, Insights and Forecast - by Car Type
- 11. North America Lightweight Vehicles Industry Analysis, Insights and Forecast, 2019-2031
- 11.1. Market Analysis, Insights and Forecast - By Country/Sub-region
- 11.1.1 United States
- 11.1.2 Canada
- 11.1.3 Rest of North America
- 12. Europe Lightweight Vehicles Industry Analysis, Insights and Forecast, 2019-2031
- 12.1. Market Analysis, Insights and Forecast - By Country/Sub-region
- 12.1.1 Germany
- 12.1.2 United Kingdom
- 12.1.3 France
- 12.1.4 Rest of Europe
- 13. Asia Pacific Lightweight Vehicles Industry Analysis, Insights and Forecast, 2019-2031
- 13.1. Market Analysis, Insights and Forecast - By Country/Sub-region
- 13.1.1 China
- 13.1.2 Japan
- 13.1.3 India
- 13.1.4 South Korea
- 13.1.5 Rest of Asia Pacific
- 14. South America Lightweight Vehicles Industry Analysis, Insights and Forecast, 2019-2031
- 14.1. Market Analysis, Insights and Forecast - By Country/Sub-region
- 14.1.1 Brazil
- 14.1.2 Rest of South America
- 15. Middle East and Africa Lightweight Vehicles Industry Analysis, Insights and Forecast, 2019-2031
- 15.1. Market Analysis, Insights and Forecast - By Country/Sub-region
- 15.1.1 United Arab Emirates
- 15.1.2 South Africa
- 15.1.3 Rest of Middle East and Africa
- 16. Competitive Analysis
- 16.1. Global Market Share Analysis 2024
- 16.2. Company Profiles
- 16.2.1 Ferrari SpA
- 16.2.1.1. Overview
- 16.2.1.2. Products
- 16.2.1.3. SWOT Analysis
- 16.2.1.4. Recent Developments
- 16.2.1.5. Financials (Based on Availability)
- 16.2.2 Lamborghini Sp
- 16.2.2.1. Overview
- 16.2.2.2. Products
- 16.2.2.3. SWOT Analysis
- 16.2.2.4. Recent Developments
- 16.2.2.5. Financials (Based on Availability)
- 16.2.3 Nissan Motor Co Ltd
- 16.2.3.1. Overview
- 16.2.3.2. Products
- 16.2.3.3. SWOT Analysis
- 16.2.3.4. Recent Developments
- 16.2.3.5. Financials (Based on Availability)
- 16.2.4 General Motors Company
- 16.2.4.1. Overview
- 16.2.4.2. Products
- 16.2.4.3. SWOT Analysis
- 16.2.4.4. Recent Developments
- 16.2.4.5. Financials (Based on Availability)
- 16.2.5 Kia Motors Corporation
- 16.2.5.1. Overview
- 16.2.5.2. Products
- 16.2.5.3. SWOT Analysis
- 16.2.5.4. Recent Developments
- 16.2.5.5. Financials (Based on Availability)
- 16.2.6 Hyundai Motor Co
- 16.2.6.1. Overview
- 16.2.6.2. Products
- 16.2.6.3. SWOT Analysis
- 16.2.6.4. Recent Developments
- 16.2.6.5. Financials (Based on Availability)
- 16.2.7 Toyota Motor Corporation
- 16.2.7.1. Overview
- 16.2.7.2. Products
- 16.2.7.3. SWOT Analysis
- 16.2.7.4. Recent Developments
- 16.2.7.5. Financials (Based on Availability)
- 16.2.8 Honda Motor Co Ltd
- 16.2.8.1. Overview
- 16.2.8.2. Products
- 16.2.8.3. SWOT Analysis
- 16.2.8.4. Recent Developments
- 16.2.8.5. Financials (Based on Availability)
- 16.2.9 Volkswagen
- 16.2.9.1. Overview
- 16.2.9.2. Products
- 16.2.9.3. SWOT Analysis
- 16.2.9.4. Recent Developments
- 16.2.9.5. Financials (Based on Availability)
- 16.2.10 Ford Motor Company
- 16.2.10.1. Overview
- 16.2.10.2. Products
- 16.2.10.3. SWOT Analysis
- 16.2.10.4. Recent Developments
- 16.2.10.5. Financials (Based on Availability)
- 16.2.1 Ferrari SpA
List of Figures
- Figure 1: Global Lightweight Vehicles Industry Revenue Breakdown (Million, %) by Region 2024 & 2032
- Figure 2: North America Lightweight Vehicles Industry Revenue (Million), by Country 2024 & 2032
- Figure 3: North America Lightweight Vehicles Industry Revenue Share (%), by Country 2024 & 2032
- Figure 4: Europe Lightweight Vehicles Industry Revenue (Million), by Country 2024 & 2032
- Figure 5: Europe Lightweight Vehicles Industry Revenue Share (%), by Country 2024 & 2032
- Figure 6: Asia Pacific Lightweight Vehicles Industry Revenue (Million), by Country 2024 & 2032
- Figure 7: Asia Pacific Lightweight Vehicles Industry Revenue Share (%), by Country 2024 & 2032
- Figure 8: South America Lightweight Vehicles Industry Revenue (Million), by Country 2024 & 2032
- Figure 9: South America Lightweight Vehicles Industry Revenue Share (%), by Country 2024 & 2032
- Figure 10: Middle East and Africa Lightweight Vehicles Industry Revenue (Million), by Country 2024 & 2032
- Figure 11: Middle East and Africa Lightweight Vehicles Industry Revenue Share (%), by Country 2024 & 2032
- Figure 12: North America Lightweight Vehicles Industry Revenue (Million), by Car Type 2024 & 2032
- Figure 13: North America Lightweight Vehicles Industry Revenue Share (%), by Car Type 2024 & 2032
- Figure 14: North America Lightweight Vehicles Industry Revenue (Million), by Material Type 2024 & 2032
- Figure 15: North America Lightweight Vehicles Industry Revenue Share (%), by Material Type 2024 & 2032
- Figure 16: North America Lightweight Vehicles Industry Revenue (Million), by Country 2024 & 2032
- Figure 17: North America Lightweight Vehicles Industry Revenue Share (%), by Country 2024 & 2032
- Figure 18: Europe Lightweight Vehicles Industry Revenue (Million), by Car Type 2024 & 2032
- Figure 19: Europe Lightweight Vehicles Industry Revenue Share (%), by Car Type 2024 & 2032
- Figure 20: Europe Lightweight Vehicles Industry Revenue (Million), by Material Type 2024 & 2032
- Figure 21: Europe Lightweight Vehicles Industry Revenue Share (%), by Material Type 2024 & 2032
- Figure 22: Europe Lightweight Vehicles Industry Revenue (Million), by Country 2024 & 2032
- Figure 23: Europe Lightweight Vehicles Industry Revenue Share (%), by Country 2024 & 2032
- Figure 24: Asia Pacific Lightweight Vehicles Industry Revenue (Million), by Car Type 2024 & 2032
- Figure 25: Asia Pacific Lightweight Vehicles Industry Revenue Share (%), by Car Type 2024 & 2032
- Figure 26: Asia Pacific Lightweight Vehicles Industry Revenue (Million), by Material Type 2024 & 2032
- Figure 27: Asia Pacific Lightweight Vehicles Industry Revenue Share (%), by Material Type 2024 & 2032
- Figure 28: Asia Pacific Lightweight Vehicles Industry Revenue (Million), by Country 2024 & 2032
- Figure 29: Asia Pacific Lightweight Vehicles Industry Revenue Share (%), by Country 2024 & 2032
- Figure 30: South America Lightweight Vehicles Industry Revenue (Million), by Car Type 2024 & 2032
- Figure 31: South America Lightweight Vehicles Industry Revenue Share (%), by Car Type 2024 & 2032
- Figure 32: South America Lightweight Vehicles Industry Revenue (Million), by Material Type 2024 & 2032
- Figure 33: South America Lightweight Vehicles Industry Revenue Share (%), by Material Type 2024 & 2032
- Figure 34: South America Lightweight Vehicles Industry Revenue (Million), by Country 2024 & 2032
- Figure 35: South America Lightweight Vehicles Industry Revenue Share (%), by Country 2024 & 2032
- Figure 36: Middle East and Africa Lightweight Vehicles Industry Revenue (Million), by Car Type 2024 & 2032
- Figure 37: Middle East and Africa Lightweight Vehicles Industry Revenue Share (%), by Car Type 2024 & 2032
- Figure 38: Middle East and Africa Lightweight Vehicles Industry Revenue (Million), by Material Type 2024 & 2032
- Figure 39: Middle East and Africa Lightweight Vehicles Industry Revenue Share (%), by Material Type 2024 & 2032
- Figure 40: Middle East and Africa Lightweight Vehicles Industry Revenue (Million), by Country 2024 & 2032
- Figure 41: Middle East and Africa Lightweight Vehicles Industry Revenue Share (%), by Country 2024 & 2032
List of Tables
- Table 1: Global Lightweight Vehicles Industry Revenue Million Forecast, by Region 2019 & 2032
- Table 2: Global Lightweight Vehicles Industry Revenue Million Forecast, by Car Type 2019 & 2032
- Table 3: Global Lightweight Vehicles Industry Revenue Million Forecast, by Material Type 2019 & 2032
- Table 4: Global Lightweight Vehicles Industry Revenue Million Forecast, by Region 2019 & 2032
- Table 5: Global Lightweight Vehicles Industry Revenue Million Forecast, by Country 2019 & 2032
- Table 6: United States Lightweight Vehicles Industry Revenue (Million) Forecast, by Application 2019 & 2032
- Table 7: Canada Lightweight Vehicles Industry Revenue (Million) Forecast, by Application 2019 & 2032
- Table 8: Rest of North America Lightweight Vehicles Industry Revenue (Million) Forecast, by Application 2019 & 2032
- Table 9: Global Lightweight Vehicles Industry Revenue Million Forecast, by Country 2019 & 2032
- Table 10: Germany Lightweight Vehicles Industry Revenue (Million) Forecast, by Application 2019 & 2032
- Table 11: United Kingdom Lightweight Vehicles Industry Revenue (Million) Forecast, by Application 2019 & 2032
- Table 12: France Lightweight Vehicles Industry Revenue (Million) Forecast, by Application 2019 & 2032
- Table 13: Rest of Europe Lightweight Vehicles Industry Revenue (Million) Forecast, by Application 2019 & 2032
- Table 14: Global Lightweight Vehicles Industry Revenue Million Forecast, by Country 2019 & 2032
- Table 15: China Lightweight Vehicles Industry Revenue (Million) Forecast, by Application 2019 & 2032
- Table 16: Japan Lightweight Vehicles Industry Revenue (Million) Forecast, by Application 2019 & 2032
- Table 17: India Lightweight Vehicles Industry Revenue (Million) Forecast, by Application 2019 & 2032
- Table 18: South Korea Lightweight Vehicles Industry Revenue (Million) Forecast, by Application 2019 & 2032
- Table 19: Rest of Asia Pacific Lightweight Vehicles Industry Revenue (Million) Forecast, by Application 2019 & 2032
- Table 20: Global Lightweight Vehicles Industry Revenue Million Forecast, by Country 2019 & 2032
- Table 21: Brazil Lightweight Vehicles Industry Revenue (Million) Forecast, by Application 2019 & 2032
- Table 22: Rest of South America Lightweight Vehicles Industry Revenue (Million) Forecast, by Application 2019 & 2032
- Table 23: Global Lightweight Vehicles Industry Revenue Million Forecast, by Country 2019 & 2032
- Table 24: United Arab Emirates Lightweight Vehicles Industry Revenue (Million) Forecast, by Application 2019 & 2032
- Table 25: South Africa Lightweight Vehicles Industry Revenue (Million) Forecast, by Application 2019 & 2032
- Table 26: Rest of Middle East and Africa Lightweight Vehicles Industry Revenue (Million) Forecast, by Application 2019 & 2032
- Table 27: Global Lightweight Vehicles Industry Revenue Million Forecast, by Car Type 2019 & 2032
- Table 28: Global Lightweight Vehicles Industry Revenue Million Forecast, by Material Type 2019 & 2032
- Table 29: Global Lightweight Vehicles Industry Revenue Million Forecast, by Country 2019 & 2032
- Table 30: United States Lightweight Vehicles Industry Revenue (Million) Forecast, by Application 2019 & 2032
- Table 31: Canada Lightweight Vehicles Industry Revenue (Million) Forecast, by Application 2019 & 2032
- Table 32: Rest of North America Lightweight Vehicles Industry Revenue (Million) Forecast, by Application 2019 & 2032
- Table 33: Global Lightweight Vehicles Industry Revenue Million Forecast, by Car Type 2019 & 2032
- Table 34: Global Lightweight Vehicles Industry Revenue Million Forecast, by Material Type 2019 & 2032
- Table 35: Global Lightweight Vehicles Industry Revenue Million Forecast, by Country 2019 & 2032
- Table 36: Germany Lightweight Vehicles Industry Revenue (Million) Forecast, by Application 2019 & 2032
- Table 37: United Kingdom Lightweight Vehicles Industry Revenue (Million) Forecast, by Application 2019 & 2032
- Table 38: France Lightweight Vehicles Industry Revenue (Million) Forecast, by Application 2019 & 2032
- Table 39: Rest of Europe Lightweight Vehicles Industry Revenue (Million) Forecast, by Application 2019 & 2032
- Table 40: Global Lightweight Vehicles Industry Revenue Million Forecast, by Car Type 2019 & 2032
- Table 41: Global Lightweight Vehicles Industry Revenue Million Forecast, by Material Type 2019 & 2032
- Table 42: Global Lightweight Vehicles Industry Revenue Million Forecast, by Country 2019 & 2032
- Table 43: China Lightweight Vehicles Industry Revenue (Million) Forecast, by Application 2019 & 2032
- Table 44: Japan Lightweight Vehicles Industry Revenue (Million) Forecast, by Application 2019 & 2032
- Table 45: India Lightweight Vehicles Industry Revenue (Million) Forecast, by Application 2019 & 2032
- Table 46: South Korea Lightweight Vehicles Industry Revenue (Million) Forecast, by Application 2019 & 2032
- Table 47: Rest of Asia Pacific Lightweight Vehicles Industry Revenue (Million) Forecast, by Application 2019 & 2032
- Table 48: Global Lightweight Vehicles Industry Revenue Million Forecast, by Car Type 2019 & 2032
- Table 49: Global Lightweight Vehicles Industry Revenue Million Forecast, by Material Type 2019 & 2032
- Table 50: Global Lightweight Vehicles Industry Revenue Million Forecast, by Country 2019 & 2032
- Table 51: Brazil Lightweight Vehicles Industry Revenue (Million) Forecast, by Application 2019 & 2032
- Table 52: Rest of South America Lightweight Vehicles Industry Revenue (Million) Forecast, by Application 2019 & 2032
- Table 53: Global Lightweight Vehicles Industry Revenue Million Forecast, by Car Type 2019 & 2032
- Table 54: Global Lightweight Vehicles Industry Revenue Million Forecast, by Material Type 2019 & 2032
- Table 55: Global Lightweight Vehicles Industry Revenue Million Forecast, by Country 2019 & 2032
- Table 56: United Arab Emirates Lightweight Vehicles Industry Revenue (Million) Forecast, by Application 2019 & 2032
- Table 57: South Africa Lightweight Vehicles Industry Revenue (Million) Forecast, by Application 2019 & 2032
- Table 58: Rest of Middle East and Africa Lightweight Vehicles Industry Revenue (Million) Forecast, by Application 2019 & 2032
Frequently Asked Questions
1. What is the projected Compound Annual Growth Rate (CAGR) of the Lightweight Vehicles Industry?
The projected CAGR is approximately 5.32%.
2. Which companies are prominent players in the Lightweight Vehicles Industry?
Key companies in the market include Ferrari SpA, Lamborghini Sp, Nissan Motor Co Ltd, General Motors Company, Kia Motors Corporation, Hyundai Motor Co, Toyota Motor Corporation, Honda Motor Co Ltd, Volkswagen, Ford Motor Company.
3. What are the main segments of the Lightweight Vehicles Industry?
The market segments include Car Type, Material Type.
4. Can you provide details about the market size?
The market size is estimated to be USD 73.72 Million as of 2022.
5. What are some drivers contributing to market growth?
Technological Innovations and Material Advancements is Likely to Fuel Demand.
6. What are the notable trends driving market growth?
Increasing Demand for Lightweight Passenger Cars.
7. Are there any restraints impacting market growth?
High Cost of Lightweight Materials is Anticipated to Restrict the Market Growth Potential.
8. Can you provide examples of recent developments in the market?
In November 2023, Huawei is partnering with Changan Auto, a Chinese car manufacturer to create a new entity for the development of sophisticated automotive systems and components. In this joint venture, Huawei will hold a significant share with Changan Auto's ownership not surpassing 40%.
9. What pricing options are available for accessing the report?
Pricing options include single-user, multi-user, and enterprise licenses priced at USD 4750, USD 5250, and USD 8750 respectively.
10. Is the market size provided in terms of value or volume?
The market size is provided in terms of value, measured in Million.
11. Are there any specific market keywords associated with the report?
Yes, the market keyword associated with the report is "Lightweight Vehicles Industry," which aids in identifying and referencing the specific market segment covered.
12. How do I determine which pricing option suits my needs best?
The pricing options vary based on user requirements and access needs. Individual users may opt for single-user licenses, while businesses requiring broader access may choose multi-user or enterprise licenses for cost-effective access to the report.
13. Are there any additional resources or data provided in the Lightweight Vehicles Industry report?
While the report offers comprehensive insights, it's advisable to review the specific contents or supplementary materials provided to ascertain if additional resources or data are available.
14. How can I stay updated on further developments or reports in the Lightweight Vehicles Industry?
To stay informed about further developments, trends, and reports in the Lightweight Vehicles Industry, consider subscribing to industry newsletters, following relevant companies and organizations, or regularly checking reputable industry news sources and publications.
Methodology
Step 1 - Identification of Relevant Samples Size from Population Database


Step 2 - Approaches for Defining Global Market Size (Value, Volume* & Price*)

Note*: In applicable scenarios
Step 3 - Data Sources
Primary Research
- Web Analytics
- Survey Reports
- Research Institute
- Latest Research Reports
- Opinion Leaders
Secondary Research
- Annual Reports
- White Paper
- Latest Press Release
- Industry Association
- Paid Database
- Investor Presentations

Step 4 - Data Triangulation
Involves using different sources of information in order to increase the validity of a study
These sources are likely to be stakeholders in a program - participants, other researchers, program staff, other community members, and so on.
Then we put all data in single framework & apply various statistical tools to find out the dynamic on the market.
During the analysis stage, feedback from the stakeholder groups would be compared to determine areas of agreement as well as areas of divergence
