

Key Insights
The Life Sciences Smart Manufacturing Services market is experiencing robust growth, driven by increasing demand for enhanced efficiency, reduced operational costs, and improved product quality within the pharmaceutical and biotechnology industries. The market's expansion is fueled by the adoption of advanced technologies such as Industrial Internet of Things (IIoT), artificial intelligence (AI), machine learning (ML), and cloud computing, enabling real-time data analysis, predictive maintenance, and automated processes. This shift towards intelligent manufacturing is particularly pronounced in the biologics segment, where complex processes and stringent regulatory requirements necessitate greater control and precision. Key players like ABB, Bosch Rexroth, Emerson Electric, and Siemens are actively investing in developing and deploying innovative smart manufacturing solutions tailored to the specific needs of life sciences companies. The market's growth trajectory is further supported by increasing government regulations emphasizing data integrity and traceability, pushing companies to adopt sophisticated digital systems for compliance. While initial investment costs can be a barrier to entry, the long-term benefits of improved productivity, reduced waste, and enhanced product quality are driving widespread adoption.
The competitive landscape is characterized by a mix of established industrial automation vendors and specialized software providers. Strategic partnerships and mergers and acquisitions are becoming increasingly common, as companies strive to expand their product portfolios and market reach. Future market growth will be influenced by factors such as advancements in technology, evolving regulatory landscape, and the increasing focus on personalized medicine, which demands flexible and agile manufacturing processes. Geographic expansion, particularly in emerging markets with growing pharmaceutical industries, will also significantly contribute to overall market expansion. While cybersecurity concerns and data integration challenges pose potential restraints, the overall market outlook remains positive, projecting substantial growth over the forecast period (2025-2033). We project a conservative CAGR of 12% for the market, reflecting a balance between rapid technological advancement and potential market saturation in specific segments within established economies.
Life Sciences Smart Manufacturing Services Market Report: 2019-2033
This comprehensive report provides a detailed analysis of the Life Sciences Smart Manufacturing Services market, projecting a market value exceeding $XX million by 2033. The study covers the period from 2019 to 2033, with a base year of 2025 and a forecast period spanning 2025-2033. Key players such as ABB, Bosch Rexroth, Emerson Electric, Fortinet, General Electric, Honeywell International, IBM Corporation, Rockwell Automation, Siemens, and Sophos Group are analyzed, revealing market dynamics and future growth potential. This in-depth analysis is crucial for stakeholders seeking to navigate the complexities of this rapidly evolving sector.
Life Sciences Smart Manufacturing Services Market Composition & Trends
The Life Sciences Smart Manufacturing Services market exhibits a moderately concentrated landscape, with the top five players holding an estimated xx% market share in 2025. Innovation is driven by the increasing adoption of advanced analytics, AI, and automation technologies to improve efficiency and reduce costs. Stringent regulatory compliance requirements, particularly within the pharmaceutical and biotech sectors, heavily influence market dynamics. Substitute products, such as traditional manufacturing processes, pose a challenge, but the benefits of enhanced quality control and reduced errors drive market adoption. The primary end-users are pharmaceutical companies, biotech firms, and contract manufacturing organizations (CMOs). Significant M&A activity, with total deal values exceeding $XX million in the historical period (2019-2024), indicates a consolidating market.
- Market Share Distribution (2025): Top 5 players: xx%; Next 10 players: xx%; Others: xx%
- M&A Activity (2019-2024): Total deal value: >$XX million; Average deal size: $XX million
- Regulatory Landscape: Stringent FDA, EMA, and other global regulatory guidelines drive market demand for compliant solutions.
- Innovation Catalysts: AI-powered predictive maintenance, advanced process analytics, and cloud-based solutions.
Life Sciences Smart Manufacturing Services Industry Evolution
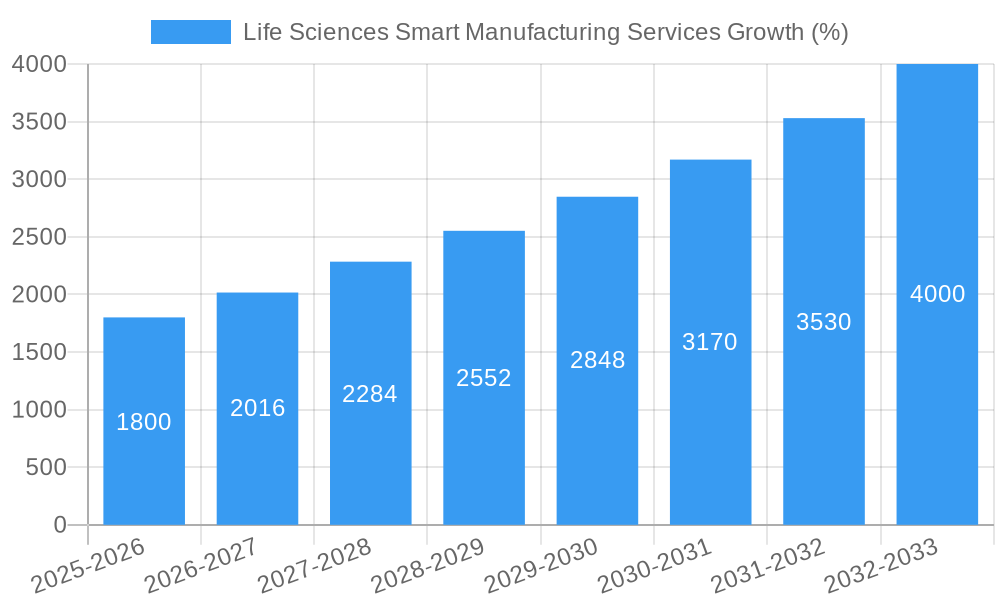
The Life Sciences Smart Manufacturing Services market experienced a Compound Annual Growth Rate (CAGR) of xx% during the historical period (2019-2024), driven by the increasing demand for higher quality, faster production, and reduced operational costs. Technological advancements, particularly in the Internet of Things (IoT), cloud computing, and data analytics, have significantly improved production efficiency and supply chain visibility. Shifting consumer demands for personalized medicines and faster drug development cycles further fuel market growth. By 2033, the market is projected to reach $XX million, with a CAGR of xx% during the forecast period (2025-2033). Adoption rates of smart manufacturing technologies are increasing significantly across various life science segments, with xx% adoption in pharmaceutical manufacturing by 2025.
Leading Regions, Countries, or Segments in Life Sciences Smart Manufacturing Services
North America, specifically the United States, currently dominates the Life Sciences Smart Manufacturing Services market, driven by high investments in research and development, a robust regulatory framework, and a strong presence of major players.
- Key Drivers for North American Dominance:
- Significant investments in R&D and advanced manufacturing technologies.
- Presence of large pharmaceutical and biotech companies.
- Strong regulatory support for technological innovation.
- Highly skilled workforce.
The European market is expected to witness significant growth, fueled by increasing investments in digitalization and automation initiatives across the pharmaceutical and biotechnology sectors. Asia-Pacific is also emerging as a promising market, driven by rising healthcare expenditure and government initiatives to modernize the manufacturing sector.
Life Sciences Smart Manufacturing Services Product Innovations
Recent innovations include advanced process analytics platforms offering real-time insights into manufacturing processes, predictive maintenance solutions minimizing downtime, and integrated supply chain management systems enhancing visibility and efficiency. These innovations showcase improved product quality, reduced production costs, and enhanced traceability across the entire life cycle. Unique selling propositions focus on enhanced data security, regulatory compliance, and streamlined integration with existing systems.
Propelling Factors for Life Sciences Smart Manufacturing Services Growth
The market's growth is fueled by several factors, including rising demand for personalized medicines, increasing pressure to reduce manufacturing costs, growing adoption of Industry 4.0 technologies, and stringent regulatory compliance requirements that necessitate advanced data management and process control systems. Government incentives for digital transformation further accelerate market growth.
Obstacles in the Life Sciences Smart Manufacturing Services Market
Significant barriers include the high initial investment costs associated with implementing smart manufacturing solutions, the complexity of integrating these technologies with legacy systems, concerns about data security and cyber threats, and the need for specialized expertise to manage and maintain these systems. Supply chain disruptions, as experienced recently, highlight the vulnerabilities of complex global supply networks.
Future Opportunities in Life Sciences Smart Manufacturing Services
Emerging opportunities lie in the adoption of Artificial Intelligence (AI) and Machine Learning (ML) for advanced process optimization, the integration of blockchain technology for enhanced supply chain transparency, and the development of sustainable and eco-friendly manufacturing solutions. The expansion into emerging markets, particularly in Asia-Pacific, presents further significant growth potential.
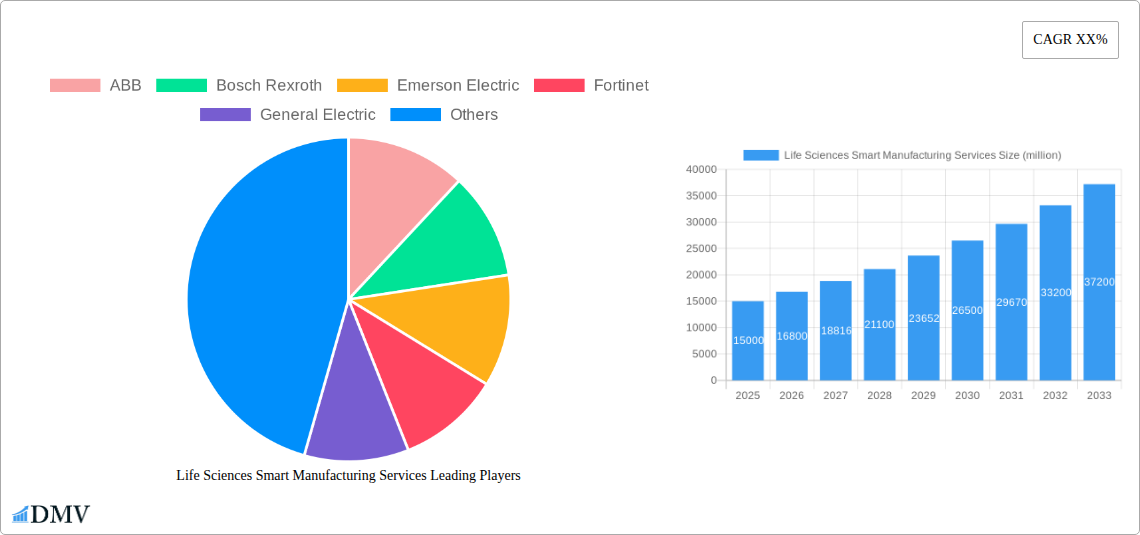
Major Players in the Life Sciences Smart Manufacturing Services Ecosystem
- ABB
- Bosch Rexroth
- Emerson Electric
- Fortinet
- General Electric
- Honeywell International
- IBM Corporation
- Rockwell Automation
- Siemens
- Sophos Group
Key Developments in Life Sciences Smart Manufacturing Services Industry
- 2023-Q4: ABB launches a new AI-powered predictive maintenance solution for pharmaceutical manufacturing.
- 2022-Q3: Siemens announces a strategic partnership with a leading CMO to implement a fully integrated smart manufacturing platform.
- 2021-Q2: Emerson Electric acquires a specialist in advanced process analytics for life sciences.
- Further significant developments will be documented in the full report.
Strategic Life Sciences Smart Manufacturing Services Market Forecast
The Life Sciences Smart Manufacturing Services market is poised for sustained growth, driven by increasing adoption of advanced technologies, rising demand for higher-quality products, and stringent regulatory requirements. Future opportunities lie in the development of innovative solutions addressing data security, supply chain resilience, and sustainable manufacturing practices. The market is projected to reach $XX million by 2033, representing significant potential for both established players and new entrants.
Life Sciences Smart Manufacturing Services Segmentation
-
1. Application
- 1.1. Medical Equipment
- 1.2. Pharmaceutical
- 1.3. Others
-
2. Types
- 2.1. AI
- 2.2. IoT
Life Sciences Smart Manufacturing Services Segmentation By Geography
-
1. North America
- 1.1. United States
- 1.2. Canada
- 1.3. Mexico
-
2. South America
- 2.1. Brazil
- 2.2. Argentina
- 2.3. Rest of South America
-
3. Europe
- 3.1. United Kingdom
- 3.2. Germany
- 3.3. France
- 3.4. Italy
- 3.5. Spain
- 3.6. Russia
- 3.7. Benelux
- 3.8. Nordics
- 3.9. Rest of Europe
-
4. Middle East & Africa
- 4.1. Turkey
- 4.2. Israel
- 4.3. GCC
- 4.4. North Africa
- 4.5. South Africa
- 4.6. Rest of Middle East & Africa
-
5. Asia Pacific
- 5.1. China
- 5.2. India
- 5.3. Japan
- 5.4. South Korea
- 5.5. ASEAN
- 5.6. Oceania
- 5.7. Rest of Asia Pacific

Life Sciences Smart Manufacturing Services REPORT HIGHLIGHTS
| Aspects | Details |
|---|---|
| Study Period | 2019-2033 |
| Base Year | 2024 |
| Estimated Year | 2025 |
| Forecast Period | 2025-2033 |
| Historical Period | 2019-2024 |
| Growth Rate | CAGR of XX% from 2019-2033 |
| Segmentation |
|
Table of Contents
- 1. Introduction
- 1.1. Research Scope
- 1.2. Market Segmentation
- 1.3. Research Methodology
- 1.4. Definitions and Assumptions
- 2. Executive Summary
- 2.1. Introduction
- 3. Market Dynamics
- 3.1. Introduction
- 3.2. Market Drivers
- 3.3. Market Restrains
- 3.4. Market Trends
- 4. Market Factor Analysis
- 4.1. Porters Five Forces
- 4.2. Supply/Value Chain
- 4.3. PESTEL analysis
- 4.4. Market Entropy
- 4.5. Patent/Trademark Analysis
- 5. Global Life Sciences Smart Manufacturing Services Analysis, Insights and Forecast, 2019-2031
- 5.1. Market Analysis, Insights and Forecast - by Application
- 5.1.1. Medical Equipment
- 5.1.2. Pharmaceutical
- 5.1.3. Others
- 5.2. Market Analysis, Insights and Forecast - by Types
- 5.2.1. AI
- 5.2.2. IoT
- 5.3. Market Analysis, Insights and Forecast - by Region
- 5.3.1. North America
- 5.3.2. South America
- 5.3.3. Europe
- 5.3.4. Middle East & Africa
- 5.3.5. Asia Pacific
- 5.1. Market Analysis, Insights and Forecast - by Application
- 6. North America Life Sciences Smart Manufacturing Services Analysis, Insights and Forecast, 2019-2031
- 6.1. Market Analysis, Insights and Forecast - by Application
- 6.1.1. Medical Equipment
- 6.1.2. Pharmaceutical
- 6.1.3. Others
- 6.2. Market Analysis, Insights and Forecast - by Types
- 6.2.1. AI
- 6.2.2. IoT
- 6.1. Market Analysis, Insights and Forecast - by Application
- 7. South America Life Sciences Smart Manufacturing Services Analysis, Insights and Forecast, 2019-2031
- 7.1. Market Analysis, Insights and Forecast - by Application
- 7.1.1. Medical Equipment
- 7.1.2. Pharmaceutical
- 7.1.3. Others
- 7.2. Market Analysis, Insights and Forecast - by Types
- 7.2.1. AI
- 7.2.2. IoT
- 7.1. Market Analysis, Insights and Forecast - by Application
- 8. Europe Life Sciences Smart Manufacturing Services Analysis, Insights and Forecast, 2019-2031
- 8.1. Market Analysis, Insights and Forecast - by Application
- 8.1.1. Medical Equipment
- 8.1.2. Pharmaceutical
- 8.1.3. Others
- 8.2. Market Analysis, Insights and Forecast - by Types
- 8.2.1. AI
- 8.2.2. IoT
- 8.1. Market Analysis, Insights and Forecast - by Application
- 9. Middle East & Africa Life Sciences Smart Manufacturing Services Analysis, Insights and Forecast, 2019-2031
- 9.1. Market Analysis, Insights and Forecast - by Application
- 9.1.1. Medical Equipment
- 9.1.2. Pharmaceutical
- 9.1.3. Others
- 9.2. Market Analysis, Insights and Forecast - by Types
- 9.2.1. AI
- 9.2.2. IoT
- 9.1. Market Analysis, Insights and Forecast - by Application
- 10. Asia Pacific Life Sciences Smart Manufacturing Services Analysis, Insights and Forecast, 2019-2031
- 10.1. Market Analysis, Insights and Forecast - by Application
- 10.1.1. Medical Equipment
- 10.1.2. Pharmaceutical
- 10.1.3. Others
- 10.2. Market Analysis, Insights and Forecast - by Types
- 10.2.1. AI
- 10.2.2. IoT
- 10.1. Market Analysis, Insights and Forecast - by Application
- 11. Competitive Analysis
- 11.1. Global Market Share Analysis 2024
- 11.2. Company Profiles
- 11.2.1 ABB
- 11.2.1.1. Overview
- 11.2.1.2. Products
- 11.2.1.3. SWOT Analysis
- 11.2.1.4. Recent Developments
- 11.2.1.5. Financials (Based on Availability)
- 11.2.2 Bosch Rexroth
- 11.2.2.1. Overview
- 11.2.2.2. Products
- 11.2.2.3. SWOT Analysis
- 11.2.2.4. Recent Developments
- 11.2.2.5. Financials (Based on Availability)
- 11.2.3 Emerson Electric
- 11.2.3.1. Overview
- 11.2.3.2. Products
- 11.2.3.3. SWOT Analysis
- 11.2.3.4. Recent Developments
- 11.2.3.5. Financials (Based on Availability)
- 11.2.4 Fortinet
- 11.2.4.1. Overview
- 11.2.4.2. Products
- 11.2.4.3. SWOT Analysis
- 11.2.4.4. Recent Developments
- 11.2.4.5. Financials (Based on Availability)
- 11.2.5 General Electric
- 11.2.5.1. Overview
- 11.2.5.2. Products
- 11.2.5.3. SWOT Analysis
- 11.2.5.4. Recent Developments
- 11.2.5.5. Financials (Based on Availability)
- 11.2.6 Honeywell International
- 11.2.6.1. Overview
- 11.2.6.2. Products
- 11.2.6.3. SWOT Analysis
- 11.2.6.4. Recent Developments
- 11.2.6.5. Financials (Based on Availability)
- 11.2.7 IBM Corporation
- 11.2.7.1. Overview
- 11.2.7.2. Products
- 11.2.7.3. SWOT Analysis
- 11.2.7.4. Recent Developments
- 11.2.7.5. Financials (Based on Availability)
- 11.2.8 Rockwell Automation
- 11.2.8.1. Overview
- 11.2.8.2. Products
- 11.2.8.3. SWOT Analysis
- 11.2.8.4. Recent Developments
- 11.2.8.5. Financials (Based on Availability)
- 11.2.9 Siemens
- 11.2.9.1. Overview
- 11.2.9.2. Products
- 11.2.9.3. SWOT Analysis
- 11.2.9.4. Recent Developments
- 11.2.9.5. Financials (Based on Availability)
- 11.2.10 Sophos Group
- 11.2.10.1. Overview
- 11.2.10.2. Products
- 11.2.10.3. SWOT Analysis
- 11.2.10.4. Recent Developments
- 11.2.10.5. Financials (Based on Availability)
- 11.2.1 ABB
List of Figures
- Figure 1: Global Life Sciences Smart Manufacturing Services Revenue Breakdown (million, %) by Region 2024 & 2032
- Figure 2: North America Life Sciences Smart Manufacturing Services Revenue (million), by Application 2024 & 2032
- Figure 3: North America Life Sciences Smart Manufacturing Services Revenue Share (%), by Application 2024 & 2032
- Figure 4: North America Life Sciences Smart Manufacturing Services Revenue (million), by Types 2024 & 2032
- Figure 5: North America Life Sciences Smart Manufacturing Services Revenue Share (%), by Types 2024 & 2032
- Figure 6: North America Life Sciences Smart Manufacturing Services Revenue (million), by Country 2024 & 2032
- Figure 7: North America Life Sciences Smart Manufacturing Services Revenue Share (%), by Country 2024 & 2032
- Figure 8: South America Life Sciences Smart Manufacturing Services Revenue (million), by Application 2024 & 2032
- Figure 9: South America Life Sciences Smart Manufacturing Services Revenue Share (%), by Application 2024 & 2032
- Figure 10: South America Life Sciences Smart Manufacturing Services Revenue (million), by Types 2024 & 2032
- Figure 11: South America Life Sciences Smart Manufacturing Services Revenue Share (%), by Types 2024 & 2032
- Figure 12: South America Life Sciences Smart Manufacturing Services Revenue (million), by Country 2024 & 2032
- Figure 13: South America Life Sciences Smart Manufacturing Services Revenue Share (%), by Country 2024 & 2032
- Figure 14: Europe Life Sciences Smart Manufacturing Services Revenue (million), by Application 2024 & 2032
- Figure 15: Europe Life Sciences Smart Manufacturing Services Revenue Share (%), by Application 2024 & 2032
- Figure 16: Europe Life Sciences Smart Manufacturing Services Revenue (million), by Types 2024 & 2032
- Figure 17: Europe Life Sciences Smart Manufacturing Services Revenue Share (%), by Types 2024 & 2032
- Figure 18: Europe Life Sciences Smart Manufacturing Services Revenue (million), by Country 2024 & 2032
- Figure 19: Europe Life Sciences Smart Manufacturing Services Revenue Share (%), by Country 2024 & 2032
- Figure 20: Middle East & Africa Life Sciences Smart Manufacturing Services Revenue (million), by Application 2024 & 2032
- Figure 21: Middle East & Africa Life Sciences Smart Manufacturing Services Revenue Share (%), by Application 2024 & 2032
- Figure 22: Middle East & Africa Life Sciences Smart Manufacturing Services Revenue (million), by Types 2024 & 2032
- Figure 23: Middle East & Africa Life Sciences Smart Manufacturing Services Revenue Share (%), by Types 2024 & 2032
- Figure 24: Middle East & Africa Life Sciences Smart Manufacturing Services Revenue (million), by Country 2024 & 2032
- Figure 25: Middle East & Africa Life Sciences Smart Manufacturing Services Revenue Share (%), by Country 2024 & 2032
- Figure 26: Asia Pacific Life Sciences Smart Manufacturing Services Revenue (million), by Application 2024 & 2032
- Figure 27: Asia Pacific Life Sciences Smart Manufacturing Services Revenue Share (%), by Application 2024 & 2032
- Figure 28: Asia Pacific Life Sciences Smart Manufacturing Services Revenue (million), by Types 2024 & 2032
- Figure 29: Asia Pacific Life Sciences Smart Manufacturing Services Revenue Share (%), by Types 2024 & 2032
- Figure 30: Asia Pacific Life Sciences Smart Manufacturing Services Revenue (million), by Country 2024 & 2032
- Figure 31: Asia Pacific Life Sciences Smart Manufacturing Services Revenue Share (%), by Country 2024 & 2032
List of Tables
- Table 1: Global Life Sciences Smart Manufacturing Services Revenue million Forecast, by Region 2019 & 2032
- Table 2: Global Life Sciences Smart Manufacturing Services Revenue million Forecast, by Application 2019 & 2032
- Table 3: Global Life Sciences Smart Manufacturing Services Revenue million Forecast, by Types 2019 & 2032
- Table 4: Global Life Sciences Smart Manufacturing Services Revenue million Forecast, by Region 2019 & 2032
- Table 5: Global Life Sciences Smart Manufacturing Services Revenue million Forecast, by Application 2019 & 2032
- Table 6: Global Life Sciences Smart Manufacturing Services Revenue million Forecast, by Types 2019 & 2032
- Table 7: Global Life Sciences Smart Manufacturing Services Revenue million Forecast, by Country 2019 & 2032
- Table 8: United States Life Sciences Smart Manufacturing Services Revenue (million) Forecast, by Application 2019 & 2032
- Table 9: Canada Life Sciences Smart Manufacturing Services Revenue (million) Forecast, by Application 2019 & 2032
- Table 10: Mexico Life Sciences Smart Manufacturing Services Revenue (million) Forecast, by Application 2019 & 2032
- Table 11: Global Life Sciences Smart Manufacturing Services Revenue million Forecast, by Application 2019 & 2032
- Table 12: Global Life Sciences Smart Manufacturing Services Revenue million Forecast, by Types 2019 & 2032
- Table 13: Global Life Sciences Smart Manufacturing Services Revenue million Forecast, by Country 2019 & 2032
- Table 14: Brazil Life Sciences Smart Manufacturing Services Revenue (million) Forecast, by Application 2019 & 2032
- Table 15: Argentina Life Sciences Smart Manufacturing Services Revenue (million) Forecast, by Application 2019 & 2032
- Table 16: Rest of South America Life Sciences Smart Manufacturing Services Revenue (million) Forecast, by Application 2019 & 2032
- Table 17: Global Life Sciences Smart Manufacturing Services Revenue million Forecast, by Application 2019 & 2032
- Table 18: Global Life Sciences Smart Manufacturing Services Revenue million Forecast, by Types 2019 & 2032
- Table 19: Global Life Sciences Smart Manufacturing Services Revenue million Forecast, by Country 2019 & 2032
- Table 20: United Kingdom Life Sciences Smart Manufacturing Services Revenue (million) Forecast, by Application 2019 & 2032
- Table 21: Germany Life Sciences Smart Manufacturing Services Revenue (million) Forecast, by Application 2019 & 2032
- Table 22: France Life Sciences Smart Manufacturing Services Revenue (million) Forecast, by Application 2019 & 2032
- Table 23: Italy Life Sciences Smart Manufacturing Services Revenue (million) Forecast, by Application 2019 & 2032
- Table 24: Spain Life Sciences Smart Manufacturing Services Revenue (million) Forecast, by Application 2019 & 2032
- Table 25: Russia Life Sciences Smart Manufacturing Services Revenue (million) Forecast, by Application 2019 & 2032
- Table 26: Benelux Life Sciences Smart Manufacturing Services Revenue (million) Forecast, by Application 2019 & 2032
- Table 27: Nordics Life Sciences Smart Manufacturing Services Revenue (million) Forecast, by Application 2019 & 2032
- Table 28: Rest of Europe Life Sciences Smart Manufacturing Services Revenue (million) Forecast, by Application 2019 & 2032
- Table 29: Global Life Sciences Smart Manufacturing Services Revenue million Forecast, by Application 2019 & 2032
- Table 30: Global Life Sciences Smart Manufacturing Services Revenue million Forecast, by Types 2019 & 2032
- Table 31: Global Life Sciences Smart Manufacturing Services Revenue million Forecast, by Country 2019 & 2032
- Table 32: Turkey Life Sciences Smart Manufacturing Services Revenue (million) Forecast, by Application 2019 & 2032
- Table 33: Israel Life Sciences Smart Manufacturing Services Revenue (million) Forecast, by Application 2019 & 2032
- Table 34: GCC Life Sciences Smart Manufacturing Services Revenue (million) Forecast, by Application 2019 & 2032
- Table 35: North Africa Life Sciences Smart Manufacturing Services Revenue (million) Forecast, by Application 2019 & 2032
- Table 36: South Africa Life Sciences Smart Manufacturing Services Revenue (million) Forecast, by Application 2019 & 2032
- Table 37: Rest of Middle East & Africa Life Sciences Smart Manufacturing Services Revenue (million) Forecast, by Application 2019 & 2032
- Table 38: Global Life Sciences Smart Manufacturing Services Revenue million Forecast, by Application 2019 & 2032
- Table 39: Global Life Sciences Smart Manufacturing Services Revenue million Forecast, by Types 2019 & 2032
- Table 40: Global Life Sciences Smart Manufacturing Services Revenue million Forecast, by Country 2019 & 2032
- Table 41: China Life Sciences Smart Manufacturing Services Revenue (million) Forecast, by Application 2019 & 2032
- Table 42: India Life Sciences Smart Manufacturing Services Revenue (million) Forecast, by Application 2019 & 2032
- Table 43: Japan Life Sciences Smart Manufacturing Services Revenue (million) Forecast, by Application 2019 & 2032
- Table 44: South Korea Life Sciences Smart Manufacturing Services Revenue (million) Forecast, by Application 2019 & 2032
- Table 45: ASEAN Life Sciences Smart Manufacturing Services Revenue (million) Forecast, by Application 2019 & 2032
- Table 46: Oceania Life Sciences Smart Manufacturing Services Revenue (million) Forecast, by Application 2019 & 2032
- Table 47: Rest of Asia Pacific Life Sciences Smart Manufacturing Services Revenue (million) Forecast, by Application 2019 & 2032
Frequently Asked Questions
1. What is the projected Compound Annual Growth Rate (CAGR) of the Life Sciences Smart Manufacturing Services?
The projected CAGR is approximately XX%.
2. Which companies are prominent players in the Life Sciences Smart Manufacturing Services?
Key companies in the market include ABB, Bosch Rexroth, Emerson Electric, Fortinet, General Electric, Honeywell International, IBM Corporation, Rockwell Automation, Siemens, Sophos Group.
3. What are the main segments of the Life Sciences Smart Manufacturing Services?
The market segments include Application, Types.
4. Can you provide details about the market size?
The market size is estimated to be USD XXX million as of 2022.
5. What are some drivers contributing to market growth?
N/A
6. What are the notable trends driving market growth?
N/A
7. Are there any restraints impacting market growth?
N/A
8. Can you provide examples of recent developments in the market?
N/A
9. What pricing options are available for accessing the report?
Pricing options include single-user, multi-user, and enterprise licenses priced at USD 4900.00, USD 7350.00, and USD 9800.00 respectively.
10. Is the market size provided in terms of value or volume?
The market size is provided in terms of value, measured in million.
11. Are there any specific market keywords associated with the report?
Yes, the market keyword associated with the report is "Life Sciences Smart Manufacturing Services," which aids in identifying and referencing the specific market segment covered.
12. How do I determine which pricing option suits my needs best?
The pricing options vary based on user requirements and access needs. Individual users may opt for single-user licenses, while businesses requiring broader access may choose multi-user or enterprise licenses for cost-effective access to the report.
13. Are there any additional resources or data provided in the Life Sciences Smart Manufacturing Services report?
While the report offers comprehensive insights, it's advisable to review the specific contents or supplementary materials provided to ascertain if additional resources or data are available.
14. How can I stay updated on further developments or reports in the Life Sciences Smart Manufacturing Services?
To stay informed about further developments, trends, and reports in the Life Sciences Smart Manufacturing Services, consider subscribing to industry newsletters, following relevant companies and organizations, or regularly checking reputable industry news sources and publications.
Methodology
Step 1 - Identification of Relevant Samples Size from Population Database


Step 2 - Approaches for Defining Global Market Size (Value, Volume* & Price*)

Note*: In applicable scenarios
Step 3 - Data Sources
Primary Research
- Web Analytics
- Survey Reports
- Research Institute
- Latest Research Reports
- Opinion Leaders
Secondary Research
- Annual Reports
- White Paper
- Latest Press Release
- Industry Association
- Paid Database
- Investor Presentations

Step 4 - Data Triangulation
Involves using different sources of information in order to increase the validity of a study
These sources are likely to be stakeholders in a program - participants, other researchers, program staff, other community members, and so on.
Then we put all data in single framework & apply various statistical tools to find out the dynamic on the market.
During the analysis stage, feedback from the stakeholder groups would be compared to determine areas of agreement as well as areas of divergence
