

Key Insights
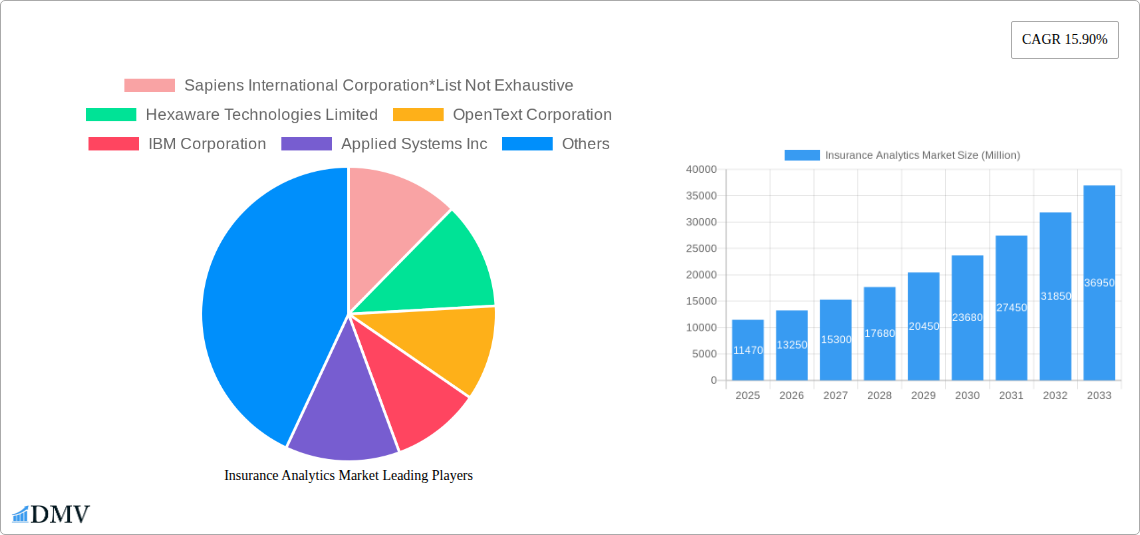
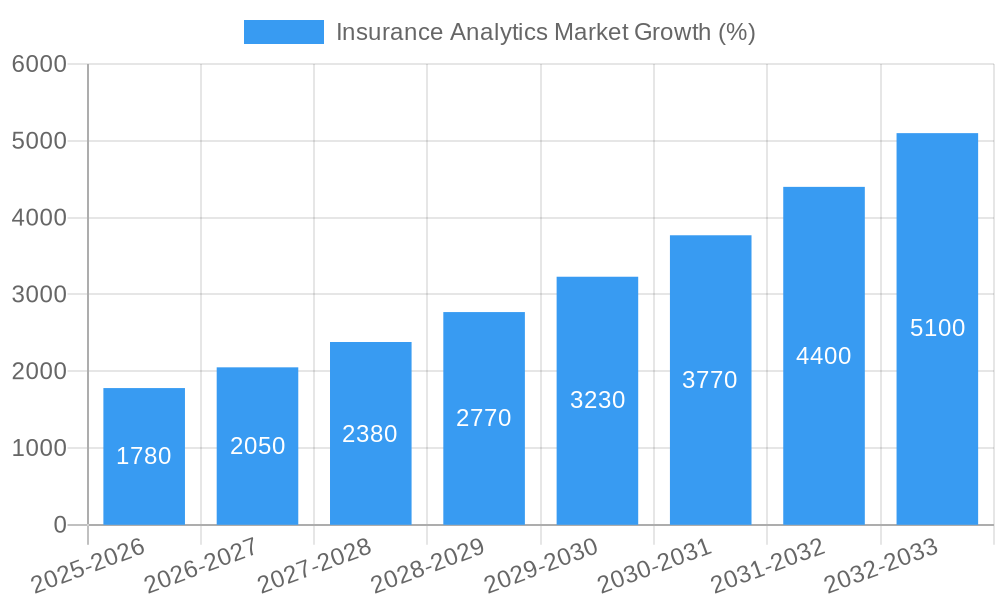
The Insurance Analytics market is experiencing robust growth, projected to reach \$11.47 billion in 2025 and maintain a Compound Annual Growth Rate (CAGR) of 15.90% from 2025 to 2033. This expansion is driven by several key factors. Firstly, the increasing volume and complexity of insurance data necessitate sophisticated analytical tools for efficient claims processing, risk assessment, and fraud detection. Secondly, the rising adoption of cloud-based solutions offers scalability, cost-effectiveness, and enhanced data accessibility, fueling market growth. Furthermore, regulatory compliance requirements and the need for personalized customer experiences are pushing insurers to leverage advanced analytics for improved decision-making. The market is segmented by component (tools and services), business application (claims management, risk management, process optimization, customer management, and personalization), deployment mode (on-premise and cloud), and end-user (insurance companies, government agencies, third-party administrators, brokers, and consultancies). North America currently holds a significant market share, but the Asia-Pacific region is projected to witness substantial growth due to increasing digitalization and the expanding insurance sector in developing economies. Competitive dynamics are shaped by a mix of established technology vendors and specialized insurance analytics providers, leading to innovation and a wider range of solutions.
The competitive landscape includes major players like Sapiens International Corporation, Hexaware Technologies Limited, OpenText Corporation, IBM Corporation, Applied Systems Inc, MicroStrategy Incorporated, Guidewire Software Inc, Microsoft Corporation, Oracle Corporation, and LexisNexis Risk Solutions, each offering unique capabilities and targeting specific market segments. Growth in the coming years will likely be fueled by the increasing adoption of Artificial Intelligence (AI) and Machine Learning (ML) in insurance analytics, enabling predictive modeling, real-time risk assessment, and automated decision-making. The market's continued expansion is also contingent upon overcoming challenges such as data security concerns, the need for skilled analytics professionals, and the integration of legacy systems with modern analytical platforms. Companies are investing heavily in research and development to enhance the accuracy and efficiency of their analytical tools, leading to a more sophisticated and refined market landscape.
Insurance Analytics Market: A Comprehensive Report (2019-2033)
This insightful report provides a detailed analysis of the Insurance Analytics Market, projecting a market value of xx Million by 2033. It offers a comprehensive overview of market trends, key players, technological advancements, and future growth opportunities, covering the period from 2019 to 2033, with 2025 as the base and estimated year. The report is crucial for stakeholders seeking to understand the market landscape and make informed strategic decisions.
Insurance Analytics Market Composition & Trends
The Insurance Analytics Market is characterized by a moderately concentrated landscape, with several major players holding significant market share. However, the market exhibits considerable dynamism driven by continuous technological innovation and evolving regulatory environments. Substitute products, while present, often lack the specialized capabilities and integration necessary for the complex insurance domain. End-users are increasingly diverse, encompassing insurance companies, government agencies, third-party administrators, brokers, and consultancies. Mergers and acquisitions (M&A) activity is notable, with deal values fluctuating based on target company size and technological capabilities. For instance, M&A activities in 2024 totaled approximately xx Million, representing a xx% increase from the previous year.
- Market Share Distribution (2024): Top 5 players hold approximately xx% of the market share.
- Average M&A Deal Value (2024): xx Million
- Innovation Catalysts: Advancements in AI, machine learning, big data analytics, and cloud computing are driving innovation.
- Regulatory Landscape: GDPR, CCPA, and other data privacy regulations are shaping market practices.
Insurance Analytics Market Industry Evolution
The Insurance Analytics Market has experienced robust growth over the past few years, fueled by the increasing adoption of data-driven decision-making within the insurance sector. The market has witnessed a compound annual growth rate (CAGR) of xx% during the historical period (2019-2024) and is projected to maintain a CAGR of xx% during the forecast period (2025-2033). This growth is driven by several factors, including the rising volume of data generated by insurance companies, the need for improved risk management and fraud detection, and the increasing demand for personalized customer experiences. Technological advancements, such as the emergence of cloud-based analytics platforms and the increasing sophistication of AI algorithms, have significantly contributed to the evolution of the market. Furthermore, shifting consumer demands, particularly for faster and more efficient service, are driving the adoption of analytics solutions that can automate processes and enhance customer satisfaction. The adoption rate of cloud-based solutions is increasing rapidly, with xx% of insurance companies already using cloud-based platforms in 2024, projected to reach xx% by 2033.
Leading Regions, Countries, or Segments in Insurance Analytics Market
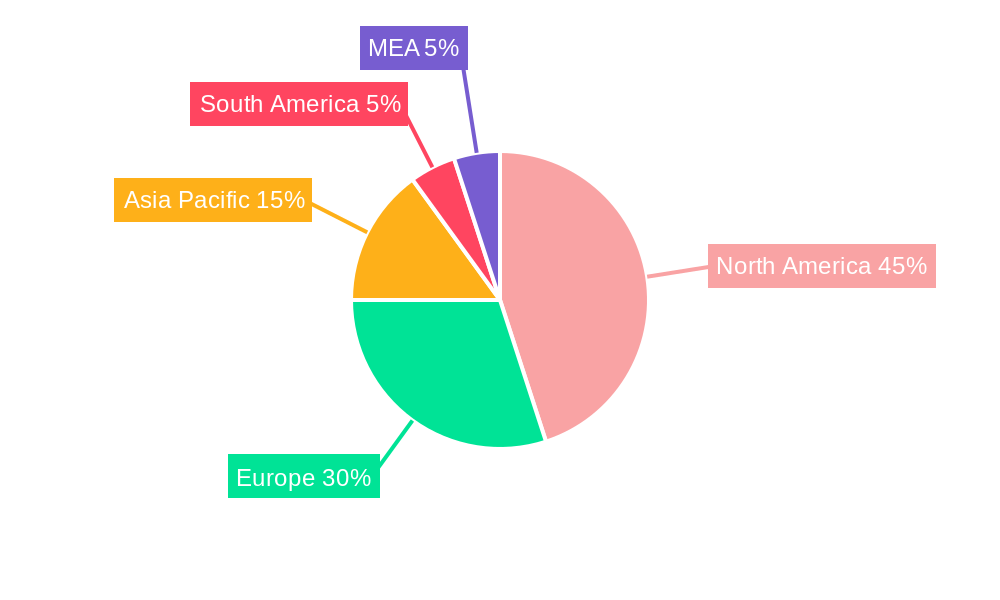
The North American region currently dominates the Insurance Analytics Market, driven by high technological adoption rates, substantial investments in data analytics, and a well-developed regulatory framework. However, the Asia-Pacific region is experiencing rapid growth, fueled by increasing digitalization and expanding insurance penetration.
By Component: The services segment holds a larger market share compared to the tool segment due to the demand for customized solutions and ongoing support from vendors.
By Business Application: Claims management currently represents the largest segment, driven by the need to streamline claim processing and reduce costs. However, risk management and customer management and personalization are rapidly gaining traction.
By Deployment Mode: Cloud deployment is experiencing significant growth, favored for its scalability and cost-effectiveness.
By End-User: Insurance companies represent the largest segment, followed by third-party administrators.
- Key Drivers (North America): High investment in technology, stringent regulatory compliance, early adoption of advanced analytics.
- Key Drivers (Asia-Pacific): Rapid digital transformation, rising insurance penetration, growing demand for personalized services.
Insurance Analytics Market Product Innovations
Recent innovations include the integration of AI and machine learning for more accurate risk assessment, predictive modeling, and fraud detection. Cloud-based platforms offer scalability, accessibility, and cost-effectiveness. The focus is on user-friendly interfaces and seamless data integration to improve operational efficiency and decision-making. Unique selling propositions often emphasize improved accuracy, faster processing times, and reduced operational costs.
Propelling Factors for Insurance Analytics Market Growth
Technological advancements, such as AI, machine learning, and big data analytics, are key drivers. The increasing volume of data generated by the insurance industry necessitates sophisticated analytics solutions. Furthermore, economic factors, including the need to optimize operational efficiency and reduce costs, are driving adoption. Favorable regulatory environments promoting data-driven decision-making also contribute to market growth. For example, the increasing adoption of GDPR and other regulations is pushing companies to improve their data management practices.
Obstacles in the Insurance Analytics Market
Regulatory hurdles regarding data privacy and security represent significant obstacles. Supply chain disruptions can impact the delivery and implementation of analytics solutions. Intense competition among established players and new entrants creates pricing pressures. The complexity of integrating new analytics solutions into existing legacy systems presents implementation challenges for some organizations. These factors are projected to cause a xx% decrease in market growth in 2027.
Future Opportunities in Insurance Analytics Market
Emerging opportunities lie in the expansion into new markets, particularly in developing economies. The adoption of advanced technologies like IoT and blockchain presents significant potential for innovation. Growth in the use of predictive analytics for personalized customer experiences offers promising future avenues. Focus on the development of solutions addressing specific industry niches further expands the market potential.
Major Players in the Insurance Analytics Market Ecosystem
- Sapiens International Corporation
- Hexaware Technologies Limited
- OpenText Corporation
- IBM Corporation
- Applied Systems Inc
- MicroStrategy Incorporated
- Guidewire Software Inc
- Microsoft Corporation
- Oracle Corporation
- LexisNexis Risk Solutions
Key Developments in Insurance Analytics Market Industry
- April 2023: Guidewire launched Garmisch, a self-service tool on the Guidewire Cloud Console, enabling faster implementation of digital claims experiences.
- February 2023: MS Amlin Insurance S.E. adopted Sapiens IDITSuite, improving risk selection and lowering claim expense ratios.
Strategic Insurance Analytics Market Forecast
The Insurance Analytics Market is poised for continued growth, driven by ongoing technological advancements and increasing demand for data-driven decision-making across the insurance sector. The market's potential is substantial, with opportunities for innovation across various segments. The increasing adoption of cloud-based solutions and the expanding use of AI and machine learning will shape the market's future trajectory. The focus on improving operational efficiency and enhancing customer experience will continue to drive market growth throughout the forecast period.
Insurance Analytics Market Segmentation
-
1. Component
- 1.1. Tool
- 1.2. Services
-
2. Business Application (Qualitative Analysis)
- 2.1. Claims Management
- 2.2. Risk Management
- 2.3. Process Optimization
- 2.4. Customer Management and Personalization
-
3. Deployment Mode
- 3.1. On-premise
- 3.2. Cloud
-
4. End-User
- 4.1. Insurance Companies
- 4.2. Government Agencies
- 4.3. Third-pa
Insurance Analytics Market Segmentation By Geography
- 1. North America
- 2. Europe
- 3. Asia Pacific
- 4. Rest of the World
Insurance Analytics Market REPORT HIGHLIGHTS
| Aspects | Details |
|---|---|
| Study Period | 2019-2033 |
| Base Year | 2024 |
| Estimated Year | 2025 |
| Forecast Period | 2025-2033 |
| Historical Period | 2019-2024 |
| Growth Rate | CAGR of 15.90% from 2019-2033 |
| Segmentation |
|
Table of Contents
- 1. Introduction
- 1.1. Research Scope
- 1.2. Market Segmentation
- 1.3. Research Methodology
- 1.4. Definitions and Assumptions
- 2. Executive Summary
- 2.1. Introduction
- 3. Market Dynamics
- 3.1. Introduction
- 3.2. Market Drivers
- 3.2.1. Increased Adoption of Advanced Technologies; Rise in Competition among the Insurance Sector
- 3.3. Market Restrains
- 3.3.1. Stringent Government Regulations; Privacy and Security Concern
- 3.4. Market Trends
- 3.4.1. Increasing Risks And Fraudulent Activities Are Boosting the Adoption Of Insurance Analytics.
- 4. Market Factor Analysis
- 4.1. Porters Five Forces
- 4.2. Supply/Value Chain
- 4.3. PESTEL analysis
- 4.4. Market Entropy
- 4.5. Patent/Trademark Analysis
- 5. Global Insurance Analytics Market Analysis, Insights and Forecast, 2019-2031
- 5.1. Market Analysis, Insights and Forecast - by Component
- 5.1.1. Tool
- 5.1.2. Services
- 5.2. Market Analysis, Insights and Forecast - by Business Application (Qualitative Analysis)
- 5.2.1. Claims Management
- 5.2.2. Risk Management
- 5.2.3. Process Optimization
- 5.2.4. Customer Management and Personalization
- 5.3. Market Analysis, Insights and Forecast - by Deployment Mode
- 5.3.1. On-premise
- 5.3.2. Cloud
- 5.4. Market Analysis, Insights and Forecast - by End-User
- 5.4.1. Insurance Companies
- 5.4.2. Government Agencies
- 5.4.3. Third-pa
- 5.5. Market Analysis, Insights and Forecast - by Region
- 5.5.1. North America
- 5.5.2. Europe
- 5.5.3. Asia Pacific
- 5.5.4. Rest of the World
- 5.1. Market Analysis, Insights and Forecast - by Component
- 6. North America Insurance Analytics Market Analysis, Insights and Forecast, 2019-2031
- 6.1. Market Analysis, Insights and Forecast - by Component
- 6.1.1. Tool
- 6.1.2. Services
- 6.2. Market Analysis, Insights and Forecast - by Business Application (Qualitative Analysis)
- 6.2.1. Claims Management
- 6.2.2. Risk Management
- 6.2.3. Process Optimization
- 6.2.4. Customer Management and Personalization
- 6.3. Market Analysis, Insights and Forecast - by Deployment Mode
- 6.3.1. On-premise
- 6.3.2. Cloud
- 6.4. Market Analysis, Insights and Forecast - by End-User
- 6.4.1. Insurance Companies
- 6.4.2. Government Agencies
- 6.4.3. Third-pa
- 6.1. Market Analysis, Insights and Forecast - by Component
- 7. Europe Insurance Analytics Market Analysis, Insights and Forecast, 2019-2031
- 7.1. Market Analysis, Insights and Forecast - by Component
- 7.1.1. Tool
- 7.1.2. Services
- 7.2. Market Analysis, Insights and Forecast - by Business Application (Qualitative Analysis)
- 7.2.1. Claims Management
- 7.2.2. Risk Management
- 7.2.3. Process Optimization
- 7.2.4. Customer Management and Personalization
- 7.3. Market Analysis, Insights and Forecast - by Deployment Mode
- 7.3.1. On-premise
- 7.3.2. Cloud
- 7.4. Market Analysis, Insights and Forecast - by End-User
- 7.4.1. Insurance Companies
- 7.4.2. Government Agencies
- 7.4.3. Third-pa
- 7.1. Market Analysis, Insights and Forecast - by Component
- 8. Asia Pacific Insurance Analytics Market Analysis, Insights and Forecast, 2019-2031
- 8.1. Market Analysis, Insights and Forecast - by Component
- 8.1.1. Tool
- 8.1.2. Services
- 8.2. Market Analysis, Insights and Forecast - by Business Application (Qualitative Analysis)
- 8.2.1. Claims Management
- 8.2.2. Risk Management
- 8.2.3. Process Optimization
- 8.2.4. Customer Management and Personalization
- 8.3. Market Analysis, Insights and Forecast - by Deployment Mode
- 8.3.1. On-premise
- 8.3.2. Cloud
- 8.4. Market Analysis, Insights and Forecast - by End-User
- 8.4.1. Insurance Companies
- 8.4.2. Government Agencies
- 8.4.3. Third-pa
- 8.1. Market Analysis, Insights and Forecast - by Component
- 9. Rest of the World Insurance Analytics Market Analysis, Insights and Forecast, 2019-2031
- 9.1. Market Analysis, Insights and Forecast - by Component
- 9.1.1. Tool
- 9.1.2. Services
- 9.2. Market Analysis, Insights and Forecast - by Business Application (Qualitative Analysis)
- 9.2.1. Claims Management
- 9.2.2. Risk Management
- 9.2.3. Process Optimization
- 9.2.4. Customer Management and Personalization
- 9.3. Market Analysis, Insights and Forecast - by Deployment Mode
- 9.3.1. On-premise
- 9.3.2. Cloud
- 9.4. Market Analysis, Insights and Forecast - by End-User
- 9.4.1. Insurance Companies
- 9.4.2. Government Agencies
- 9.4.3. Third-pa
- 9.1. Market Analysis, Insights and Forecast - by Component
- 10. North America Insurance Analytics Market Analysis, Insights and Forecast, 2019-2031
- 10.1. Market Analysis, Insights and Forecast - By Country/Sub-region
- 10.1.1 United States
- 10.1.2 Canada
- 10.1.3 Mexico
- 11. Europe Insurance Analytics Market Analysis, Insights and Forecast, 2019-2031
- 11.1. Market Analysis, Insights and Forecast - By Country/Sub-region
- 11.1.1 Germany
- 11.1.2 United Kingdom
- 11.1.3 France
- 11.1.4 Spain
- 11.1.5 Italy
- 11.1.6 Spain
- 11.1.7 Belgium
- 11.1.8 Netherland
- 11.1.9 Nordics
- 11.1.10 Rest of Europe
- 12. Asia Pacific Insurance Analytics Market Analysis, Insights and Forecast, 2019-2031
- 12.1. Market Analysis, Insights and Forecast - By Country/Sub-region
- 12.1.1 China
- 12.1.2 Japan
- 12.1.3 India
- 12.1.4 South Korea
- 12.1.5 Southeast Asia
- 12.1.6 Australia
- 12.1.7 Indonesia
- 12.1.8 Phillipes
- 12.1.9 Singapore
- 12.1.10 Thailandc
- 12.1.11 Rest of Asia Pacific
- 13. South America Insurance Analytics Market Analysis, Insights and Forecast, 2019-2031
- 13.1. Market Analysis, Insights and Forecast - By Country/Sub-region
- 13.1.1 Brazil
- 13.1.2 Argentina
- 13.1.3 Peru
- 13.1.4 Chile
- 13.1.5 Colombia
- 13.1.6 Ecuador
- 13.1.7 Venezuela
- 13.1.8 Rest of South America
- 14. North America Insurance Analytics Market Analysis, Insights and Forecast, 2019-2031
- 14.1. Market Analysis, Insights and Forecast - By Country/Sub-region
- 14.1.1 United States
- 14.1.2 Canada
- 14.1.3 Mexico
- 15. MEA Insurance Analytics Market Analysis, Insights and Forecast, 2019-2031
- 15.1. Market Analysis, Insights and Forecast - By Country/Sub-region
- 15.1.1 United Arab Emirates
- 15.1.2 Saudi Arabia
- 15.1.3 South Africa
- 15.1.4 Rest of Middle East and Africa
- 16. Competitive Analysis
- 16.1. Global Market Share Analysis 2024
- 16.2. Company Profiles
- 16.2.1 Sapiens International Corporation*List Not Exhaustive
- 16.2.1.1. Overview
- 16.2.1.2. Products
- 16.2.1.3. SWOT Analysis
- 16.2.1.4. Recent Developments
- 16.2.1.5. Financials (Based on Availability)
- 16.2.2 Hexaware Technologies Limited
- 16.2.2.1. Overview
- 16.2.2.2. Products
- 16.2.2.3. SWOT Analysis
- 16.2.2.4. Recent Developments
- 16.2.2.5. Financials (Based on Availability)
- 16.2.3 OpenText Corporation
- 16.2.3.1. Overview
- 16.2.3.2. Products
- 16.2.3.3. SWOT Analysis
- 16.2.3.4. Recent Developments
- 16.2.3.5. Financials (Based on Availability)
- 16.2.4 IBM Corporation
- 16.2.4.1. Overview
- 16.2.4.2. Products
- 16.2.4.3. SWOT Analysis
- 16.2.4.4. Recent Developments
- 16.2.4.5. Financials (Based on Availability)
- 16.2.5 Applied Systems Inc
- 16.2.5.1. Overview
- 16.2.5.2. Products
- 16.2.5.3. SWOT Analysis
- 16.2.5.4. Recent Developments
- 16.2.5.5. Financials (Based on Availability)
- 16.2.6 MicroStrategy Incorporated
- 16.2.6.1. Overview
- 16.2.6.2. Products
- 16.2.6.3. SWOT Analysis
- 16.2.6.4. Recent Developments
- 16.2.6.5. Financials (Based on Availability)
- 16.2.7 Guidewire Software Inc
- 16.2.7.1. Overview
- 16.2.7.2. Products
- 16.2.7.3. SWOT Analysis
- 16.2.7.4. Recent Developments
- 16.2.7.5. Financials (Based on Availability)
- 16.2.8 Microsoft Corporation
- 16.2.8.1. Overview
- 16.2.8.2. Products
- 16.2.8.3. SWOT Analysis
- 16.2.8.4. Recent Developments
- 16.2.8.5. Financials (Based on Availability)
- 16.2.9 Oracle Corporation
- 16.2.9.1. Overview
- 16.2.9.2. Products
- 16.2.9.3. SWOT Analysis
- 16.2.9.4. Recent Developments
- 16.2.9.5. Financials (Based on Availability)
- 16.2.10 LexisNexis Risk Solutions
- 16.2.10.1. Overview
- 16.2.10.2. Products
- 16.2.10.3. SWOT Analysis
- 16.2.10.4. Recent Developments
- 16.2.10.5. Financials (Based on Availability)
- 16.2.1 Sapiens International Corporation*List Not Exhaustive
List of Figures
- Figure 1: Global Insurance Analytics Market Revenue Breakdown (Million, %) by Region 2024 & 2032
- Figure 2: North America Insurance Analytics Market Revenue (Million), by Country 2024 & 2032
- Figure 3: North America Insurance Analytics Market Revenue Share (%), by Country 2024 & 2032
- Figure 4: Europe Insurance Analytics Market Revenue (Million), by Country 2024 & 2032
- Figure 5: Europe Insurance Analytics Market Revenue Share (%), by Country 2024 & 2032
- Figure 6: Asia Pacific Insurance Analytics Market Revenue (Million), by Country 2024 & 2032
- Figure 7: Asia Pacific Insurance Analytics Market Revenue Share (%), by Country 2024 & 2032
- Figure 8: South America Insurance Analytics Market Revenue (Million), by Country 2024 & 2032
- Figure 9: South America Insurance Analytics Market Revenue Share (%), by Country 2024 & 2032
- Figure 10: North America Insurance Analytics Market Revenue (Million), by Country 2024 & 2032
- Figure 11: North America Insurance Analytics Market Revenue Share (%), by Country 2024 & 2032
- Figure 12: MEA Insurance Analytics Market Revenue (Million), by Country 2024 & 2032
- Figure 13: MEA Insurance Analytics Market Revenue Share (%), by Country 2024 & 2032
- Figure 14: North America Insurance Analytics Market Revenue (Million), by Component 2024 & 2032
- Figure 15: North America Insurance Analytics Market Revenue Share (%), by Component 2024 & 2032
- Figure 16: North America Insurance Analytics Market Revenue (Million), by Business Application (Qualitative Analysis) 2024 & 2032
- Figure 17: North America Insurance Analytics Market Revenue Share (%), by Business Application (Qualitative Analysis) 2024 & 2032
- Figure 18: North America Insurance Analytics Market Revenue (Million), by Deployment Mode 2024 & 2032
- Figure 19: North America Insurance Analytics Market Revenue Share (%), by Deployment Mode 2024 & 2032
- Figure 20: North America Insurance Analytics Market Revenue (Million), by End-User 2024 & 2032
- Figure 21: North America Insurance Analytics Market Revenue Share (%), by End-User 2024 & 2032
- Figure 22: North America Insurance Analytics Market Revenue (Million), by Country 2024 & 2032
- Figure 23: North America Insurance Analytics Market Revenue Share (%), by Country 2024 & 2032
- Figure 24: Europe Insurance Analytics Market Revenue (Million), by Component 2024 & 2032
- Figure 25: Europe Insurance Analytics Market Revenue Share (%), by Component 2024 & 2032
- Figure 26: Europe Insurance Analytics Market Revenue (Million), by Business Application (Qualitative Analysis) 2024 & 2032
- Figure 27: Europe Insurance Analytics Market Revenue Share (%), by Business Application (Qualitative Analysis) 2024 & 2032
- Figure 28: Europe Insurance Analytics Market Revenue (Million), by Deployment Mode 2024 & 2032
- Figure 29: Europe Insurance Analytics Market Revenue Share (%), by Deployment Mode 2024 & 2032
- Figure 30: Europe Insurance Analytics Market Revenue (Million), by End-User 2024 & 2032
- Figure 31: Europe Insurance Analytics Market Revenue Share (%), by End-User 2024 & 2032
- Figure 32: Europe Insurance Analytics Market Revenue (Million), by Country 2024 & 2032
- Figure 33: Europe Insurance Analytics Market Revenue Share (%), by Country 2024 & 2032
- Figure 34: Asia Pacific Insurance Analytics Market Revenue (Million), by Component 2024 & 2032
- Figure 35: Asia Pacific Insurance Analytics Market Revenue Share (%), by Component 2024 & 2032
- Figure 36: Asia Pacific Insurance Analytics Market Revenue (Million), by Business Application (Qualitative Analysis) 2024 & 2032
- Figure 37: Asia Pacific Insurance Analytics Market Revenue Share (%), by Business Application (Qualitative Analysis) 2024 & 2032
- Figure 38: Asia Pacific Insurance Analytics Market Revenue (Million), by Deployment Mode 2024 & 2032
- Figure 39: Asia Pacific Insurance Analytics Market Revenue Share (%), by Deployment Mode 2024 & 2032
- Figure 40: Asia Pacific Insurance Analytics Market Revenue (Million), by End-User 2024 & 2032
- Figure 41: Asia Pacific Insurance Analytics Market Revenue Share (%), by End-User 2024 & 2032
- Figure 42: Asia Pacific Insurance Analytics Market Revenue (Million), by Country 2024 & 2032
- Figure 43: Asia Pacific Insurance Analytics Market Revenue Share (%), by Country 2024 & 2032
- Figure 44: Rest of the World Insurance Analytics Market Revenue (Million), by Component 2024 & 2032
- Figure 45: Rest of the World Insurance Analytics Market Revenue Share (%), by Component 2024 & 2032
- Figure 46: Rest of the World Insurance Analytics Market Revenue (Million), by Business Application (Qualitative Analysis) 2024 & 2032
- Figure 47: Rest of the World Insurance Analytics Market Revenue Share (%), by Business Application (Qualitative Analysis) 2024 & 2032
- Figure 48: Rest of the World Insurance Analytics Market Revenue (Million), by Deployment Mode 2024 & 2032
- Figure 49: Rest of the World Insurance Analytics Market Revenue Share (%), by Deployment Mode 2024 & 2032
- Figure 50: Rest of the World Insurance Analytics Market Revenue (Million), by End-User 2024 & 2032
- Figure 51: Rest of the World Insurance Analytics Market Revenue Share (%), by End-User 2024 & 2032
- Figure 52: Rest of the World Insurance Analytics Market Revenue (Million), by Country 2024 & 2032
- Figure 53: Rest of the World Insurance Analytics Market Revenue Share (%), by Country 2024 & 2032
List of Tables
- Table 1: Global Insurance Analytics Market Revenue Million Forecast, by Region 2019 & 2032
- Table 2: Global Insurance Analytics Market Revenue Million Forecast, by Component 2019 & 2032
- Table 3: Global Insurance Analytics Market Revenue Million Forecast, by Business Application (Qualitative Analysis) 2019 & 2032
- Table 4: Global Insurance Analytics Market Revenue Million Forecast, by Deployment Mode 2019 & 2032
- Table 5: Global Insurance Analytics Market Revenue Million Forecast, by End-User 2019 & 2032
- Table 6: Global Insurance Analytics Market Revenue Million Forecast, by Region 2019 & 2032
- Table 7: Global Insurance Analytics Market Revenue Million Forecast, by Country 2019 & 2032
- Table 8: United States Insurance Analytics Market Revenue (Million) Forecast, by Application 2019 & 2032
- Table 9: Canada Insurance Analytics Market Revenue (Million) Forecast, by Application 2019 & 2032
- Table 10: Mexico Insurance Analytics Market Revenue (Million) Forecast, by Application 2019 & 2032
- Table 11: Global Insurance Analytics Market Revenue Million Forecast, by Country 2019 & 2032
- Table 12: Germany Insurance Analytics Market Revenue (Million) Forecast, by Application 2019 & 2032
- Table 13: United Kingdom Insurance Analytics Market Revenue (Million) Forecast, by Application 2019 & 2032
- Table 14: France Insurance Analytics Market Revenue (Million) Forecast, by Application 2019 & 2032
- Table 15: Spain Insurance Analytics Market Revenue (Million) Forecast, by Application 2019 & 2032
- Table 16: Italy Insurance Analytics Market Revenue (Million) Forecast, by Application 2019 & 2032
- Table 17: Spain Insurance Analytics Market Revenue (Million) Forecast, by Application 2019 & 2032
- Table 18: Belgium Insurance Analytics Market Revenue (Million) Forecast, by Application 2019 & 2032
- Table 19: Netherland Insurance Analytics Market Revenue (Million) Forecast, by Application 2019 & 2032
- Table 20: Nordics Insurance Analytics Market Revenue (Million) Forecast, by Application 2019 & 2032
- Table 21: Rest of Europe Insurance Analytics Market Revenue (Million) Forecast, by Application 2019 & 2032
- Table 22: Global Insurance Analytics Market Revenue Million Forecast, by Country 2019 & 2032
- Table 23: China Insurance Analytics Market Revenue (Million) Forecast, by Application 2019 & 2032
- Table 24: Japan Insurance Analytics Market Revenue (Million) Forecast, by Application 2019 & 2032
- Table 25: India Insurance Analytics Market Revenue (Million) Forecast, by Application 2019 & 2032
- Table 26: South Korea Insurance Analytics Market Revenue (Million) Forecast, by Application 2019 & 2032
- Table 27: Southeast Asia Insurance Analytics Market Revenue (Million) Forecast, by Application 2019 & 2032
- Table 28: Australia Insurance Analytics Market Revenue (Million) Forecast, by Application 2019 & 2032
- Table 29: Indonesia Insurance Analytics Market Revenue (Million) Forecast, by Application 2019 & 2032
- Table 30: Phillipes Insurance Analytics Market Revenue (Million) Forecast, by Application 2019 & 2032
- Table 31: Singapore Insurance Analytics Market Revenue (Million) Forecast, by Application 2019 & 2032
- Table 32: Thailandc Insurance Analytics Market Revenue (Million) Forecast, by Application 2019 & 2032
- Table 33: Rest of Asia Pacific Insurance Analytics Market Revenue (Million) Forecast, by Application 2019 & 2032
- Table 34: Global Insurance Analytics Market Revenue Million Forecast, by Country 2019 & 2032
- Table 35: Brazil Insurance Analytics Market Revenue (Million) Forecast, by Application 2019 & 2032
- Table 36: Argentina Insurance Analytics Market Revenue (Million) Forecast, by Application 2019 & 2032
- Table 37: Peru Insurance Analytics Market Revenue (Million) Forecast, by Application 2019 & 2032
- Table 38: Chile Insurance Analytics Market Revenue (Million) Forecast, by Application 2019 & 2032
- Table 39: Colombia Insurance Analytics Market Revenue (Million) Forecast, by Application 2019 & 2032
- Table 40: Ecuador Insurance Analytics Market Revenue (Million) Forecast, by Application 2019 & 2032
- Table 41: Venezuela Insurance Analytics Market Revenue (Million) Forecast, by Application 2019 & 2032
- Table 42: Rest of South America Insurance Analytics Market Revenue (Million) Forecast, by Application 2019 & 2032
- Table 43: Global Insurance Analytics Market Revenue Million Forecast, by Country 2019 & 2032
- Table 44: United States Insurance Analytics Market Revenue (Million) Forecast, by Application 2019 & 2032
- Table 45: Canada Insurance Analytics Market Revenue (Million) Forecast, by Application 2019 & 2032
- Table 46: Mexico Insurance Analytics Market Revenue (Million) Forecast, by Application 2019 & 2032
- Table 47: Global Insurance Analytics Market Revenue Million Forecast, by Country 2019 & 2032
- Table 48: United Arab Emirates Insurance Analytics Market Revenue (Million) Forecast, by Application 2019 & 2032
- Table 49: Saudi Arabia Insurance Analytics Market Revenue (Million) Forecast, by Application 2019 & 2032
- Table 50: South Africa Insurance Analytics Market Revenue (Million) Forecast, by Application 2019 & 2032
- Table 51: Rest of Middle East and Africa Insurance Analytics Market Revenue (Million) Forecast, by Application 2019 & 2032
- Table 52: Global Insurance Analytics Market Revenue Million Forecast, by Component 2019 & 2032
- Table 53: Global Insurance Analytics Market Revenue Million Forecast, by Business Application (Qualitative Analysis) 2019 & 2032
- Table 54: Global Insurance Analytics Market Revenue Million Forecast, by Deployment Mode 2019 & 2032
- Table 55: Global Insurance Analytics Market Revenue Million Forecast, by End-User 2019 & 2032
- Table 56: Global Insurance Analytics Market Revenue Million Forecast, by Country 2019 & 2032
- Table 57: Global Insurance Analytics Market Revenue Million Forecast, by Component 2019 & 2032
- Table 58: Global Insurance Analytics Market Revenue Million Forecast, by Business Application (Qualitative Analysis) 2019 & 2032
- Table 59: Global Insurance Analytics Market Revenue Million Forecast, by Deployment Mode 2019 & 2032
- Table 60: Global Insurance Analytics Market Revenue Million Forecast, by End-User 2019 & 2032
- Table 61: Global Insurance Analytics Market Revenue Million Forecast, by Country 2019 & 2032
- Table 62: Global Insurance Analytics Market Revenue Million Forecast, by Component 2019 & 2032
- Table 63: Global Insurance Analytics Market Revenue Million Forecast, by Business Application (Qualitative Analysis) 2019 & 2032
- Table 64: Global Insurance Analytics Market Revenue Million Forecast, by Deployment Mode 2019 & 2032
- Table 65: Global Insurance Analytics Market Revenue Million Forecast, by End-User 2019 & 2032
- Table 66: Global Insurance Analytics Market Revenue Million Forecast, by Country 2019 & 2032
- Table 67: Global Insurance Analytics Market Revenue Million Forecast, by Component 2019 & 2032
- Table 68: Global Insurance Analytics Market Revenue Million Forecast, by Business Application (Qualitative Analysis) 2019 & 2032
- Table 69: Global Insurance Analytics Market Revenue Million Forecast, by Deployment Mode 2019 & 2032
- Table 70: Global Insurance Analytics Market Revenue Million Forecast, by End-User 2019 & 2032
- Table 71: Global Insurance Analytics Market Revenue Million Forecast, by Country 2019 & 2032
Frequently Asked Questions
1. What is the projected Compound Annual Growth Rate (CAGR) of the Insurance Analytics Market?
The projected CAGR is approximately 15.90%.
2. Which companies are prominent players in the Insurance Analytics Market?
Key companies in the market include Sapiens International Corporation*List Not Exhaustive, Hexaware Technologies Limited, OpenText Corporation, IBM Corporation, Applied Systems Inc, MicroStrategy Incorporated, Guidewire Software Inc, Microsoft Corporation, Oracle Corporation, LexisNexis Risk Solutions.
3. What are the main segments of the Insurance Analytics Market?
The market segments include Component, Business Application (Qualitative Analysis), Deployment Mode, End-User.
4. Can you provide details about the market size?
The market size is estimated to be USD 11.47 Million as of 2022.
5. What are some drivers contributing to market growth?
Increased Adoption of Advanced Technologies; Rise in Competition among the Insurance Sector.
6. What are the notable trends driving market growth?
Increasing Risks And Fraudulent Activities Are Boosting the Adoption Of Insurance Analytics..
7. Are there any restraints impacting market growth?
Stringent Government Regulations; Privacy and Security Concern.
8. Can you provide examples of recent developments in the market?
April 2023 - Guidewire launched the Garmisch solution to provide developers with more self-service tools on the Guidewire Cloud Console. Insurance companies can easily create and implement seamless, digital claims experiences using this solution. With ready-to-use bulk data connectors from top global data platforms, Garmisch reduces the time it takes for an organization to gain insight.
9. What pricing options are available for accessing the report?
Pricing options include single-user, multi-user, and enterprise licenses priced at USD 4750, USD 5250, and USD 8750 respectively.
10. Is the market size provided in terms of value or volume?
The market size is provided in terms of value, measured in Million.
11. Are there any specific market keywords associated with the report?
Yes, the market keyword associated with the report is "Insurance Analytics Market," which aids in identifying and referencing the specific market segment covered.
12. How do I determine which pricing option suits my needs best?
The pricing options vary based on user requirements and access needs. Individual users may opt for single-user licenses, while businesses requiring broader access may choose multi-user or enterprise licenses for cost-effective access to the report.
13. Are there any additional resources or data provided in the Insurance Analytics Market report?
While the report offers comprehensive insights, it's advisable to review the specific contents or supplementary materials provided to ascertain if additional resources or data are available.
14. How can I stay updated on further developments or reports in the Insurance Analytics Market?
To stay informed about further developments, trends, and reports in the Insurance Analytics Market, consider subscribing to industry newsletters, following relevant companies and organizations, or regularly checking reputable industry news sources and publications.
Methodology
Step 1 - Identification of Relevant Samples Size from Population Database


Step 2 - Approaches for Defining Global Market Size (Value, Volume* & Price*)

Note*: In applicable scenarios
Step 3 - Data Sources
Primary Research
- Web Analytics
- Survey Reports
- Research Institute
- Latest Research Reports
- Opinion Leaders
Secondary Research
- Annual Reports
- White Paper
- Latest Press Release
- Industry Association
- Paid Database
- Investor Presentations

Step 4 - Data Triangulation
Involves using different sources of information in order to increase the validity of a study
These sources are likely to be stakeholders in a program - participants, other researchers, program staff, other community members, and so on.
Then we put all data in single framework & apply various statistical tools to find out the dynamic on the market.
During the analysis stage, feedback from the stakeholder groups would be compared to determine areas of agreement as well as areas of divergence
