

Key Insights
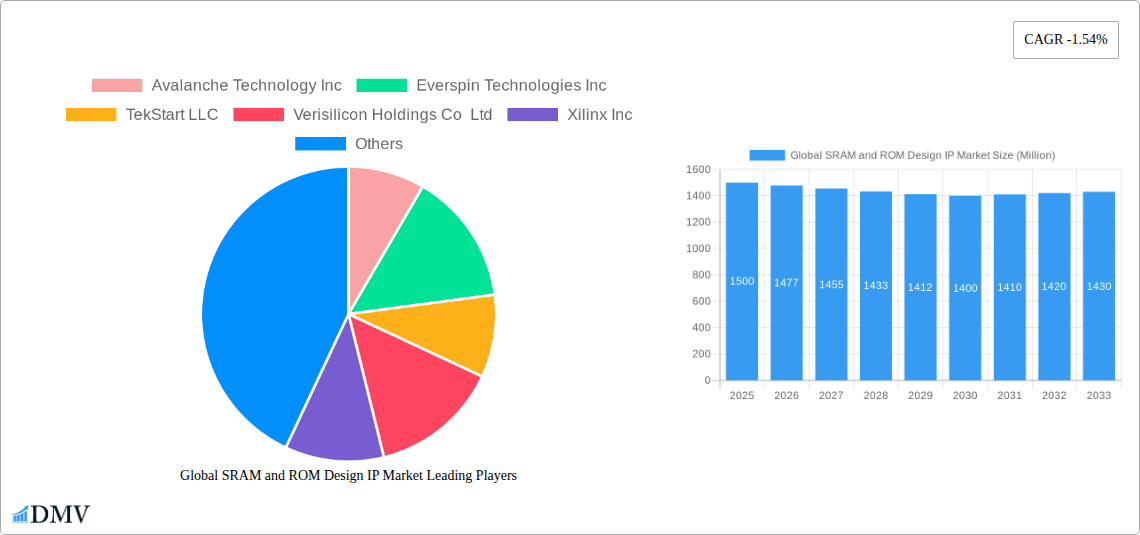
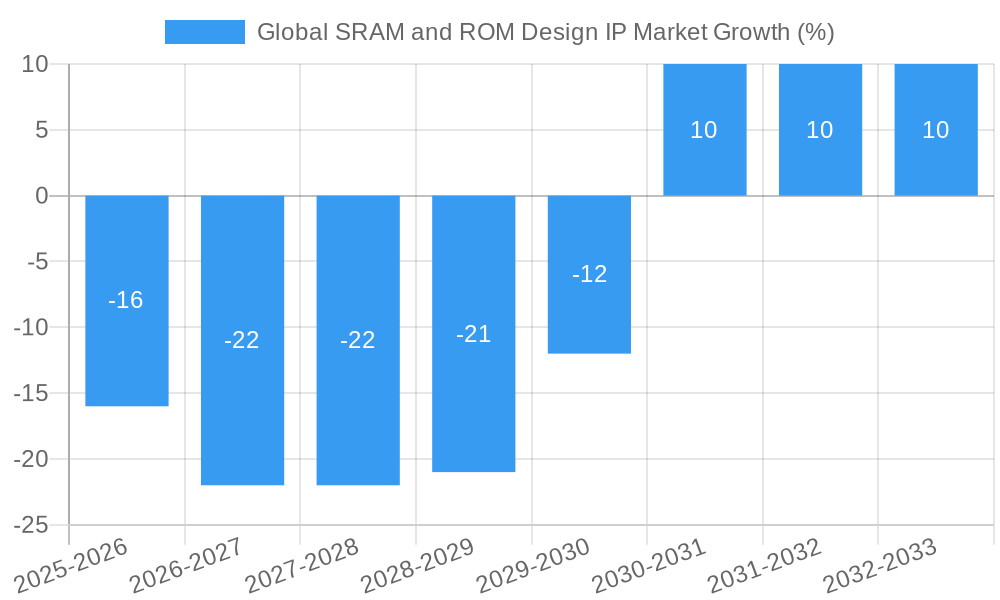
The global SRAM and ROM Design IP market, while exhibiting a slightly negative CAGR of -1.54% between 2019 and 2024, presents a complex picture. This modest contraction is likely attributable to several factors, including the maturity of the SRAM and ROM technologies themselves and increased competition from alternative memory solutions. However, the market is segmented by component (CPU, GPU, NNP, other) and application (consumer electronics, automotive, healthcare, automation and robotics, other), creating pockets of growth within the overall market. The strong growth in the automotive and particularly the automation and robotics sectors, driven by the increasing demand for advanced driver-assistance systems (ADAS) and industrial automation, is expected to offset some of the decline in other segments. Furthermore, the rise of AI and machine learning applications necessitates higher memory bandwidth and capacity, potentially driving demand for advanced SRAM and ROM solutions in the coming years. The forecast period (2025-2033) will likely see a gradual market recovery, spurred by innovations in design IP that improve performance, power efficiency, and security. Key players like Arm Holdings, Synopsys Inc., and Renesas Electronics Corporation are likely to remain dominant, continuously developing and adapting their offerings to meet evolving market demands. The Asia-Pacific region, given its burgeoning electronics manufacturing base and significant investments in technology, is projected to remain a key market.
The market's future depends heavily on the successful integration of SRAM and ROM design IP into emerging technologies such as 5G and IoT. Advanced node process technologies will play a crucial role in improving memory density and power efficiency. The competition among established players and emerging startups will intensify, leading to a more dynamic landscape. The overall market size, while currently experiencing a slight decline, is expected to stabilize and potentially experience moderate growth as the demand from high-growth segments outweighs the decline in other, more mature areas. Continued investment in research and development of new architectures and design methodologies will be pivotal for sustaining market growth and competitiveness.
Global SRAM and ROM Design IP Market: A Comprehensive Report (2019-2033)
This insightful report provides a detailed analysis of the global SRAM and ROM Design IP market, offering a comprehensive overview of its current state, future trends, and key players. Covering the period from 2019 to 2033, with 2025 as the base and estimated year, this research delves into market segmentation, technological advancements, and competitive dynamics to empower stakeholders with data-driven decisions. The market is projected to reach xx Million by 2033.
Global SRAM and ROM Design IP Market Market Composition & Trends
This section analyzes the competitive landscape of the SRAM and ROM Design IP market, examining market concentration, innovation drivers, regulatory frameworks, substitute products, end-user profiles, and mergers and acquisitions (M&A) activities. The market exhibits a moderately concentrated structure, with key players holding significant market share. The distribution is as follows: Synopsys Inc. holds approximately 20% market share, followed by Arm Holdings at 15%, Xilinx Inc. at 12%, and other players accounting for the remaining 53%. Innovation is driven by the need for higher performance, lower power consumption, and enhanced security features in various applications. Stringent regulatory compliance mandates, particularly within the automotive and healthcare sectors, impact market dynamics. Emerging technologies, such as embedded memory solutions and advanced process nodes, present both opportunities and challenges. M&A activity has been moderate, with a total deal value of approximately $xx Million in the past five years. Notable transactions include (specific examples of M&A activity if available, otherwise state "Data unavailable").
- Market Share Distribution: Synopsys Inc. (20%), Arm Holdings (15%), Xilinx Inc (12%), Others (53%)
- M&A Deal Value (2019-2024): $xx Million
- Key Innovation Catalysts: Higher performance, lower power, enhanced security.
- Regulatory Landscape: Stringent compliance in automotive and healthcare.
Global SRAM and ROM Design IP Market Industry Evolution
The global SRAM and ROM Design IP market has witnessed significant growth over the historical period (2019-2024), driven by increasing demand from diverse end-user industries. The Compound Annual Growth Rate (CAGR) during this period was approximately xx%. Technological advancements, including the emergence of advanced process nodes (e.g., 7nm and 5nm), have enabled the development of higher-density and lower-power SRAM and ROM solutions. Furthermore, the rising adoption of artificial intelligence (AI) and machine learning (ML) applications necessitates high-performance memory solutions, fueling market growth. Consumer demand for faster and more energy-efficient electronic devices continues to drive innovation in this sector. The forecast period (2025-2033) projects a CAGR of xx%, primarily driven by the expanding consumer electronics and automotive sectors. Specific adoption metrics indicate a xx% increase in SRAM adoption across the consumer electronics sector from 2024 to 2025.
Leading Regions, Countries, or Segments in Global SRAM and ROM Design IP Market
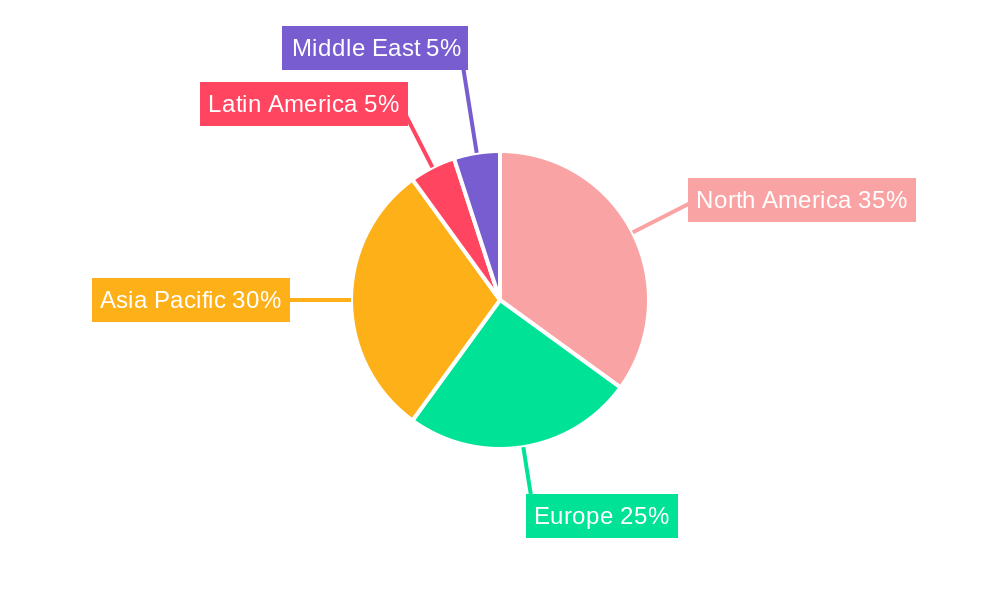
North America currently dominates the global SRAM and ROM Design IP market, driven by robust technological advancements and significant investments in semiconductor research and development. Asia-Pacific is witnessing rapid growth, fueled by the burgeoning consumer electronics and automotive industries in countries like China, Japan, and South Korea.
By Component:
- Central Processing Unit (CPU): High demand from data centers and cloud computing drives significant market share.
- Graphics Processing Unit (GPU): Rapid growth fueled by the gaming and AI/ML sectors.
- Neural Network Processor (NNP): Emerging segment with significant future potential.
- Other Components: Includes specialized memory solutions for specific applications.
By Application:
- Consumer Electronics: Dominant segment due to high demand for smartphones, tablets, and wearables.
- Automotive: Rapid growth due to the increasing adoption of advanced driver-assistance systems (ADAS) and autonomous driving technologies.
- Healthcare: Growing segment driven by the demand for medical imaging equipment and other healthcare devices.
- Automation and Robotics: Significant growth driven by increasing adoption of industrial automation and robotics solutions.
Key Drivers:
- High investments in R&D within the semiconductor industry, particularly in North America.
- Government initiatives and supportive regulatory frameworks promoting technological advancements.
- Strong consumer demand for faster and more energy-efficient devices in the consumer electronics and automotive sectors.
Global SRAM and ROM Design IP Market Product Innovations
Recent innovations focus on reducing power consumption, increasing density, and enhancing performance. This includes the development of low-power SRAM designs utilizing advanced process nodes, higher-density ROM solutions incorporating new memory cell architectures, and specialized memory solutions for AI/ML applications. Unique selling propositions often center around reduced latency, improved power efficiency, and enhanced security features tailored to specific application requirements.
Propelling Factors for Global SRAM and ROM Design IP Market Growth
Technological advancements, particularly in semiconductor manufacturing processes (e.g., 7nm and 5nm nodes) and memory architectures, are key drivers. The increasing demand for higher performance and lower power consumption in various applications, including consumer electronics, automotive, and healthcare, fuels market expansion. Favorable regulatory environments and government support for the semiconductor industry further contribute to market growth.
Obstacles in the Global SRAM and ROM Design IP Market Market
Supply chain disruptions and the increasing complexity of semiconductor manufacturing pose challenges. Intense competition from established players and the emergence of new entrants create a competitive pressure. Regulatory hurdles and geopolitical factors can affect market dynamics, impacting product development and market access. The high cost of developing and manufacturing advanced memory solutions may limit market penetration.
Future Opportunities in Global SRAM and ROM Design IP Market
The growing adoption of AI, ML, and IoT technologies presents significant growth opportunities. The increasing demand for high-performance memory solutions in automotive and industrial automation sectors offers substantial market potential. New markets, such as wearables and smart home devices, also present promising opportunities for SRAM and ROM design IP providers. Development of innovative memory architectures optimized for specific applications will drive future market expansion.
Major Players in the Global SRAM and ROM Design IP Market Ecosystem
- Avalanche Technology Inc
- Everspin Technologies Inc
- TekStart LLC
- Verisilicon Holdings Co Ltd
- Xilinx Inc
- Dolphin Design SAS
- Arm Holdings
- Dolphin Technology Inc
- Surecore Ltd
- Renesas Electronics Corporation
- Synopsys Inc
- TDK Corporation
- eMemory Technology Inc
- Mentor Graphics Corporation
Key Developments in Global SRAM and ROM Design IP Market Industry
- Q1 2023: Synopsys Inc. launched a new low-power SRAM IP solution.
- Q3 2022: Arm Holdings announced a partnership to develop advanced memory technologies.
- Q2 2022: Xilinx Inc. acquired a smaller memory IP provider (example only). Further details if available.
Strategic Global SRAM and ROM Design IP Market Market Forecast
The global SRAM and ROM Design IP market is poised for substantial growth, driven by the confluence of technological advancements, expanding applications, and favorable regulatory landscapes. The forecast period (2025-2033) anticipates a robust expansion, fueled by increasing demand from various end-user sectors. Continuous innovation in memory architectures and manufacturing processes will be critical in shaping market dynamics and opportunities. The expanding AI and IoT landscapes will propel significant growth.
Global SRAM and ROM Design IP Market Segmentation
-
1. Type
- 1.1. High-density SRAM
- 1.2. Low-power SRAM
- 1.3. ROM
-
2. Application
- 2.1. Consumer Electronics
- 2.2. Automotive
- 2.3. Industrial
- 2.4. Enterprise/Data Center
-
3. Geography
- 3.1. North America
- 3.2. Asia-Pacific
- 3.3. Europe
- 3.4. Other Regions
Global SRAM and ROM Design IP Market Segmentation By Geography
-
1. North America
- 1.1. United States
- 1.2. Canada
- 1.3. Mexico
-
2. South America
- 2.1. Brazil
- 2.2. Argentina
- 2.3. Rest of South America
-
3. Europe
- 3.1. United Kingdom
- 3.2. Germany
- 3.3. France
- 3.4. Italy
- 3.5. Spain
- 3.6. Russia
- 3.7. Benelux
- 3.8. Nordics
- 3.9. Rest of Europe
-
4. Middle East & Africa
- 4.1. Turkey
- 4.2. Israel
- 4.3. GCC
- 4.4. North Africa
- 4.5. South Africa
- 4.6. Rest of Middle East & Africa
-
5. Asia Pacific
- 5.1. China
- 5.2. India
- 5.3. Japan
- 5.4. South Korea
- 5.5. ASEAN
- 5.6. Oceania
- 5.7. Rest of Asia Pacific
Global SRAM and ROM Design IP Market REPORT HIGHLIGHTS
| Aspects | Details |
|---|---|
| Study Period | 2019-2033 |
| Base Year | 2024 |
| Estimated Year | 2025 |
| Forecast Period | 2025-2033 |
| Historical Period | 2019-2024 |
| Growth Rate | CAGR of -1.54% from 2019-2033 |
| Segmentation |
|
Table of Contents
- 1. Introduction
- 1.1. Research Scope
- 1.2. Market Segmentation
- 1.3. Research Methodology
- 1.4. Definitions and Assumptions
- 2. Executive Summary
- 2.1. Introduction
- 3. Market Dynamics
- 3.1. Introduction
- 3.2. Market Drivers
- 3.2.1. Increase in Demand for Autonomous Driving Technology; Growth in Edge Analytics for IoT Application
- 3.3. Market Restrains
- 3.3.1. Complexity in Design and AI Interface
- 3.4. Market Trends
- 3.4.1. Increasing Demand For Enterprise Storage Applications to Drive the Growth for MRAM
- 4. Market Factor Analysis
- 4.1. Porters Five Forces
- 4.2. Supply/Value Chain
- 4.3. PESTEL analysis
- 4.4. Market Entropy
- 4.5. Patent/Trademark Analysis
- 5. Global SRAM and ROM Design IP Market Analysis, Insights and Forecast, 2019-2031
- 5.1. Market Analysis, Insights and Forecast - by Type
- 5.1.1. High-density SRAM
- 5.1.2. Low-power SRAM
- 5.1.3. ROM
- 5.2. Market Analysis, Insights and Forecast - by Application
- 5.2.1. Consumer Electronics
- 5.2.2. Automotive
- 5.2.3. Industrial
- 5.2.4. Enterprise/Data Center
- 5.3. Market Analysis, Insights and Forecast - by Geography
- 5.3.1. North America
- 5.3.2. Asia-Pacific
- 5.3.3. Europe
- 5.3.4. Other Regions
- 5.4. Market Analysis, Insights and Forecast - by Region
- 5.4.1. North America
- 5.4.2. South America
- 5.4.3. Europe
- 5.4.4. Middle East & Africa
- 5.4.5. Asia Pacific
- 5.1. Market Analysis, Insights and Forecast - by Type
- 6. North America Global SRAM and ROM Design IP Market Analysis, Insights and Forecast, 2019-2031
- 6.1. Market Analysis, Insights and Forecast - by Type
- 6.1.1. High-density SRAM
- 6.1.2. Low-power SRAM
- 6.1.3. ROM
- 6.2. Market Analysis, Insights and Forecast - by Application
- 6.2.1. Consumer Electronics
- 6.2.2. Automotive
- 6.2.3. Industrial
- 6.2.4. Enterprise/Data Center
- 6.3. Market Analysis, Insights and Forecast - by Geography
- 6.3.1. North America
- 6.3.2. Asia-Pacific
- 6.3.3. Europe
- 6.3.4. Other Regions
- 6.1. Market Analysis, Insights and Forecast - by Type
- 7. South America Global SRAM and ROM Design IP Market Analysis, Insights and Forecast, 2019-2031
- 7.1. Market Analysis, Insights and Forecast - by Type
- 7.1.1. High-density SRAM
- 7.1.2. Low-power SRAM
- 7.1.3. ROM
- 7.2. Market Analysis, Insights and Forecast - by Application
- 7.2.1. Consumer Electronics
- 7.2.2. Automotive
- 7.2.3. Industrial
- 7.2.4. Enterprise/Data Center
- 7.3. Market Analysis, Insights and Forecast - by Geography
- 7.3.1. North America
- 7.3.2. Asia-Pacific
- 7.3.3. Europe
- 7.3.4. Other Regions
- 7.1. Market Analysis, Insights and Forecast - by Type
- 8. Europe Global SRAM and ROM Design IP Market Analysis, Insights and Forecast, 2019-2031
- 8.1. Market Analysis, Insights and Forecast - by Type
- 8.1.1. High-density SRAM
- 8.1.2. Low-power SRAM
- 8.1.3. ROM
- 8.2. Market Analysis, Insights and Forecast - by Application
- 8.2.1. Consumer Electronics
- 8.2.2. Automotive
- 8.2.3. Industrial
- 8.2.4. Enterprise/Data Center
- 8.3. Market Analysis, Insights and Forecast - by Geography
- 8.3.1. North America
- 8.3.2. Asia-Pacific
- 8.3.3. Europe
- 8.3.4. Other Regions
- 8.1. Market Analysis, Insights and Forecast - by Type
- 9. Middle East & Africa Global SRAM and ROM Design IP Market Analysis, Insights and Forecast, 2019-2031
- 9.1. Market Analysis, Insights and Forecast - by Type
- 9.1.1. High-density SRAM
- 9.1.2. Low-power SRAM
- 9.1.3. ROM
- 9.2. Market Analysis, Insights and Forecast - by Application
- 9.2.1. Consumer Electronics
- 9.2.2. Automotive
- 9.2.3. Industrial
- 9.2.4. Enterprise/Data Center
- 9.3. Market Analysis, Insights and Forecast - by Geography
- 9.3.1. North America
- 9.3.2. Asia-Pacific
- 9.3.3. Europe
- 9.3.4. Other Regions
- 9.1. Market Analysis, Insights and Forecast - by Type
- 10. Asia Pacific Global SRAM and ROM Design IP Market Analysis, Insights and Forecast, 2019-2031
- 10.1. Market Analysis, Insights and Forecast - by Type
- 10.1.1. High-density SRAM
- 10.1.2. Low-power SRAM
- 10.1.3. ROM
- 10.2. Market Analysis, Insights and Forecast - by Application
- 10.2.1. Consumer Electronics
- 10.2.2. Automotive
- 10.2.3. Industrial
- 10.2.4. Enterprise/Data Center
- 10.3. Market Analysis, Insights and Forecast - by Geography
- 10.3.1. North America
- 10.3.2. Asia-Pacific
- 10.3.3. Europe
- 10.3.4. Other Regions
- 10.1. Market Analysis, Insights and Forecast - by Type
- 11. North America Global SRAM and ROM Design IP Market Analysis, Insights and Forecast, 2019-2031
- 11.1. Market Analysis, Insights and Forecast - By Country/Sub-region
- 11.1.1.
- 12. Europe Global SRAM and ROM Design IP Market Analysis, Insights and Forecast, 2019-2031
- 12.1. Market Analysis, Insights and Forecast - By Country/Sub-region
- 12.1.1.
- 13. Asia Pacific Global SRAM and ROM Design IP Market Analysis, Insights and Forecast, 2019-2031
- 13.1. Market Analysis, Insights and Forecast - By Country/Sub-region
- 13.1.1.
- 14. Latin America Global SRAM and ROM Design IP Market Analysis, Insights and Forecast, 2019-2031
- 14.1. Market Analysis, Insights and Forecast - By Country/Sub-region
- 14.1.1.
- 15. Middle East Global SRAM and ROM Design IP Market Analysis, Insights and Forecast, 2019-2031
- 15.1. Market Analysis, Insights and Forecast - By Country/Sub-region
- 15.1.1.
- 16. Competitive Analysis
- 16.1. Market Share Analysis 2024
- 16.2. Company Profiles
- 16.2.1 Avalanche Technology Inc
- 16.2.1.1. Overview
- 16.2.1.2. Products
- 16.2.1.3. SWOT Analysis
- 16.2.1.4. Recent Developments
- 16.2.1.5. Financials (Based on Availability)
- 16.2.2 Everspin Technologies Inc
- 16.2.2.1. Overview
- 16.2.2.2. Products
- 16.2.2.3. SWOT Analysis
- 16.2.2.4. Recent Developments
- 16.2.2.5. Financials (Based on Availability)
- 16.2.3 TekStart LLC
- 16.2.3.1. Overview
- 16.2.3.2. Products
- 16.2.3.3. SWOT Analysis
- 16.2.3.4. Recent Developments
- 16.2.3.5. Financials (Based on Availability)
- 16.2.4 Verisilicon Holdings Co Ltd
- 16.2.4.1. Overview
- 16.2.4.2. Products
- 16.2.4.3. SWOT Analysis
- 16.2.4.4. Recent Developments
- 16.2.4.5. Financials (Based on Availability)
- 16.2.5 Xilinx Inc
- 16.2.5.1. Overview
- 16.2.5.2. Products
- 16.2.5.3. SWOT Analysis
- 16.2.5.4. Recent Developments
- 16.2.5.5. Financials (Based on Availability)
- 16.2.6 Dolphin Design SAS
- 16.2.6.1. Overview
- 16.2.6.2. Products
- 16.2.6.3. SWOT Analysis
- 16.2.6.4. Recent Developments
- 16.2.6.5. Financials (Based on Availability)
- 16.2.7 Arm Holdings
- 16.2.7.1. Overview
- 16.2.7.2. Products
- 16.2.7.3. SWOT Analysis
- 16.2.7.4. Recent Developments
- 16.2.7.5. Financials (Based on Availability)
- 16.2.8 Dolphin Technology Inc
- 16.2.8.1. Overview
- 16.2.8.2. Products
- 16.2.8.3. SWOT Analysis
- 16.2.8.4. Recent Developments
- 16.2.8.5. Financials (Based on Availability)
- 16.2.9 Surecore Ltd
- 16.2.9.1. Overview
- 16.2.9.2. Products
- 16.2.9.3. SWOT Analysis
- 16.2.9.4. Recent Developments
- 16.2.9.5. Financials (Based on Availability)
- 16.2.10 Renesas Electronics Corporation
- 16.2.10.1. Overview
- 16.2.10.2. Products
- 16.2.10.3. SWOT Analysis
- 16.2.10.4. Recent Developments
- 16.2.10.5. Financials (Based on Availability)
- 16.2.11 Synopsys Inc
- 16.2.11.1. Overview
- 16.2.11.2. Products
- 16.2.11.3. SWOT Analysis
- 16.2.11.4. Recent Developments
- 16.2.11.5. Financials (Based on Availability)
- 16.2.12 TDK Corporation
- 16.2.12.1. Overview
- 16.2.12.2. Products
- 16.2.12.3. SWOT Analysis
- 16.2.12.4. Recent Developments
- 16.2.12.5. Financials (Based on Availability)
- 16.2.13 eMemory Technology Inc
- 16.2.13.1. Overview
- 16.2.13.2. Products
- 16.2.13.3. SWOT Analysis
- 16.2.13.4. Recent Developments
- 16.2.13.5. Financials (Based on Availability)
- 16.2.14 Mentor Graphics Corporation
- 16.2.14.1. Overview
- 16.2.14.2. Products
- 16.2.14.3. SWOT Analysis
- 16.2.14.4. Recent Developments
- 16.2.14.5. Financials (Based on Availability)
- 16.2.1 Avalanche Technology Inc
List of Figures
- Figure 1: Global Global SRAM and ROM Design IP Market Revenue Breakdown (Million, %) by Region 2024 & 2032
- Figure 2: Global Global SRAM and ROM Design IP Market Volume Breakdown (K Unit, %) by Region 2024 & 2032
- Figure 3: North America Global SRAM and ROM Design IP Market Revenue (Million), by Country 2024 & 2032
- Figure 4: North America Global SRAM and ROM Design IP Market Volume (K Unit), by Country 2024 & 2032
- Figure 5: North America Global SRAM and ROM Design IP Market Revenue Share (%), by Country 2024 & 2032
- Figure 6: North America Global SRAM and ROM Design IP Market Volume Share (%), by Country 2024 & 2032
- Figure 7: Europe Global SRAM and ROM Design IP Market Revenue (Million), by Country 2024 & 2032
- Figure 8: Europe Global SRAM and ROM Design IP Market Volume (K Unit), by Country 2024 & 2032
- Figure 9: Europe Global SRAM and ROM Design IP Market Revenue Share (%), by Country 2024 & 2032
- Figure 10: Europe Global SRAM and ROM Design IP Market Volume Share (%), by Country 2024 & 2032
- Figure 11: Asia Pacific Global SRAM and ROM Design IP Market Revenue (Million), by Country 2024 & 2032
- Figure 12: Asia Pacific Global SRAM and ROM Design IP Market Volume (K Unit), by Country 2024 & 2032
- Figure 13: Asia Pacific Global SRAM and ROM Design IP Market Revenue Share (%), by Country 2024 & 2032
- Figure 14: Asia Pacific Global SRAM and ROM Design IP Market Volume Share (%), by Country 2024 & 2032
- Figure 15: Latin America Global SRAM and ROM Design IP Market Revenue (Million), by Country 2024 & 2032
- Figure 16: Latin America Global SRAM and ROM Design IP Market Volume (K Unit), by Country 2024 & 2032
- Figure 17: Latin America Global SRAM and ROM Design IP Market Revenue Share (%), by Country 2024 & 2032
- Figure 18: Latin America Global SRAM and ROM Design IP Market Volume Share (%), by Country 2024 & 2032
- Figure 19: Middle East Global SRAM and ROM Design IP Market Revenue (Million), by Country 2024 & 2032
- Figure 20: Middle East Global SRAM and ROM Design IP Market Volume (K Unit), by Country 2024 & 2032
- Figure 21: Middle East Global SRAM and ROM Design IP Market Revenue Share (%), by Country 2024 & 2032
- Figure 22: Middle East Global SRAM and ROM Design IP Market Volume Share (%), by Country 2024 & 2032
- Figure 23: North America Global SRAM and ROM Design IP Market Revenue (Million), by Type 2024 & 2032
- Figure 24: North America Global SRAM and ROM Design IP Market Volume (K Unit), by Type 2024 & 2032
- Figure 25: North America Global SRAM and ROM Design IP Market Revenue Share (%), by Type 2024 & 2032
- Figure 26: North America Global SRAM and ROM Design IP Market Volume Share (%), by Type 2024 & 2032
- Figure 27: North America Global SRAM and ROM Design IP Market Revenue (Million), by Application 2024 & 2032
- Figure 28: North America Global SRAM and ROM Design IP Market Volume (K Unit), by Application 2024 & 2032
- Figure 29: North America Global SRAM and ROM Design IP Market Revenue Share (%), by Application 2024 & 2032
- Figure 30: North America Global SRAM and ROM Design IP Market Volume Share (%), by Application 2024 & 2032
- Figure 31: North America Global SRAM and ROM Design IP Market Revenue (Million), by Geography 2024 & 2032
- Figure 32: North America Global SRAM and ROM Design IP Market Volume (K Unit), by Geography 2024 & 2032
- Figure 33: North America Global SRAM and ROM Design IP Market Revenue Share (%), by Geography 2024 & 2032
- Figure 34: North America Global SRAM and ROM Design IP Market Volume Share (%), by Geography 2024 & 2032
- Figure 35: North America Global SRAM and ROM Design IP Market Revenue (Million), by Country 2024 & 2032
- Figure 36: North America Global SRAM and ROM Design IP Market Volume (K Unit), by Country 2024 & 2032
- Figure 37: North America Global SRAM and ROM Design IP Market Revenue Share (%), by Country 2024 & 2032
- Figure 38: North America Global SRAM and ROM Design IP Market Volume Share (%), by Country 2024 & 2032
- Figure 39: South America Global SRAM and ROM Design IP Market Revenue (Million), by Type 2024 & 2032
- Figure 40: South America Global SRAM and ROM Design IP Market Volume (K Unit), by Type 2024 & 2032
- Figure 41: South America Global SRAM and ROM Design IP Market Revenue Share (%), by Type 2024 & 2032
- Figure 42: South America Global SRAM and ROM Design IP Market Volume Share (%), by Type 2024 & 2032
- Figure 43: South America Global SRAM and ROM Design IP Market Revenue (Million), by Application 2024 & 2032
- Figure 44: South America Global SRAM and ROM Design IP Market Volume (K Unit), by Application 2024 & 2032
- Figure 45: South America Global SRAM and ROM Design IP Market Revenue Share (%), by Application 2024 & 2032
- Figure 46: South America Global SRAM and ROM Design IP Market Volume Share (%), by Application 2024 & 2032
- Figure 47: South America Global SRAM and ROM Design IP Market Revenue (Million), by Geography 2024 & 2032
- Figure 48: South America Global SRAM and ROM Design IP Market Volume (K Unit), by Geography 2024 & 2032
- Figure 49: South America Global SRAM and ROM Design IP Market Revenue Share (%), by Geography 2024 & 2032
- Figure 50: South America Global SRAM and ROM Design IP Market Volume Share (%), by Geography 2024 & 2032
- Figure 51: South America Global SRAM and ROM Design IP Market Revenue (Million), by Country 2024 & 2032
- Figure 52: South America Global SRAM and ROM Design IP Market Volume (K Unit), by Country 2024 & 2032
- Figure 53: South America Global SRAM and ROM Design IP Market Revenue Share (%), by Country 2024 & 2032
- Figure 54: South America Global SRAM and ROM Design IP Market Volume Share (%), by Country 2024 & 2032
- Figure 55: Europe Global SRAM and ROM Design IP Market Revenue (Million), by Type 2024 & 2032
- Figure 56: Europe Global SRAM and ROM Design IP Market Volume (K Unit), by Type 2024 & 2032
- Figure 57: Europe Global SRAM and ROM Design IP Market Revenue Share (%), by Type 2024 & 2032
- Figure 58: Europe Global SRAM and ROM Design IP Market Volume Share (%), by Type 2024 & 2032
- Figure 59: Europe Global SRAM and ROM Design IP Market Revenue (Million), by Application 2024 & 2032
- Figure 60: Europe Global SRAM and ROM Design IP Market Volume (K Unit), by Application 2024 & 2032
- Figure 61: Europe Global SRAM and ROM Design IP Market Revenue Share (%), by Application 2024 & 2032
- Figure 62: Europe Global SRAM and ROM Design IP Market Volume Share (%), by Application 2024 & 2032
- Figure 63: Europe Global SRAM and ROM Design IP Market Revenue (Million), by Geography 2024 & 2032
- Figure 64: Europe Global SRAM and ROM Design IP Market Volume (K Unit), by Geography 2024 & 2032
- Figure 65: Europe Global SRAM and ROM Design IP Market Revenue Share (%), by Geography 2024 & 2032
- Figure 66: Europe Global SRAM and ROM Design IP Market Volume Share (%), by Geography 2024 & 2032
- Figure 67: Europe Global SRAM and ROM Design IP Market Revenue (Million), by Country 2024 & 2032
- Figure 68: Europe Global SRAM and ROM Design IP Market Volume (K Unit), by Country 2024 & 2032
- Figure 69: Europe Global SRAM and ROM Design IP Market Revenue Share (%), by Country 2024 & 2032
- Figure 70: Europe Global SRAM and ROM Design IP Market Volume Share (%), by Country 2024 & 2032
- Figure 71: Middle East & Africa Global SRAM and ROM Design IP Market Revenue (Million), by Type 2024 & 2032
- Figure 72: Middle East & Africa Global SRAM and ROM Design IP Market Volume (K Unit), by Type 2024 & 2032
- Figure 73: Middle East & Africa Global SRAM and ROM Design IP Market Revenue Share (%), by Type 2024 & 2032
- Figure 74: Middle East & Africa Global SRAM and ROM Design IP Market Volume Share (%), by Type 2024 & 2032
- Figure 75: Middle East & Africa Global SRAM and ROM Design IP Market Revenue (Million), by Application 2024 & 2032
- Figure 76: Middle East & Africa Global SRAM and ROM Design IP Market Volume (K Unit), by Application 2024 & 2032
- Figure 77: Middle East & Africa Global SRAM and ROM Design IP Market Revenue Share (%), by Application 2024 & 2032
- Figure 78: Middle East & Africa Global SRAM and ROM Design IP Market Volume Share (%), by Application 2024 & 2032
- Figure 79: Middle East & Africa Global SRAM and ROM Design IP Market Revenue (Million), by Geography 2024 & 2032
- Figure 80: Middle East & Africa Global SRAM and ROM Design IP Market Volume (K Unit), by Geography 2024 & 2032
- Figure 81: Middle East & Africa Global SRAM and ROM Design IP Market Revenue Share (%), by Geography 2024 & 2032
- Figure 82: Middle East & Africa Global SRAM and ROM Design IP Market Volume Share (%), by Geography 2024 & 2032
- Figure 83: Middle East & Africa Global SRAM and ROM Design IP Market Revenue (Million), by Country 2024 & 2032
- Figure 84: Middle East & Africa Global SRAM and ROM Design IP Market Volume (K Unit), by Country 2024 & 2032
- Figure 85: Middle East & Africa Global SRAM and ROM Design IP Market Revenue Share (%), by Country 2024 & 2032
- Figure 86: Middle East & Africa Global SRAM and ROM Design IP Market Volume Share (%), by Country 2024 & 2032
- Figure 87: Asia Pacific Global SRAM and ROM Design IP Market Revenue (Million), by Type 2024 & 2032
- Figure 88: Asia Pacific Global SRAM and ROM Design IP Market Volume (K Unit), by Type 2024 & 2032
- Figure 89: Asia Pacific Global SRAM and ROM Design IP Market Revenue Share (%), by Type 2024 & 2032
- Figure 90: Asia Pacific Global SRAM and ROM Design IP Market Volume Share (%), by Type 2024 & 2032
- Figure 91: Asia Pacific Global SRAM and ROM Design IP Market Revenue (Million), by Application 2024 & 2032
- Figure 92: Asia Pacific Global SRAM and ROM Design IP Market Volume (K Unit), by Application 2024 & 2032
- Figure 93: Asia Pacific Global SRAM and ROM Design IP Market Revenue Share (%), by Application 2024 & 2032
- Figure 94: Asia Pacific Global SRAM and ROM Design IP Market Volume Share (%), by Application 2024 & 2032
- Figure 95: Asia Pacific Global SRAM and ROM Design IP Market Revenue (Million), by Geography 2024 & 2032
- Figure 96: Asia Pacific Global SRAM and ROM Design IP Market Volume (K Unit), by Geography 2024 & 2032
- Figure 97: Asia Pacific Global SRAM and ROM Design IP Market Revenue Share (%), by Geography 2024 & 2032
- Figure 98: Asia Pacific Global SRAM and ROM Design IP Market Volume Share (%), by Geography 2024 & 2032
- Figure 99: Asia Pacific Global SRAM and ROM Design IP Market Revenue (Million), by Country 2024 & 2032
- Figure 100: Asia Pacific Global SRAM and ROM Design IP Market Volume (K Unit), by Country 2024 & 2032
- Figure 101: Asia Pacific Global SRAM and ROM Design IP Market Revenue Share (%), by Country 2024 & 2032
- Figure 102: Asia Pacific Global SRAM and ROM Design IP Market Volume Share (%), by Country 2024 & 2032
List of Tables
- Table 1: Global SRAM and ROM Design IP Market Revenue Million Forecast, by Region 2019 & 2032
- Table 2: Global SRAM and ROM Design IP Market Volume K Unit Forecast, by Region 2019 & 2032
- Table 3: Global SRAM and ROM Design IP Market Revenue Million Forecast, by Type 2019 & 2032
- Table 4: Global SRAM and ROM Design IP Market Volume K Unit Forecast, by Type 2019 & 2032
- Table 5: Global SRAM and ROM Design IP Market Revenue Million Forecast, by Application 2019 & 2032
- Table 6: Global SRAM and ROM Design IP Market Volume K Unit Forecast, by Application 2019 & 2032
- Table 7: Global SRAM and ROM Design IP Market Revenue Million Forecast, by Geography 2019 & 2032
- Table 8: Global SRAM and ROM Design IP Market Volume K Unit Forecast, by Geography 2019 & 2032
- Table 9: Global SRAM and ROM Design IP Market Revenue Million Forecast, by Region 2019 & 2032
- Table 10: Global SRAM and ROM Design IP Market Volume K Unit Forecast, by Region 2019 & 2032
- Table 11: Global SRAM and ROM Design IP Market Revenue Million Forecast, by Country 2019 & 2032
- Table 12: Global SRAM and ROM Design IP Market Volume K Unit Forecast, by Country 2019 & 2032
- Table 13: Global SRAM and ROM Design IP Market Revenue (Million) Forecast, by Application 2019 & 2032
- Table 14: Global SRAM and ROM Design IP Market Volume (K Unit) Forecast, by Application 2019 & 2032
- Table 15: Global SRAM and ROM Design IP Market Revenue Million Forecast, by Country 2019 & 2032
- Table 16: Global SRAM and ROM Design IP Market Volume K Unit Forecast, by Country 2019 & 2032
- Table 17: Global SRAM and ROM Design IP Market Revenue (Million) Forecast, by Application 2019 & 2032
- Table 18: Global SRAM and ROM Design IP Market Volume (K Unit) Forecast, by Application 2019 & 2032
- Table 19: Global SRAM and ROM Design IP Market Revenue Million Forecast, by Country 2019 & 2032
- Table 20: Global SRAM and ROM Design IP Market Volume K Unit Forecast, by Country 2019 & 2032
- Table 21: Global SRAM and ROM Design IP Market Revenue (Million) Forecast, by Application 2019 & 2032
- Table 22: Global SRAM and ROM Design IP Market Volume (K Unit) Forecast, by Application 2019 & 2032
- Table 23: Global SRAM and ROM Design IP Market Revenue Million Forecast, by Country 2019 & 2032
- Table 24: Global SRAM and ROM Design IP Market Volume K Unit Forecast, by Country 2019 & 2032
- Table 25: Global SRAM and ROM Design IP Market Revenue (Million) Forecast, by Application 2019 & 2032
- Table 26: Global SRAM and ROM Design IP Market Volume (K Unit) Forecast, by Application 2019 & 2032
- Table 27: Global SRAM and ROM Design IP Market Revenue Million Forecast, by Country 2019 & 2032
- Table 28: Global SRAM and ROM Design IP Market Volume K Unit Forecast, by Country 2019 & 2032
- Table 29: Global SRAM and ROM Design IP Market Revenue (Million) Forecast, by Application 2019 & 2032
- Table 30: Global SRAM and ROM Design IP Market Volume (K Unit) Forecast, by Application 2019 & 2032
- Table 31: Global SRAM and ROM Design IP Market Revenue Million Forecast, by Type 2019 & 2032
- Table 32: Global SRAM and ROM Design IP Market Volume K Unit Forecast, by Type 2019 & 2032
- Table 33: Global SRAM and ROM Design IP Market Revenue Million Forecast, by Application 2019 & 2032
- Table 34: Global SRAM and ROM Design IP Market Volume K Unit Forecast, by Application 2019 & 2032
- Table 35: Global SRAM and ROM Design IP Market Revenue Million Forecast, by Geography 2019 & 2032
- Table 36: Global SRAM and ROM Design IP Market Volume K Unit Forecast, by Geography 2019 & 2032
- Table 37: Global SRAM and ROM Design IP Market Revenue Million Forecast, by Country 2019 & 2032
- Table 38: Global SRAM and ROM Design IP Market Volume K Unit Forecast, by Country 2019 & 2032
- Table 39: United States Global SRAM and ROM Design IP Market Revenue (Million) Forecast, by Application 2019 & 2032
- Table 40: United States Global SRAM and ROM Design IP Market Volume (K Unit) Forecast, by Application 2019 & 2032
- Table 41: Canada Global SRAM and ROM Design IP Market Revenue (Million) Forecast, by Application 2019 & 2032
- Table 42: Canada Global SRAM and ROM Design IP Market Volume (K Unit) Forecast, by Application 2019 & 2032
- Table 43: Mexico Global SRAM and ROM Design IP Market Revenue (Million) Forecast, by Application 2019 & 2032
- Table 44: Mexico Global SRAM and ROM Design IP Market Volume (K Unit) Forecast, by Application 2019 & 2032
- Table 45: Global SRAM and ROM Design IP Market Revenue Million Forecast, by Type 2019 & 2032
- Table 46: Global SRAM and ROM Design IP Market Volume K Unit Forecast, by Type 2019 & 2032
- Table 47: Global SRAM and ROM Design IP Market Revenue Million Forecast, by Application 2019 & 2032
- Table 48: Global SRAM and ROM Design IP Market Volume K Unit Forecast, by Application 2019 & 2032
- Table 49: Global SRAM and ROM Design IP Market Revenue Million Forecast, by Geography 2019 & 2032
- Table 50: Global SRAM and ROM Design IP Market Volume K Unit Forecast, by Geography 2019 & 2032
- Table 51: Global SRAM and ROM Design IP Market Revenue Million Forecast, by Country 2019 & 2032
- Table 52: Global SRAM and ROM Design IP Market Volume K Unit Forecast, by Country 2019 & 2032
- Table 53: Brazil Global SRAM and ROM Design IP Market Revenue (Million) Forecast, by Application 2019 & 2032
- Table 54: Brazil Global SRAM and ROM Design IP Market Volume (K Unit) Forecast, by Application 2019 & 2032
- Table 55: Argentina Global SRAM and ROM Design IP Market Revenue (Million) Forecast, by Application 2019 & 2032
- Table 56: Argentina Global SRAM and ROM Design IP Market Volume (K Unit) Forecast, by Application 2019 & 2032
- Table 57: Rest of South America Global SRAM and ROM Design IP Market Revenue (Million) Forecast, by Application 2019 & 2032
- Table 58: Rest of South America Global SRAM and ROM Design IP Market Volume (K Unit) Forecast, by Application 2019 & 2032
- Table 59: Global SRAM and ROM Design IP Market Revenue Million Forecast, by Type 2019 & 2032
- Table 60: Global SRAM and ROM Design IP Market Volume K Unit Forecast, by Type 2019 & 2032
- Table 61: Global SRAM and ROM Design IP Market Revenue Million Forecast, by Application 2019 & 2032
- Table 62: Global SRAM and ROM Design IP Market Volume K Unit Forecast, by Application 2019 & 2032
- Table 63: Global SRAM and ROM Design IP Market Revenue Million Forecast, by Geography 2019 & 2032
- Table 64: Global SRAM and ROM Design IP Market Volume K Unit Forecast, by Geography 2019 & 2032
- Table 65: Global SRAM and ROM Design IP Market Revenue Million Forecast, by Country 2019 & 2032
- Table 66: Global SRAM and ROM Design IP Market Volume K Unit Forecast, by Country 2019 & 2032
- Table 67: United Kingdom Global SRAM and ROM Design IP Market Revenue (Million) Forecast, by Application 2019 & 2032
- Table 68: United Kingdom Global SRAM and ROM Design IP Market Volume (K Unit) Forecast, by Application 2019 & 2032
- Table 69: Germany Global SRAM and ROM Design IP Market Revenue (Million) Forecast, by Application 2019 & 2032
- Table 70: Germany Global SRAM and ROM Design IP Market Volume (K Unit) Forecast, by Application 2019 & 2032
- Table 71: France Global SRAM and ROM Design IP Market Revenue (Million) Forecast, by Application 2019 & 2032
- Table 72: France Global SRAM and ROM Design IP Market Volume (K Unit) Forecast, by Application 2019 & 2032
- Table 73: Italy Global SRAM and ROM Design IP Market Revenue (Million) Forecast, by Application 2019 & 2032
- Table 74: Italy Global SRAM and ROM Design IP Market Volume (K Unit) Forecast, by Application 2019 & 2032
- Table 75: Spain Global SRAM and ROM Design IP Market Revenue (Million) Forecast, by Application 2019 & 2032
- Table 76: Spain Global SRAM and ROM Design IP Market Volume (K Unit) Forecast, by Application 2019 & 2032
- Table 77: Russia Global SRAM and ROM Design IP Market Revenue (Million) Forecast, by Application 2019 & 2032
- Table 78: Russia Global SRAM and ROM Design IP Market Volume (K Unit) Forecast, by Application 2019 & 2032
- Table 79: Benelux Global SRAM and ROM Design IP Market Revenue (Million) Forecast, by Application 2019 & 2032
- Table 80: Benelux Global SRAM and ROM Design IP Market Volume (K Unit) Forecast, by Application 2019 & 2032
- Table 81: Nordics Global SRAM and ROM Design IP Market Revenue (Million) Forecast, by Application 2019 & 2032
- Table 82: Nordics Global SRAM and ROM Design IP Market Volume (K Unit) Forecast, by Application 2019 & 2032
- Table 83: Rest of Europe Global SRAM and ROM Design IP Market Revenue (Million) Forecast, by Application 2019 & 2032
- Table 84: Rest of Europe Global SRAM and ROM Design IP Market Volume (K Unit) Forecast, by Application 2019 & 2032
- Table 85: Global SRAM and ROM Design IP Market Revenue Million Forecast, by Type 2019 & 2032
- Table 86: Global SRAM and ROM Design IP Market Volume K Unit Forecast, by Type 2019 & 2032
- Table 87: Global SRAM and ROM Design IP Market Revenue Million Forecast, by Application 2019 & 2032
- Table 88: Global SRAM and ROM Design IP Market Volume K Unit Forecast, by Application 2019 & 2032
- Table 89: Global SRAM and ROM Design IP Market Revenue Million Forecast, by Geography 2019 & 2032
- Table 90: Global SRAM and ROM Design IP Market Volume K Unit Forecast, by Geography 2019 & 2032
- Table 91: Global SRAM and ROM Design IP Market Revenue Million Forecast, by Country 2019 & 2032
- Table 92: Global SRAM and ROM Design IP Market Volume K Unit Forecast, by Country 2019 & 2032
- Table 93: Turkey Global SRAM and ROM Design IP Market Revenue (Million) Forecast, by Application 2019 & 2032
- Table 94: Turkey Global SRAM and ROM Design IP Market Volume (K Unit) Forecast, by Application 2019 & 2032
- Table 95: Israel Global SRAM and ROM Design IP Market Revenue (Million) Forecast, by Application 2019 & 2032
- Table 96: Israel Global SRAM and ROM Design IP Market Volume (K Unit) Forecast, by Application 2019 & 2032
- Table 97: GCC Global SRAM and ROM Design IP Market Revenue (Million) Forecast, by Application 2019 & 2032
- Table 98: GCC Global SRAM and ROM Design IP Market Volume (K Unit) Forecast, by Application 2019 & 2032
- Table 99: North Africa Global SRAM and ROM Design IP Market Revenue (Million) Forecast, by Application 2019 & 2032
- Table 100: North Africa Global SRAM and ROM Design IP Market Volume (K Unit) Forecast, by Application 2019 & 2032
- Table 101: South Africa Global SRAM and ROM Design IP Market Revenue (Million) Forecast, by Application 2019 & 2032
- Table 102: South Africa Global SRAM and ROM Design IP Market Volume (K Unit) Forecast, by Application 2019 & 2032
- Table 103: Rest of Middle East & Africa Global SRAM and ROM Design IP Market Revenue (Million) Forecast, by Application 2019 & 2032
- Table 104: Rest of Middle East & Africa Global SRAM and ROM Design IP Market Volume (K Unit) Forecast, by Application 2019 & 2032
- Table 105: Global SRAM and ROM Design IP Market Revenue Million Forecast, by Type 2019 & 2032
- Table 106: Global SRAM and ROM Design IP Market Volume K Unit Forecast, by Type 2019 & 2032
- Table 107: Global SRAM and ROM Design IP Market Revenue Million Forecast, by Application 2019 & 2032
- Table 108: Global SRAM and ROM Design IP Market Volume K Unit Forecast, by Application 2019 & 2032
- Table 109: Global SRAM and ROM Design IP Market Revenue Million Forecast, by Geography 2019 & 2032
- Table 110: Global SRAM and ROM Design IP Market Volume K Unit Forecast, by Geography 2019 & 2032
- Table 111: Global SRAM and ROM Design IP Market Revenue Million Forecast, by Country 2019 & 2032
- Table 112: Global SRAM and ROM Design IP Market Volume K Unit Forecast, by Country 2019 & 2032
- Table 113: China Global SRAM and ROM Design IP Market Revenue (Million) Forecast, by Application 2019 & 2032
- Table 114: China Global SRAM and ROM Design IP Market Volume (K Unit) Forecast, by Application 2019 & 2032
- Table 115: India Global SRAM and ROM Design IP Market Revenue (Million) Forecast, by Application 2019 & 2032
- Table 116: India Global SRAM and ROM Design IP Market Volume (K Unit) Forecast, by Application 2019 & 2032
- Table 117: Japan Global SRAM and ROM Design IP Market Revenue (Million) Forecast, by Application 2019 & 2032
- Table 118: Japan Global SRAM and ROM Design IP Market Volume (K Unit) Forecast, by Application 2019 & 2032
- Table 119: South Korea Global SRAM and ROM Design IP Market Revenue (Million) Forecast, by Application 2019 & 2032
- Table 120: South Korea Global SRAM and ROM Design IP Market Volume (K Unit) Forecast, by Application 2019 & 2032
- Table 121: ASEAN Global SRAM and ROM Design IP Market Revenue (Million) Forecast, by Application 2019 & 2032
- Table 122: ASEAN Global SRAM and ROM Design IP Market Volume (K Unit) Forecast, by Application 2019 & 2032
- Table 123: Oceania Global SRAM and ROM Design IP Market Revenue (Million) Forecast, by Application 2019 & 2032
- Table 124: Oceania Global SRAM and ROM Design IP Market Volume (K Unit) Forecast, by Application 2019 & 2032
- Table 125: Rest of Asia Pacific Global SRAM and ROM Design IP Market Revenue (Million) Forecast, by Application 2019 & 2032
- Table 126: Rest of Asia Pacific Global SRAM and ROM Design IP Market Volume (K Unit) Forecast, by Application 2019 & 2032
Frequently Asked Questions
1. What is the projected Compound Annual Growth Rate (CAGR) of the Global SRAM and ROM Design IP Market?
The projected CAGR is approximately -1.54%.
2. Which companies are prominent players in the Global SRAM and ROM Design IP Market?
Key companies in the market include Avalanche Technology Inc, Everspin Technologies Inc, TekStart LLC, Verisilicon Holdings Co Ltd, Xilinx Inc, Dolphin Design SAS, Arm Holdings, Dolphin Technology Inc, Surecore Ltd, Renesas Electronics Corporation, Synopsys Inc, TDK Corporation, eMemory Technology Inc, Mentor Graphics Corporation.
3. What are the main segments of the Global SRAM and ROM Design IP Market?
The market segments include Type, Application, Geography.
4. Can you provide details about the market size?
The market size is estimated to be USD XX Million as of 2022.
5. What are some drivers contributing to market growth?
Increase in Demand for Autonomous Driving Technology; Growth in Edge Analytics for IoT Application.
6. What are the notable trends driving market growth?
Increasing Demand For Enterprise Storage Applications to Drive the Growth for MRAM.
7. Are there any restraints impacting market growth?
Complexity in Design and AI Interface.
8. Can you provide examples of recent developments in the market?
N/A
9. What pricing options are available for accessing the report?
Pricing options include single-user, multi-user, and enterprise licenses priced at USD 3800, USD 4500, and USD 5800 respectively.
10. Is the market size provided in terms of value or volume?
The market size is provided in terms of value, measured in Million and volume, measured in K Unit.
11. Are there any specific market keywords associated with the report?
Yes, the market keyword associated with the report is "Global SRAM and ROM Design IP Market," which aids in identifying and referencing the specific market segment covered.
12. How do I determine which pricing option suits my needs best?
The pricing options vary based on user requirements and access needs. Individual users may opt for single-user licenses, while businesses requiring broader access may choose multi-user or enterprise licenses for cost-effective access to the report.
13. Are there any additional resources or data provided in the Global SRAM and ROM Design IP Market report?
While the report offers comprehensive insights, it's advisable to review the specific contents or supplementary materials provided to ascertain if additional resources or data are available.
14. How can I stay updated on further developments or reports in the Global SRAM and ROM Design IP Market?
To stay informed about further developments, trends, and reports in the Global SRAM and ROM Design IP Market, consider subscribing to industry newsletters, following relevant companies and organizations, or regularly checking reputable industry news sources and publications.
Methodology
Step 1 - Identification of Relevant Samples Size from Population Database


Step 2 - Approaches for Defining Global Market Size (Value, Volume* & Price*)

Note*: In applicable scenarios
Step 3 - Data Sources
Primary Research
- Web Analytics
- Survey Reports
- Research Institute
- Latest Research Reports
- Opinion Leaders
Secondary Research
- Annual Reports
- White Paper
- Latest Press Release
- Industry Association
- Paid Database
- Investor Presentations

Step 4 - Data Triangulation
Involves using different sources of information in order to increase the validity of a study
These sources are likely to be stakeholders in a program - participants, other researchers, program staff, other community members, and so on.
Then we put all data in single framework & apply various statistical tools to find out the dynamic on the market.
During the analysis stage, feedback from the stakeholder groups would be compared to determine areas of agreement as well as areas of divergence
