

Key Insights
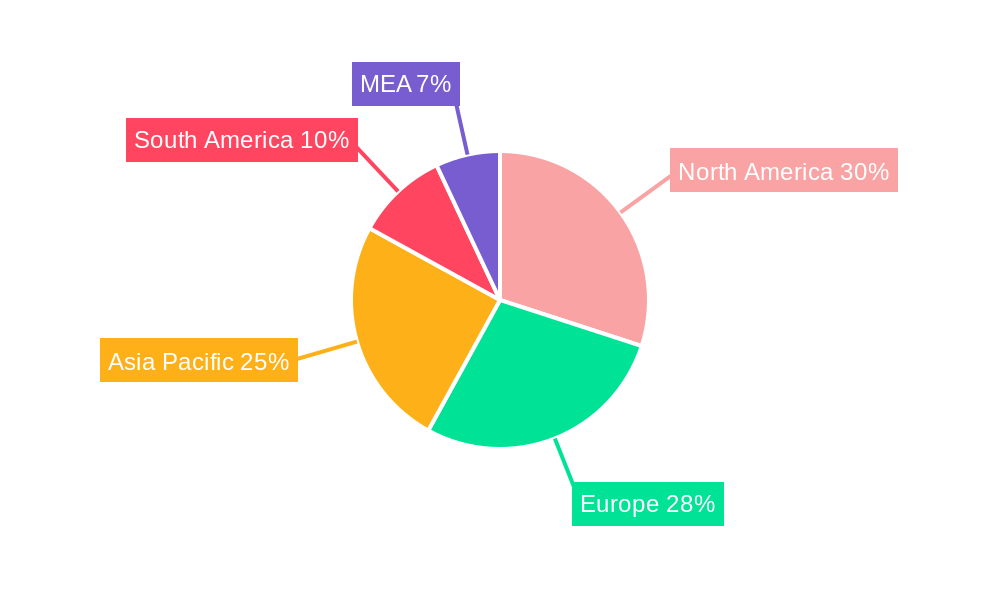
The global glass bottles and containers market is experiencing steady growth, driven by the increasing demand from the food and beverage industry, particularly for alcoholic and non-alcoholic beverages. The market's Compound Annual Growth Rate (CAGR) of 4.33% from 2019 to 2024 suggests a consistent expansion, projected to continue into the forecast period (2025-2033). This growth is fueled by several factors, including the rising consumer preference for sustainable and recyclable packaging, the increasing popularity of premium beverages often packaged in glass, and the growing demand for aesthetically pleasing containers in the cosmetics and pharmaceutical sectors. While the market faces challenges such as fluctuating raw material prices (sand, soda ash, and limestone) and environmental concerns surrounding glass production, these are being addressed by technological advancements in manufacturing and recycling processes. Furthermore, the market's segmentation reveals significant opportunities across various end-user verticals. The beverages sector, encompassing both alcoholic and non-alcoholic drinks, currently dominates the market share, while the food and cosmetics sectors are anticipated to witness substantial growth in the coming years. Geographic distribution shows a strong presence in North America and Europe, with Asia Pacific emerging as a key growth region due to rising disposable incomes and expanding consumer bases.
The competitive landscape is characterized by a mix of large multinational corporations and regional players. Major companies are strategically investing in capacity expansion, advanced manufacturing techniques, and sustainable packaging solutions to maintain their market share. The market is witnessing increasing consolidation, with mergers and acquisitions among key players shaping the future landscape. Regional variations exist in growth rates, with emerging economies in Asia Pacific and parts of South America showing higher growth potential than mature markets in North America and Western Europe. The forecast suggests continued market expansion, driven by increasing consumer demand and ongoing innovation within the industry. Understanding regional nuances and evolving consumer preferences will be crucial for companies seeking success in this dynamic market.
Glass Bottles and Containers Market: A Comprehensive Report (2019-2033)
This insightful report provides a detailed analysis of the global Glass Bottles and Containers Market, offering a comprehensive overview of market dynamics, key players, and future growth prospects. Spanning the period from 2019 to 2033, with 2025 as the base year, this study offers invaluable insights for stakeholders seeking to understand and capitalize on opportunities within this dynamic sector. The market is projected to reach xx Million by 2033, exhibiting a Compound Annual Growth Rate (CAGR) of xx% during the forecast period (2025-2033).
Glass Bottles and Containers Market Market Composition & Trends
The Glass Bottles and Containers market is characterized by a moderately concentrated landscape, with a few major players holding significant market share. The market share distribution is currently estimated as follows: the top 5 players account for approximately xx%, while the remaining market share is distributed among numerous smaller regional and specialized producers. Innovation is a key driver, with companies focusing on lightweighting, improved sustainability through increased recycled content, and specialized closures. The regulatory landscape is increasingly focused on environmental sustainability, driving the adoption of recycled glass and eco-friendly manufacturing processes. Substitute products, such as plastic and aluminum containers, pose a significant competitive threat, although the growing consumer preference for sustainable packaging is mitigating this to some degree. The end-user profiles are diverse, encompassing the beverage, food, cosmetic, and pharmaceutical industries. M&A activity has been moderate in recent years, with deal values averaging approximately xx Million per transaction.
- Market Concentration: Moderately concentrated, with top 5 players holding xx% market share.
- Innovation Catalysts: Lightweighting, sustainability (recycled content), specialized closures.
- Regulatory Landscape: Increasing focus on environmental sustainability.
- Substitute Products: Plastic and aluminum containers.
- End-User Profiles: Beverages, food, cosmetics, pharmaceuticals.
- M&A Activity: Moderate, with average deal values of xx Million.
Glass Bottles and Containers Market Industry Evolution
The Glass Bottles and Containers market has witnessed consistent growth over the historical period (2019-2024), driven by factors such as increasing consumer demand for packaged goods, the growth of the beverage industry, and the rising preference for sustainable and recyclable packaging. The market's growth trajectory is expected to remain positive throughout the forecast period, although growth rates may moderate due to economic uncertainties and competition from alternative packaging materials. Technological advancements, such as improved furnace technology and automation, are enhancing production efficiency and reducing manufacturing costs. Consumer demand is shifting towards premium, aesthetically pleasing packaging, influencing design trends and material choices. The market is experiencing a rising demand for customized and personalized containers, catering to the needs of niche markets and brand differentiation strategies. The adoption of advanced recycling technologies is also increasing, further bolstering the sustainability profile of glass packaging.
Leading Regions, Countries, or Segments in Glass Bottles and Containers Market
The beverage segment dominates the Glass Bottles and Containers market, specifically the alcoholic beverage sub-segment (beer, wine, and spirits). This dominance is primarily attributed to the strong association of glass with premium quality and the inherent suitability of glass for preserving the taste and aroma of alcoholic beverages. The North American and European regions currently hold the largest market share due to high per capita consumption of packaged beverages and well-established glass manufacturing infrastructure.
Key Drivers in Beverage Segment:
- High per capita consumption of alcoholic and non-alcoholic beverages.
- Strong preference for glass packaging in premium segments.
- Robust infrastructure and established glass manufacturing facilities in North America and Europe.
- Growing demand for sustainable packaging options.
Dominance Factors:
- High consumption of bottled beverages in mature markets.
- Strong consumer preference for glass packaging in alcoholic and non-alcoholic beverage categories.
- Established manufacturing base and supply chains in key regions.
Glass Bottles and Containers Market Product Innovations
Recent innovations include the development of lightweight glass bottles, reducing transportation costs and environmental impact. The incorporation of recycled glass content is increasing, driven by sustainability concerns. New closure designs improve functionality and tamper evidence, enhancing product security. The use of advanced coatings enhances the aesthetic appeal and durability of glass containers. These advancements contribute to improved performance metrics, including reduced weight, enhanced sustainability, and increased consumer appeal.
Propelling Factors for Glass Bottles and Containers Market Growth
The Glass Bottles and Containers market is propelled by several factors. Firstly, the growing demand for packaged food and beverages in developing economies drives significant volume growth. Secondly, the consumer preference for eco-friendly and recyclable packaging materials, like glass, enhances the market outlook. Thirdly, technological advancements in manufacturing processes contribute to cost optimization and improved efficiency. Finally, favorable regulatory policies supporting sustainable packaging further augment market expansion.
Obstacles in the Glass Bottles and Containers Market Market
The Glass Bottles and Containers market faces several challenges. The high cost of glass production and transportation compared to alternative materials like plastic remains a significant obstacle. Fluctuations in raw material prices, especially energy costs, impact production costs. Furthermore, stringent environmental regulations concerning manufacturing waste and emissions necessitate continuous improvement in production processes. Competition from alternative packaging solutions remains a key challenge. Supply chain disruptions stemming from global events can also lead to production delays and increased costs.
Future Opportunities in Glass Bottles and Containers Market
Future growth opportunities lie in the development of innovative glass packaging solutions tailored to specific consumer needs, such as reusable and refillable containers. Expansion into emerging markets with a rising middle class presents significant potential. The integration of smart packaging technologies, such as sensors and traceability systems, is another avenue for growth. Furthermore, collaborative efforts with recycling companies and the implementation of circular economy initiatives will enhance sustainability and market acceptance.
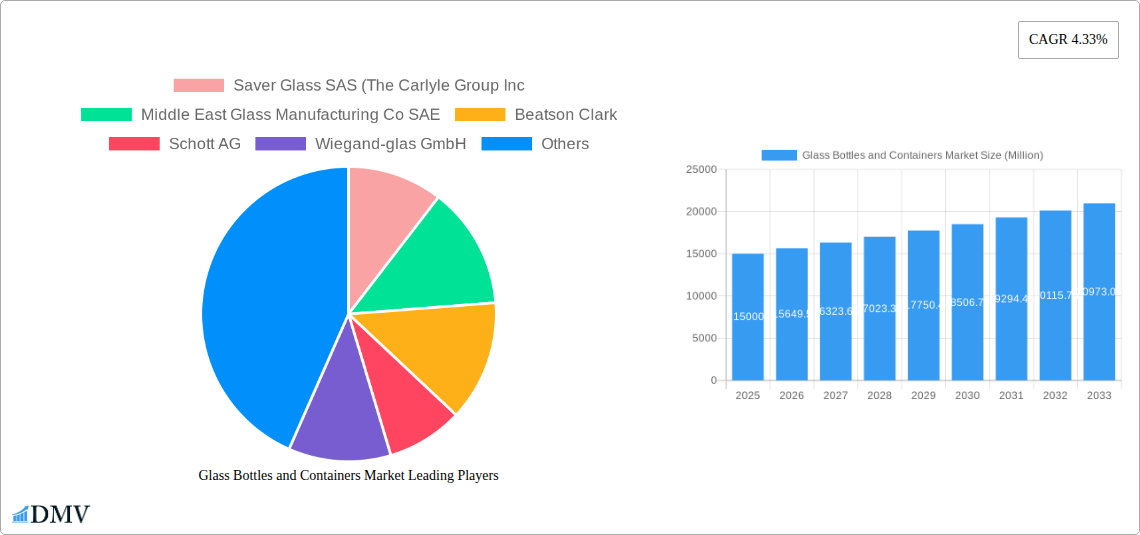
Major Players in the Glass Bottles and Containers Market Ecosystem
- Saver Glass SAS
- The Carlyle Group Inc
- Middle East Glass Manufacturing Co SAE
- Beatson Clark
- Schott AG
- Wiegand-glas GmbH
- Stoelzle Oberglas GmbH (CAG-holding GmbH)
- O-I Glass Inc
- PGP Glass Private Limited
- Vitro SAB de CV
- Verallia Packaging
- Berlin Packaging LLC
- Gaasch Packaging
- Vidrala SA
- Glassworks International Limited
- Ardagh Group S A
- BA VIDRO SA (BA Glass BV)
- SGD SA (SGD Pharma)
- Vetropack Holding Ltd
- VERESCENCE FRANCE
- Gerresheimer AG
Key Developments in Glass Bottles and Containers Market Industry
- August 2023: O-I Glass launched its "Cento per Cento Sicily" bottles, made from 90% recycled Sicilian glass, showcasing a circular economy approach. The lightweight design (410 grams) optimizes energy efficiency.
- January 2023: O-I Glass announced the construction of three new furnaces (Brazil and Italy) to increase production capacity by 400 kilotons annually by 2024, incorporating Oxy-combustion technology for reduced CO2 emissions (approximately 18%).
Strategic Glass Bottles and Containers Market Market Forecast
The Glass Bottles and Containers market is poised for continued growth, driven by the increasing preference for sustainable packaging, rising demand in emerging economies, and advancements in glass manufacturing technology. The focus on lightweighting, recycled content, and innovative designs will further enhance market appeal. The exploration of new applications and market segments will unlock further growth opportunities. The market's trajectory indicates a positive outlook for the coming years, with significant potential for expansion and innovation.
Glass Bottles and Containers Market Segmentation
-
1. End-user Vertical
-
1.1. Bevarages
-
1.1.1. Alcoholic
- 1.1.1.1. Beer and Cider
- 1.1.1.2. Wine and Spirits
- 1.1.1.3. Other Alcoholic Beverages
-
1.1.2. Non-alcoholic
- 1.1.2.1. Carbonated Soft Drinks
- 1.1.2.2. Milk
- 1.1.2.3. Water and Other Non-alcoholic Beverages
-
1.1.1. Alcoholic
- 1.2. Food
- 1.3. Cosmetics
- 1.4. Pharmaceutical
- 1.5. Other End-user Verticals
-
1.1. Bevarages
Glass Bottles and Containers Market Segmentation By Geography
-
1. North America
- 1.1. United States
- 1.2. Canada
-
2. Europe
- 2.1. United Kingdom
- 2.2. Germany
- 2.3. France
- 2.4. Italy
- 2.5. Spain
- 2.6. Poland
- 2.7. Russia
-
3. Asia
- 3.1. China
- 3.2. India
- 3.3. Japan
- 3.4. South Korea
- 3.5. Australia and New Zealand
-
4. Middle East and Africa
- 4.1. United Arab Emirates
- 4.2. Saudi Arabia
- 4.3. South Africa
-
5. Latin America
- 5.1. Brazil
- 5.2. Mexico
- 5.3. Argentina
Glass Bottles and Containers Market REPORT HIGHLIGHTS
| Aspects | Details |
|---|---|
| Study Period | 2019-2033 |
| Base Year | 2024 |
| Estimated Year | 2025 |
| Forecast Period | 2025-2033 |
| Historical Period | 2019-2024 |
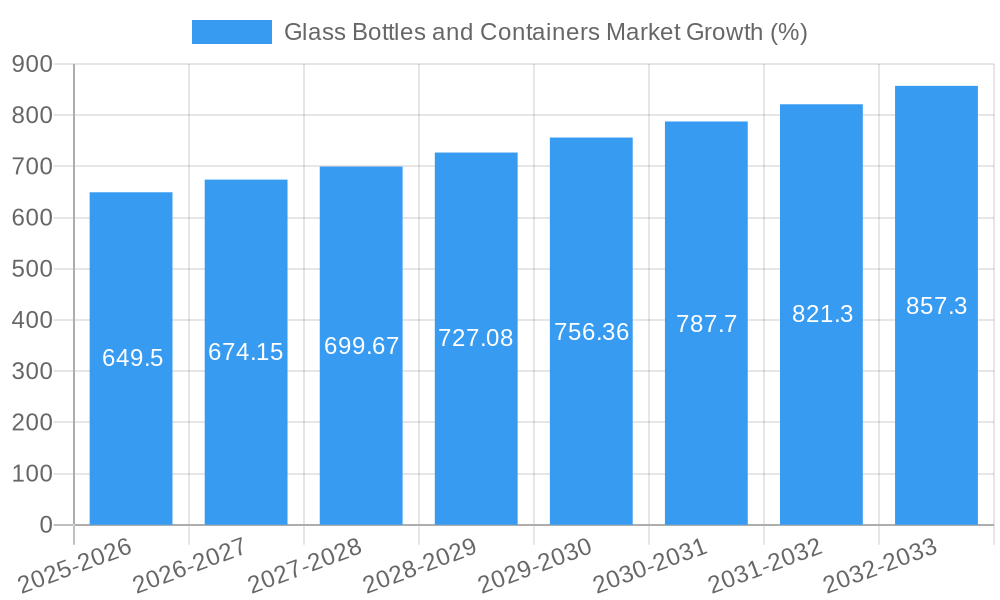
| Growth Rate | CAGR of 4.33% from 2019-2033 |
| Segmentation |
|
Table of Contents
- 1. Introduction
- 1.1. Research Scope
- 1.2. Market Segmentation
- 1.3. Research Methodology
- 1.4. Definitions and Assumptions
- 2. Executive Summary
- 2.1. Introduction
- 3. Market Dynamics
- 3.1. Introduction
- 3.2. Market Drivers
- 3.2.1. Growing Demand from Food and Beverage Industry; Sustainability and Recyclability Initiatives Moving Packagers and Consumer Brands to Glass Packaging
- 3.3. Market Restrains
- 3.3.1. High Carbon Footprint due to Glass Manufacturing; Operation and Logistical Concerns
- 3.4. Market Trends
- 3.4.1. Wine and Spirits to Lead the Non-alcoholic Beverages Segment
- 4. Market Factor Analysis
- 4.1. Porters Five Forces
- 4.2. Supply/Value Chain
- 4.3. PESTEL analysis
- 4.4. Market Entropy
- 4.5. Patent/Trademark Analysis
- 5. Global Glass Bottles and Containers Market Analysis, Insights and Forecast, 2019-2031
- 5.1. Market Analysis, Insights and Forecast - by End-user Vertical
- 5.1.1. Bevarages
- 5.1.1.1. Alcoholic
- 5.1.1.1.1. Beer and Cider
- 5.1.1.1.2. Wine and Spirits
- 5.1.1.1.3. Other Alcoholic Beverages
- 5.1.1.2. Non-alcoholic
- 5.1.1.2.1. Carbonated Soft Drinks
- 5.1.1.2.2. Milk
- 5.1.1.2.3. Water and Other Non-alcoholic Beverages
- 5.1.1.1. Alcoholic
- 5.1.2. Food
- 5.1.3. Cosmetics
- 5.1.4. Pharmaceutical
- 5.1.5. Other End-user Verticals
- 5.1.1. Bevarages
- 5.2. Market Analysis, Insights and Forecast - by Region
- 5.2.1. North America
- 5.2.2. Europe
- 5.2.3. Asia
- 5.2.4. Middle East and Africa
- 5.2.5. Latin America
- 5.1. Market Analysis, Insights and Forecast - by End-user Vertical
- 6. North America Glass Bottles and Containers Market Analysis, Insights and Forecast, 2019-2031
- 6.1. Market Analysis, Insights and Forecast - by End-user Vertical
- 6.1.1. Bevarages
- 6.1.1.1. Alcoholic
- 6.1.1.1.1. Beer and Cider
- 6.1.1.1.2. Wine and Spirits
- 6.1.1.1.3. Other Alcoholic Beverages
- 6.1.1.2. Non-alcoholic
- 6.1.1.2.1. Carbonated Soft Drinks
- 6.1.1.2.2. Milk
- 6.1.1.2.3. Water and Other Non-alcoholic Beverages
- 6.1.1.1. Alcoholic
- 6.1.2. Food
- 6.1.3. Cosmetics
- 6.1.4. Pharmaceutical
- 6.1.5. Other End-user Verticals
- 6.1.1. Bevarages
- 6.1. Market Analysis, Insights and Forecast - by End-user Vertical
- 7. Europe Glass Bottles and Containers Market Analysis, Insights and Forecast, 2019-2031
- 7.1. Market Analysis, Insights and Forecast - by End-user Vertical
- 7.1.1. Bevarages
- 7.1.1.1. Alcoholic
- 7.1.1.1.1. Beer and Cider
- 7.1.1.1.2. Wine and Spirits
- 7.1.1.1.3. Other Alcoholic Beverages
- 7.1.1.2. Non-alcoholic
- 7.1.1.2.1. Carbonated Soft Drinks
- 7.1.1.2.2. Milk
- 7.1.1.2.3. Water and Other Non-alcoholic Beverages
- 7.1.1.1. Alcoholic
- 7.1.2. Food
- 7.1.3. Cosmetics
- 7.1.4. Pharmaceutical
- 7.1.5. Other End-user Verticals
- 7.1.1. Bevarages
- 7.1. Market Analysis, Insights and Forecast - by End-user Vertical
- 8. Asia Glass Bottles and Containers Market Analysis, Insights and Forecast, 2019-2031
- 8.1. Market Analysis, Insights and Forecast - by End-user Vertical
- 8.1.1. Bevarages
- 8.1.1.1. Alcoholic
- 8.1.1.1.1. Beer and Cider
- 8.1.1.1.2. Wine and Spirits
- 8.1.1.1.3. Other Alcoholic Beverages
- 8.1.1.2. Non-alcoholic
- 8.1.1.2.1. Carbonated Soft Drinks
- 8.1.1.2.2. Milk
- 8.1.1.2.3. Water and Other Non-alcoholic Beverages
- 8.1.1.1. Alcoholic
- 8.1.2. Food
- 8.1.3. Cosmetics
- 8.1.4. Pharmaceutical
- 8.1.5. Other End-user Verticals
- 8.1.1. Bevarages
- 8.1. Market Analysis, Insights and Forecast - by End-user Vertical
- 9. Middle East and Africa Glass Bottles and Containers Market Analysis, Insights and Forecast, 2019-2031
- 9.1. Market Analysis, Insights and Forecast - by End-user Vertical
- 9.1.1. Bevarages
- 9.1.1.1. Alcoholic
- 9.1.1.1.1. Beer and Cider
- 9.1.1.1.2. Wine and Spirits
- 9.1.1.1.3. Other Alcoholic Beverages
- 9.1.1.2. Non-alcoholic
- 9.1.1.2.1. Carbonated Soft Drinks
- 9.1.1.2.2. Milk
- 9.1.1.2.3. Water and Other Non-alcoholic Beverages
- 9.1.1.1. Alcoholic
- 9.1.2. Food
- 9.1.3. Cosmetics
- 9.1.4. Pharmaceutical
- 9.1.5. Other End-user Verticals
- 9.1.1. Bevarages
- 9.1. Market Analysis, Insights and Forecast - by End-user Vertical
- 10. Latin America Glass Bottles and Containers Market Analysis, Insights and Forecast, 2019-2031
- 10.1. Market Analysis, Insights and Forecast - by End-user Vertical
- 10.1.1. Bevarages
- 10.1.1.1. Alcoholic
- 10.1.1.1.1. Beer and Cider
- 10.1.1.1.2. Wine and Spirits
- 10.1.1.1.3. Other Alcoholic Beverages
- 10.1.1.2. Non-alcoholic
- 10.1.1.2.1. Carbonated Soft Drinks
- 10.1.1.2.2. Milk
- 10.1.1.2.3. Water and Other Non-alcoholic Beverages
- 10.1.1.1. Alcoholic
- 10.1.2. Food
- 10.1.3. Cosmetics
- 10.1.4. Pharmaceutical
- 10.1.5. Other End-user Verticals
- 10.1.1. Bevarages
- 10.1. Market Analysis, Insights and Forecast - by End-user Vertical
- 11. North America Glass Bottles and Containers Market Analysis, Insights and Forecast, 2019-2031
- 11.1. Market Analysis, Insights and Forecast - By Country/Sub-region
- 11.1.1 United States
- 11.1.2 Canada
- 11.1.3 Mexico
- 12. Europe Glass Bottles and Containers Market Analysis, Insights and Forecast, 2019-2031
- 12.1. Market Analysis, Insights and Forecast - By Country/Sub-region
- 12.1.1 Germany
- 12.1.2 United Kingdom
- 12.1.3 France
- 12.1.4 Spain
- 12.1.5 Italy
- 12.1.6 Spain
- 12.1.7 Belgium
- 12.1.8 Netherland
- 12.1.9 Nordics
- 12.1.10 Rest of Europe
- 13. Asia Pacific Glass Bottles and Containers Market Analysis, Insights and Forecast, 2019-2031
- 13.1. Market Analysis, Insights and Forecast - By Country/Sub-region
- 13.1.1 China
- 13.1.2 Japan
- 13.1.3 India
- 13.1.4 South Korea
- 13.1.5 Southeast Asia
- 13.1.6 Australia
- 13.1.7 Indonesia
- 13.1.8 Phillipes
- 13.1.9 Singapore
- 13.1.10 Thailandc
- 13.1.11 Rest of Asia Pacific
- 14. South America Glass Bottles and Containers Market Analysis, Insights and Forecast, 2019-2031
- 14.1. Market Analysis, Insights and Forecast - By Country/Sub-region
- 14.1.1 Brazil
- 14.1.2 Argentina
- 14.1.3 Peru
- 14.1.4 Chile
- 14.1.5 Colombia
- 14.1.6 Ecuador
- 14.1.7 Venezuela
- 14.1.8 Rest of South America
- 15. North America Glass Bottles and Containers Market Analysis, Insights and Forecast, 2019-2031
- 15.1. Market Analysis, Insights and Forecast - By Country/Sub-region
- 15.1.1 United States
- 15.1.2 Canada
- 15.1.3 Mexico
- 16. MEA Glass Bottles and Containers Market Analysis, Insights and Forecast, 2019-2031
- 16.1. Market Analysis, Insights and Forecast - By Country/Sub-region
- 16.1.1 United Arab Emirates
- 16.1.2 Saudi Arabia
- 16.1.3 South Africa
- 16.1.4 Rest of Middle East and Africa
- 17. Competitive Analysis
- 17.1. Global Market Share Analysis 2024
- 17.2. Company Profiles
- 17.2.1 Saver Glass SAS (The Carlyle Group Inc
- 17.2.1.1. Overview
- 17.2.1.2. Products
- 17.2.1.3. SWOT Analysis
- 17.2.1.4. Recent Developments
- 17.2.1.5. Financials (Based on Availability)
- 17.2.2 Middle East Glass Manufacturing Co SAE
- 17.2.2.1. Overview
- 17.2.2.2. Products
- 17.2.2.3. SWOT Analysis
- 17.2.2.4. Recent Developments
- 17.2.2.5. Financials (Based on Availability)
- 17.2.3 Beatson Clark
- 17.2.3.1. Overview
- 17.2.3.2. Products
- 17.2.3.3. SWOT Analysis
- 17.2.3.4. Recent Developments
- 17.2.3.5. Financials (Based on Availability)
- 17.2.4 Schott AG
- 17.2.4.1. Overview
- 17.2.4.2. Products
- 17.2.4.3. SWOT Analysis
- 17.2.4.4. Recent Developments
- 17.2.4.5. Financials (Based on Availability)
- 17.2.5 Wiegand-glas GmbH
- 17.2.5.1. Overview
- 17.2.5.2. Products
- 17.2.5.3. SWOT Analysis
- 17.2.5.4. Recent Developments
- 17.2.5.5. Financials (Based on Availability)
- 17.2.6 Stoelzle Oberglas GmbH (CAG-holding GmbH)
- 17.2.6.1. Overview
- 17.2.6.2. Products
- 17.2.6.3. SWOT Analysis
- 17.2.6.4. Recent Developments
- 17.2.6.5. Financials (Based on Availability)
- 17.2.7 O-I Glass Inc
- 17.2.7.1. Overview
- 17.2.7.2. Products
- 17.2.7.3. SWOT Analysis
- 17.2.7.4. Recent Developments
- 17.2.7.5. Financials (Based on Availability)
- 17.2.8 PGP Glass Private Limited
- 17.2.8.1. Overview
- 17.2.8.2. Products
- 17.2.8.3. SWOT Analysis
- 17.2.8.4. Recent Developments
- 17.2.8.5. Financials (Based on Availability)
- 17.2.9 Vitro SAB de CV
- 17.2.9.1. Overview
- 17.2.9.2. Products
- 17.2.9.3. SWOT Analysis
- 17.2.9.4. Recent Developments
- 17.2.9.5. Financials (Based on Availability)
- 17.2.10 Verallia Packaging
- 17.2.10.1. Overview
- 17.2.10.2. Products
- 17.2.10.3. SWOT Analysis
- 17.2.10.4. Recent Developments
- 17.2.10.5. Financials (Based on Availability)
- 17.2.11 Berlin Packaging LLC
- 17.2.11.1. Overview
- 17.2.11.2. Products
- 17.2.11.3. SWOT Analysis
- 17.2.11.4. Recent Developments
- 17.2.11.5. Financials (Based on Availability)
- 17.2.12 Gaasch Packaging
- 17.2.12.1. Overview
- 17.2.12.2. Products
- 17.2.12.3. SWOT Analysis
- 17.2.12.4. Recent Developments
- 17.2.12.5. Financials (Based on Availability)
- 17.2.13 Vidrala SA
- 17.2.13.1. Overview
- 17.2.13.2. Products
- 17.2.13.3. SWOT Analysis
- 17.2.13.4. Recent Developments
- 17.2.13.5. Financials (Based on Availability)
- 17.2.14 Glassworks International Limited
- 17.2.14.1. Overview
- 17.2.14.2. Products
- 17.2.14.3. SWOT Analysis
- 17.2.14.4. Recent Developments
- 17.2.14.5. Financials (Based on Availability)
- 17.2.15 Ardagh Group S A
- 17.2.15.1. Overview
- 17.2.15.2. Products
- 17.2.15.3. SWOT Analysis
- 17.2.15.4. Recent Developments
- 17.2.15.5. Financials (Based on Availability)
- 17.2.16 BA VIDRO SA (BA Glass BV)
- 17.2.16.1. Overview
- 17.2.16.2. Products
- 17.2.16.3. SWOT Analysis
- 17.2.16.4. Recent Developments
- 17.2.16.5. Financials (Based on Availability)
- 17.2.17 SGD SA (SGD Pharma)
- 17.2.17.1. Overview
- 17.2.17.2. Products
- 17.2.17.3. SWOT Analysis
- 17.2.17.4. Recent Developments
- 17.2.17.5. Financials (Based on Availability)
- 17.2.18 Vetropack Holding Ltd
- 17.2.18.1. Overview
- 17.2.18.2. Products
- 17.2.18.3. SWOT Analysis
- 17.2.18.4. Recent Developments
- 17.2.18.5. Financials (Based on Availability)
- 17.2.19 VERESCENCE FRANCE
- 17.2.19.1. Overview
- 17.2.19.2. Products
- 17.2.19.3. SWOT Analysis
- 17.2.19.4. Recent Developments
- 17.2.19.5. Financials (Based on Availability)
- 17.2.20 Gerresheimer AG
- 17.2.20.1. Overview
- 17.2.20.2. Products
- 17.2.20.3. SWOT Analysis
- 17.2.20.4. Recent Developments
- 17.2.20.5. Financials (Based on Availability)
- 17.2.1 Saver Glass SAS (The Carlyle Group Inc
List of Figures
- Figure 1: Global Glass Bottles and Containers Market Revenue Breakdown (Million, %) by Region 2024 & 2032
- Figure 2: Global Glass Bottles and Containers Market Volume Breakdown (Trillion, %) by Region 2024 & 2032
- Figure 3: North America Glass Bottles and Containers Market Revenue (Million), by Country 2024 & 2032
- Figure 4: North America Glass Bottles and Containers Market Volume (Trillion), by Country 2024 & 2032
- Figure 5: North America Glass Bottles and Containers Market Revenue Share (%), by Country 2024 & 2032
- Figure 6: North America Glass Bottles and Containers Market Volume Share (%), by Country 2024 & 2032
- Figure 7: Europe Glass Bottles and Containers Market Revenue (Million), by Country 2024 & 2032
- Figure 8: Europe Glass Bottles and Containers Market Volume (Trillion), by Country 2024 & 2032
- Figure 9: Europe Glass Bottles and Containers Market Revenue Share (%), by Country 2024 & 2032
- Figure 10: Europe Glass Bottles and Containers Market Volume Share (%), by Country 2024 & 2032
- Figure 11: Asia Pacific Glass Bottles and Containers Market Revenue (Million), by Country 2024 & 2032
- Figure 12: Asia Pacific Glass Bottles and Containers Market Volume (Trillion), by Country 2024 & 2032
- Figure 13: Asia Pacific Glass Bottles and Containers Market Revenue Share (%), by Country 2024 & 2032
- Figure 14: Asia Pacific Glass Bottles and Containers Market Volume Share (%), by Country 2024 & 2032
- Figure 15: South America Glass Bottles and Containers Market Revenue (Million), by Country 2024 & 2032
- Figure 16: South America Glass Bottles and Containers Market Volume (Trillion), by Country 2024 & 2032
- Figure 17: South America Glass Bottles and Containers Market Revenue Share (%), by Country 2024 & 2032
- Figure 18: South America Glass Bottles and Containers Market Volume Share (%), by Country 2024 & 2032
- Figure 19: North America Glass Bottles and Containers Market Revenue (Million), by Country 2024 & 2032
- Figure 20: North America Glass Bottles and Containers Market Volume (Trillion), by Country 2024 & 2032
- Figure 21: North America Glass Bottles and Containers Market Revenue Share (%), by Country 2024 & 2032
- Figure 22: North America Glass Bottles and Containers Market Volume Share (%), by Country 2024 & 2032
- Figure 23: MEA Glass Bottles and Containers Market Revenue (Million), by Country 2024 & 2032
- Figure 24: MEA Glass Bottles and Containers Market Volume (Trillion), by Country 2024 & 2032
- Figure 25: MEA Glass Bottles and Containers Market Revenue Share (%), by Country 2024 & 2032
- Figure 26: MEA Glass Bottles and Containers Market Volume Share (%), by Country 2024 & 2032
- Figure 27: North America Glass Bottles and Containers Market Revenue (Million), by End-user Vertical 2024 & 2032
- Figure 28: North America Glass Bottles and Containers Market Volume (Trillion), by End-user Vertical 2024 & 2032
- Figure 29: North America Glass Bottles and Containers Market Revenue Share (%), by End-user Vertical 2024 & 2032
- Figure 30: North America Glass Bottles and Containers Market Volume Share (%), by End-user Vertical 2024 & 2032
- Figure 31: North America Glass Bottles and Containers Market Revenue (Million), by Country 2024 & 2032
- Figure 32: North America Glass Bottles and Containers Market Volume (Trillion), by Country 2024 & 2032
- Figure 33: North America Glass Bottles and Containers Market Revenue Share (%), by Country 2024 & 2032
- Figure 34: North America Glass Bottles and Containers Market Volume Share (%), by Country 2024 & 2032
- Figure 35: Europe Glass Bottles and Containers Market Revenue (Million), by End-user Vertical 2024 & 2032
- Figure 36: Europe Glass Bottles and Containers Market Volume (Trillion), by End-user Vertical 2024 & 2032
- Figure 37: Europe Glass Bottles and Containers Market Revenue Share (%), by End-user Vertical 2024 & 2032
- Figure 38: Europe Glass Bottles and Containers Market Volume Share (%), by End-user Vertical 2024 & 2032
- Figure 39: Europe Glass Bottles and Containers Market Revenue (Million), by Country 2024 & 2032
- Figure 40: Europe Glass Bottles and Containers Market Volume (Trillion), by Country 2024 & 2032
- Figure 41: Europe Glass Bottles and Containers Market Revenue Share (%), by Country 2024 & 2032
- Figure 42: Europe Glass Bottles and Containers Market Volume Share (%), by Country 2024 & 2032
- Figure 43: Asia Glass Bottles and Containers Market Revenue (Million), by End-user Vertical 2024 & 2032
- Figure 44: Asia Glass Bottles and Containers Market Volume (Trillion), by End-user Vertical 2024 & 2032
- Figure 45: Asia Glass Bottles and Containers Market Revenue Share (%), by End-user Vertical 2024 & 2032
- Figure 46: Asia Glass Bottles and Containers Market Volume Share (%), by End-user Vertical 2024 & 2032
- Figure 47: Asia Glass Bottles and Containers Market Revenue (Million), by Country 2024 & 2032
- Figure 48: Asia Glass Bottles and Containers Market Volume (Trillion), by Country 2024 & 2032
- Figure 49: Asia Glass Bottles and Containers Market Revenue Share (%), by Country 2024 & 2032
- Figure 50: Asia Glass Bottles and Containers Market Volume Share (%), by Country 2024 & 2032
- Figure 51: Middle East and Africa Glass Bottles and Containers Market Revenue (Million), by End-user Vertical 2024 & 2032
- Figure 52: Middle East and Africa Glass Bottles and Containers Market Volume (Trillion), by End-user Vertical 2024 & 2032
- Figure 53: Middle East and Africa Glass Bottles and Containers Market Revenue Share (%), by End-user Vertical 2024 & 2032
- Figure 54: Middle East and Africa Glass Bottles and Containers Market Volume Share (%), by End-user Vertical 2024 & 2032
- Figure 55: Middle East and Africa Glass Bottles and Containers Market Revenue (Million), by Country 2024 & 2032
- Figure 56: Middle East and Africa Glass Bottles and Containers Market Volume (Trillion), by Country 2024 & 2032
- Figure 57: Middle East and Africa Glass Bottles and Containers Market Revenue Share (%), by Country 2024 & 2032
- Figure 58: Middle East and Africa Glass Bottles and Containers Market Volume Share (%), by Country 2024 & 2032
- Figure 59: Latin America Glass Bottles and Containers Market Revenue (Million), by End-user Vertical 2024 & 2032
- Figure 60: Latin America Glass Bottles and Containers Market Volume (Trillion), by End-user Vertical 2024 & 2032
- Figure 61: Latin America Glass Bottles and Containers Market Revenue Share (%), by End-user Vertical 2024 & 2032
- Figure 62: Latin America Glass Bottles and Containers Market Volume Share (%), by End-user Vertical 2024 & 2032
- Figure 63: Latin America Glass Bottles and Containers Market Revenue (Million), by Country 2024 & 2032
- Figure 64: Latin America Glass Bottles and Containers Market Volume (Trillion), by Country 2024 & 2032
- Figure 65: Latin America Glass Bottles and Containers Market Revenue Share (%), by Country 2024 & 2032
- Figure 66: Latin America Glass Bottles and Containers Market Volume Share (%), by Country 2024 & 2032
List of Tables
- Table 1: Global Glass Bottles and Containers Market Revenue Million Forecast, by Region 2019 & 2032
- Table 2: Global Glass Bottles and Containers Market Volume Trillion Forecast, by Region 2019 & 2032
- Table 3: Global Glass Bottles and Containers Market Revenue Million Forecast, by End-user Vertical 2019 & 2032
- Table 4: Global Glass Bottles and Containers Market Volume Trillion Forecast, by End-user Vertical 2019 & 2032
- Table 5: Global Glass Bottles and Containers Market Revenue Million Forecast, by Region 2019 & 2032
- Table 6: Global Glass Bottles and Containers Market Volume Trillion Forecast, by Region 2019 & 2032
- Table 7: Global Glass Bottles and Containers Market Revenue Million Forecast, by Country 2019 & 2032
- Table 8: Global Glass Bottles and Containers Market Volume Trillion Forecast, by Country 2019 & 2032
- Table 9: United States Glass Bottles and Containers Market Revenue (Million) Forecast, by Application 2019 & 2032
- Table 10: United States Glass Bottles and Containers Market Volume (Trillion) Forecast, by Application 2019 & 2032
- Table 11: Canada Glass Bottles and Containers Market Revenue (Million) Forecast, by Application 2019 & 2032
- Table 12: Canada Glass Bottles and Containers Market Volume (Trillion) Forecast, by Application 2019 & 2032
- Table 13: Mexico Glass Bottles and Containers Market Revenue (Million) Forecast, by Application 2019 & 2032
- Table 14: Mexico Glass Bottles and Containers Market Volume (Trillion) Forecast, by Application 2019 & 2032
- Table 15: Global Glass Bottles and Containers Market Revenue Million Forecast, by Country 2019 & 2032
- Table 16: Global Glass Bottles and Containers Market Volume Trillion Forecast, by Country 2019 & 2032
- Table 17: Germany Glass Bottles and Containers Market Revenue (Million) Forecast, by Application 2019 & 2032
- Table 18: Germany Glass Bottles and Containers Market Volume (Trillion) Forecast, by Application 2019 & 2032
- Table 19: United Kingdom Glass Bottles and Containers Market Revenue (Million) Forecast, by Application 2019 & 2032
- Table 20: United Kingdom Glass Bottles and Containers Market Volume (Trillion) Forecast, by Application 2019 & 2032
- Table 21: France Glass Bottles and Containers Market Revenue (Million) Forecast, by Application 2019 & 2032
- Table 22: France Glass Bottles and Containers Market Volume (Trillion) Forecast, by Application 2019 & 2032
- Table 23: Spain Glass Bottles and Containers Market Revenue (Million) Forecast, by Application 2019 & 2032
- Table 24: Spain Glass Bottles and Containers Market Volume (Trillion) Forecast, by Application 2019 & 2032
- Table 25: Italy Glass Bottles and Containers Market Revenue (Million) Forecast, by Application 2019 & 2032
- Table 26: Italy Glass Bottles and Containers Market Volume (Trillion) Forecast, by Application 2019 & 2032
- Table 27: Spain Glass Bottles and Containers Market Revenue (Million) Forecast, by Application 2019 & 2032
- Table 28: Spain Glass Bottles and Containers Market Volume (Trillion) Forecast, by Application 2019 & 2032
- Table 29: Belgium Glass Bottles and Containers Market Revenue (Million) Forecast, by Application 2019 & 2032
- Table 30: Belgium Glass Bottles and Containers Market Volume (Trillion) Forecast, by Application 2019 & 2032
- Table 31: Netherland Glass Bottles and Containers Market Revenue (Million) Forecast, by Application 2019 & 2032
- Table 32: Netherland Glass Bottles and Containers Market Volume (Trillion) Forecast, by Application 2019 & 2032
- Table 33: Nordics Glass Bottles and Containers Market Revenue (Million) Forecast, by Application 2019 & 2032
- Table 34: Nordics Glass Bottles and Containers Market Volume (Trillion) Forecast, by Application 2019 & 2032
- Table 35: Rest of Europe Glass Bottles and Containers Market Revenue (Million) Forecast, by Application 2019 & 2032
- Table 36: Rest of Europe Glass Bottles and Containers Market Volume (Trillion) Forecast, by Application 2019 & 2032
- Table 37: Global Glass Bottles and Containers Market Revenue Million Forecast, by Country 2019 & 2032
- Table 38: Global Glass Bottles and Containers Market Volume Trillion Forecast, by Country 2019 & 2032
- Table 39: China Glass Bottles and Containers Market Revenue (Million) Forecast, by Application 2019 & 2032
- Table 40: China Glass Bottles and Containers Market Volume (Trillion) Forecast, by Application 2019 & 2032
- Table 41: Japan Glass Bottles and Containers Market Revenue (Million) Forecast, by Application 2019 & 2032
- Table 42: Japan Glass Bottles and Containers Market Volume (Trillion) Forecast, by Application 2019 & 2032
- Table 43: India Glass Bottles and Containers Market Revenue (Million) Forecast, by Application 2019 & 2032
- Table 44: India Glass Bottles and Containers Market Volume (Trillion) Forecast, by Application 2019 & 2032
- Table 45: South Korea Glass Bottles and Containers Market Revenue (Million) Forecast, by Application 2019 & 2032
- Table 46: South Korea Glass Bottles and Containers Market Volume (Trillion) Forecast, by Application 2019 & 2032
- Table 47: Southeast Asia Glass Bottles and Containers Market Revenue (Million) Forecast, by Application 2019 & 2032
- Table 48: Southeast Asia Glass Bottles and Containers Market Volume (Trillion) Forecast, by Application 2019 & 2032
- Table 49: Australia Glass Bottles and Containers Market Revenue (Million) Forecast, by Application 2019 & 2032
- Table 50: Australia Glass Bottles and Containers Market Volume (Trillion) Forecast, by Application 2019 & 2032
- Table 51: Indonesia Glass Bottles and Containers Market Revenue (Million) Forecast, by Application 2019 & 2032
- Table 52: Indonesia Glass Bottles and Containers Market Volume (Trillion) Forecast, by Application 2019 & 2032
- Table 53: Phillipes Glass Bottles and Containers Market Revenue (Million) Forecast, by Application 2019 & 2032
- Table 54: Phillipes Glass Bottles and Containers Market Volume (Trillion) Forecast, by Application 2019 & 2032
- Table 55: Singapore Glass Bottles and Containers Market Revenue (Million) Forecast, by Application 2019 & 2032
- Table 56: Singapore Glass Bottles and Containers Market Volume (Trillion) Forecast, by Application 2019 & 2032
- Table 57: Thailandc Glass Bottles and Containers Market Revenue (Million) Forecast, by Application 2019 & 2032
- Table 58: Thailandc Glass Bottles and Containers Market Volume (Trillion) Forecast, by Application 2019 & 2032
- Table 59: Rest of Asia Pacific Glass Bottles and Containers Market Revenue (Million) Forecast, by Application 2019 & 2032
- Table 60: Rest of Asia Pacific Glass Bottles and Containers Market Volume (Trillion) Forecast, by Application 2019 & 2032
- Table 61: Global Glass Bottles and Containers Market Revenue Million Forecast, by Country 2019 & 2032
- Table 62: Global Glass Bottles and Containers Market Volume Trillion Forecast, by Country 2019 & 2032
- Table 63: Brazil Glass Bottles and Containers Market Revenue (Million) Forecast, by Application 2019 & 2032
- Table 64: Brazil Glass Bottles and Containers Market Volume (Trillion) Forecast, by Application 2019 & 2032
- Table 65: Argentina Glass Bottles and Containers Market Revenue (Million) Forecast, by Application 2019 & 2032
- Table 66: Argentina Glass Bottles and Containers Market Volume (Trillion) Forecast, by Application 2019 & 2032
- Table 67: Peru Glass Bottles and Containers Market Revenue (Million) Forecast, by Application 2019 & 2032
- Table 68: Peru Glass Bottles and Containers Market Volume (Trillion) Forecast, by Application 2019 & 2032
- Table 69: Chile Glass Bottles and Containers Market Revenue (Million) Forecast, by Application 2019 & 2032
- Table 70: Chile Glass Bottles and Containers Market Volume (Trillion) Forecast, by Application 2019 & 2032
- Table 71: Colombia Glass Bottles and Containers Market Revenue (Million) Forecast, by Application 2019 & 2032
- Table 72: Colombia Glass Bottles and Containers Market Volume (Trillion) Forecast, by Application 2019 & 2032
- Table 73: Ecuador Glass Bottles and Containers Market Revenue (Million) Forecast, by Application 2019 & 2032
- Table 74: Ecuador Glass Bottles and Containers Market Volume (Trillion) Forecast, by Application 2019 & 2032
- Table 75: Venezuela Glass Bottles and Containers Market Revenue (Million) Forecast, by Application 2019 & 2032
- Table 76: Venezuela Glass Bottles and Containers Market Volume (Trillion) Forecast, by Application 2019 & 2032
- Table 77: Rest of South America Glass Bottles and Containers Market Revenue (Million) Forecast, by Application 2019 & 2032
- Table 78: Rest of South America Glass Bottles and Containers Market Volume (Trillion) Forecast, by Application 2019 & 2032
- Table 79: Global Glass Bottles and Containers Market Revenue Million Forecast, by Country 2019 & 2032
- Table 80: Global Glass Bottles and Containers Market Volume Trillion Forecast, by Country 2019 & 2032
- Table 81: United States Glass Bottles and Containers Market Revenue (Million) Forecast, by Application 2019 & 2032
- Table 82: United States Glass Bottles and Containers Market Volume (Trillion) Forecast, by Application 2019 & 2032
- Table 83: Canada Glass Bottles and Containers Market Revenue (Million) Forecast, by Application 2019 & 2032
- Table 84: Canada Glass Bottles and Containers Market Volume (Trillion) Forecast, by Application 2019 & 2032
- Table 85: Mexico Glass Bottles and Containers Market Revenue (Million) Forecast, by Application 2019 & 2032
- Table 86: Mexico Glass Bottles and Containers Market Volume (Trillion) Forecast, by Application 2019 & 2032
- Table 87: Global Glass Bottles and Containers Market Revenue Million Forecast, by Country 2019 & 2032
- Table 88: Global Glass Bottles and Containers Market Volume Trillion Forecast, by Country 2019 & 2032
- Table 89: United Arab Emirates Glass Bottles and Containers Market Revenue (Million) Forecast, by Application 2019 & 2032
- Table 90: United Arab Emirates Glass Bottles and Containers Market Volume (Trillion) Forecast, by Application 2019 & 2032
- Table 91: Saudi Arabia Glass Bottles and Containers Market Revenue (Million) Forecast, by Application 2019 & 2032
- Table 92: Saudi Arabia Glass Bottles and Containers Market Volume (Trillion) Forecast, by Application 2019 & 2032
- Table 93: South Africa Glass Bottles and Containers Market Revenue (Million) Forecast, by Application 2019 & 2032
- Table 94: South Africa Glass Bottles and Containers Market Volume (Trillion) Forecast, by Application 2019 & 2032
- Table 95: Rest of Middle East and Africa Glass Bottles and Containers Market Revenue (Million) Forecast, by Application 2019 & 2032
- Table 96: Rest of Middle East and Africa Glass Bottles and Containers Market Volume (Trillion) Forecast, by Application 2019 & 2032
- Table 97: Global Glass Bottles and Containers Market Revenue Million Forecast, by End-user Vertical 2019 & 2032
- Table 98: Global Glass Bottles and Containers Market Volume Trillion Forecast, by End-user Vertical 2019 & 2032
- Table 99: Global Glass Bottles and Containers Market Revenue Million Forecast, by Country 2019 & 2032
- Table 100: Global Glass Bottles and Containers Market Volume Trillion Forecast, by Country 2019 & 2032
- Table 101: United States Glass Bottles and Containers Market Revenue (Million) Forecast, by Application 2019 & 2032
- Table 102: United States Glass Bottles and Containers Market Volume (Trillion) Forecast, by Application 2019 & 2032
- Table 103: Canada Glass Bottles and Containers Market Revenue (Million) Forecast, by Application 2019 & 2032
- Table 104: Canada Glass Bottles and Containers Market Volume (Trillion) Forecast, by Application 2019 & 2032
- Table 105: Global Glass Bottles and Containers Market Revenue Million Forecast, by End-user Vertical 2019 & 2032
- Table 106: Global Glass Bottles and Containers Market Volume Trillion Forecast, by End-user Vertical 2019 & 2032
- Table 107: Global Glass Bottles and Containers Market Revenue Million Forecast, by Country 2019 & 2032
- Table 108: Global Glass Bottles and Containers Market Volume Trillion Forecast, by Country 2019 & 2032
- Table 109: United Kingdom Glass Bottles and Containers Market Revenue (Million) Forecast, by Application 2019 & 2032
- Table 110: United Kingdom Glass Bottles and Containers Market Volume (Trillion) Forecast, by Application 2019 & 2032
- Table 111: Germany Glass Bottles and Containers Market Revenue (Million) Forecast, by Application 2019 & 2032
- Table 112: Germany Glass Bottles and Containers Market Volume (Trillion) Forecast, by Application 2019 & 2032
- Table 113: France Glass Bottles and Containers Market Revenue (Million) Forecast, by Application 2019 & 2032
- Table 114: France Glass Bottles and Containers Market Volume (Trillion) Forecast, by Application 2019 & 2032
- Table 115: Italy Glass Bottles and Containers Market Revenue (Million) Forecast, by Application 2019 & 2032
- Table 116: Italy Glass Bottles and Containers Market Volume (Trillion) Forecast, by Application 2019 & 2032
- Table 117: Spain Glass Bottles and Containers Market Revenue (Million) Forecast, by Application 2019 & 2032
- Table 118: Spain Glass Bottles and Containers Market Volume (Trillion) Forecast, by Application 2019 & 2032
- Table 119: Poland Glass Bottles and Containers Market Revenue (Million) Forecast, by Application 2019 & 2032
- Table 120: Poland Glass Bottles and Containers Market Volume (Trillion) Forecast, by Application 2019 & 2032
- Table 121: Russia Glass Bottles and Containers Market Revenue (Million) Forecast, by Application 2019 & 2032
- Table 122: Russia Glass Bottles and Containers Market Volume (Trillion) Forecast, by Application 2019 & 2032
- Table 123: Global Glass Bottles and Containers Market Revenue Million Forecast, by End-user Vertical 2019 & 2032
- Table 124: Global Glass Bottles and Containers Market Volume Trillion Forecast, by End-user Vertical 2019 & 2032
- Table 125: Global Glass Bottles and Containers Market Revenue Million Forecast, by Country 2019 & 2032
- Table 126: Global Glass Bottles and Containers Market Volume Trillion Forecast, by Country 2019 & 2032
- Table 127: China Glass Bottles and Containers Market Revenue (Million) Forecast, by Application 2019 & 2032
- Table 128: China Glass Bottles and Containers Market Volume (Trillion) Forecast, by Application 2019 & 2032
- Table 129: India Glass Bottles and Containers Market Revenue (Million) Forecast, by Application 2019 & 2032
- Table 130: India Glass Bottles and Containers Market Volume (Trillion) Forecast, by Application 2019 & 2032
- Table 131: Japan Glass Bottles and Containers Market Revenue (Million) Forecast, by Application 2019 & 2032
- Table 132: Japan Glass Bottles and Containers Market Volume (Trillion) Forecast, by Application 2019 & 2032
- Table 133: South Korea Glass Bottles and Containers Market Revenue (Million) Forecast, by Application 2019 & 2032
- Table 134: South Korea Glass Bottles and Containers Market Volume (Trillion) Forecast, by Application 2019 & 2032
- Table 135: Australia and New Zealand Glass Bottles and Containers Market Revenue (Million) Forecast, by Application 2019 & 2032
- Table 136: Australia and New Zealand Glass Bottles and Containers Market Volume (Trillion) Forecast, by Application 2019 & 2032
- Table 137: Global Glass Bottles and Containers Market Revenue Million Forecast, by End-user Vertical 2019 & 2032
- Table 138: Global Glass Bottles and Containers Market Volume Trillion Forecast, by End-user Vertical 2019 & 2032
- Table 139: Global Glass Bottles and Containers Market Revenue Million Forecast, by Country 2019 & 2032
- Table 140: Global Glass Bottles and Containers Market Volume Trillion Forecast, by Country 2019 & 2032
- Table 141: United Arab Emirates Glass Bottles and Containers Market Revenue (Million) Forecast, by Application 2019 & 2032
- Table 142: United Arab Emirates Glass Bottles and Containers Market Volume (Trillion) Forecast, by Application 2019 & 2032
- Table 143: Saudi Arabia Glass Bottles and Containers Market Revenue (Million) Forecast, by Application 2019 & 2032
- Table 144: Saudi Arabia Glass Bottles and Containers Market Volume (Trillion) Forecast, by Application 2019 & 2032
- Table 145: South Africa Glass Bottles and Containers Market Revenue (Million) Forecast, by Application 2019 & 2032
- Table 146: South Africa Glass Bottles and Containers Market Volume (Trillion) Forecast, by Application 2019 & 2032
- Table 147: Global Glass Bottles and Containers Market Revenue Million Forecast, by End-user Vertical 2019 & 2032
- Table 148: Global Glass Bottles and Containers Market Volume Trillion Forecast, by End-user Vertical 2019 & 2032
- Table 149: Global Glass Bottles and Containers Market Revenue Million Forecast, by Country 2019 & 2032
- Table 150: Global Glass Bottles and Containers Market Volume Trillion Forecast, by Country 2019 & 2032
- Table 151: Brazil Glass Bottles and Containers Market Revenue (Million) Forecast, by Application 2019 & 2032
- Table 152: Brazil Glass Bottles and Containers Market Volume (Trillion) Forecast, by Application 2019 & 2032
- Table 153: Mexico Glass Bottles and Containers Market Revenue (Million) Forecast, by Application 2019 & 2032
- Table 154: Mexico Glass Bottles and Containers Market Volume (Trillion) Forecast, by Application 2019 & 2032
- Table 155: Argentina Glass Bottles and Containers Market Revenue (Million) Forecast, by Application 2019 & 2032
- Table 156: Argentina Glass Bottles and Containers Market Volume (Trillion) Forecast, by Application 2019 & 2032
Frequently Asked Questions
1. What is the projected Compound Annual Growth Rate (CAGR) of the Glass Bottles and Containers Market?
The projected CAGR is approximately 4.33%.
2. Which companies are prominent players in the Glass Bottles and Containers Market?
Key companies in the market include Saver Glass SAS (The Carlyle Group Inc, Middle East Glass Manufacturing Co SAE, Beatson Clark, Schott AG, Wiegand-glas GmbH, Stoelzle Oberglas GmbH (CAG-holding GmbH), O-I Glass Inc, PGP Glass Private Limited, Vitro SAB de CV, Verallia Packaging, Berlin Packaging LLC, Gaasch Packaging, Vidrala SA, Glassworks International Limited, Ardagh Group S A, BA VIDRO SA (BA Glass BV), SGD SA (SGD Pharma), Vetropack Holding Ltd, VERESCENCE FRANCE, Gerresheimer AG.
3. What are the main segments of the Glass Bottles and Containers Market?
The market segments include End-user Vertical.
4. Can you provide details about the market size?
The market size is estimated to be USD XX Million as of 2022.
5. What are some drivers contributing to market growth?
Growing Demand from Food and Beverage Industry; Sustainability and Recyclability Initiatives Moving Packagers and Consumer Brands to Glass Packaging.
6. What are the notable trends driving market growth?
Wine and Spirits to Lead the Non-alcoholic Beverages Segment.
7. Are there any restraints impacting market growth?
High Carbon Footprint due to Glass Manufacturing; Operation and Logistical Concerns.
8. Can you provide examples of recent developments in the market?
August 2023: O-I Glass, a prominent manufacturer of glass packaging for the food and beverage industry, introduced its innovative "Cento per Cento Sicily" bottles. These bottles showcase a distinct circular economy concept through a custom bottom logo. The entire production of these bottles takes place at O-I's facility in Marsala, Italy. Crafted from a minimum of 90% recycled glass, locally sourced from Sicily, these containers are not only eco-friendly but also remarkably lightweight, weighing a mere 410 grams. This design ensures optimal energy efficiency during the manufacturing process.
9. What pricing options are available for accessing the report?
Pricing options include single-user, multi-user, and enterprise licenses priced at USD 4750, USD 5250, and USD 8750 respectively.
10. Is the market size provided in terms of value or volume?
The market size is provided in terms of value, measured in Million and volume, measured in Trillion.
11. Are there any specific market keywords associated with the report?
Yes, the market keyword associated with the report is "Glass Bottles and Containers Market," which aids in identifying and referencing the specific market segment covered.
12. How do I determine which pricing option suits my needs best?
The pricing options vary based on user requirements and access needs. Individual users may opt for single-user licenses, while businesses requiring broader access may choose multi-user or enterprise licenses for cost-effective access to the report.
13. Are there any additional resources or data provided in the Glass Bottles and Containers Market report?
While the report offers comprehensive insights, it's advisable to review the specific contents or supplementary materials provided to ascertain if additional resources or data are available.
14. How can I stay updated on further developments or reports in the Glass Bottles and Containers Market?
To stay informed about further developments, trends, and reports in the Glass Bottles and Containers Market, consider subscribing to industry newsletters, following relevant companies and organizations, or regularly checking reputable industry news sources and publications.
Methodology
Step 1 - Identification of Relevant Samples Size from Population Database


Step 2 - Approaches for Defining Global Market Size (Value, Volume* & Price*)

Note*: In applicable scenarios
Step 3 - Data Sources
Primary Research
- Web Analytics
- Survey Reports
- Research Institute
- Latest Research Reports
- Opinion Leaders
Secondary Research
- Annual Reports
- White Paper
- Latest Press Release
- Industry Association
- Paid Database
- Investor Presentations

Step 4 - Data Triangulation
Involves using different sources of information in order to increase the validity of a study
These sources are likely to be stakeholders in a program - participants, other researchers, program staff, other community members, and so on.
Then we put all data in single framework & apply various statistical tools to find out the dynamic on the market.
During the analysis stage, feedback from the stakeholder groups would be compared to determine areas of agreement as well as areas of divergence
