

Key Insights
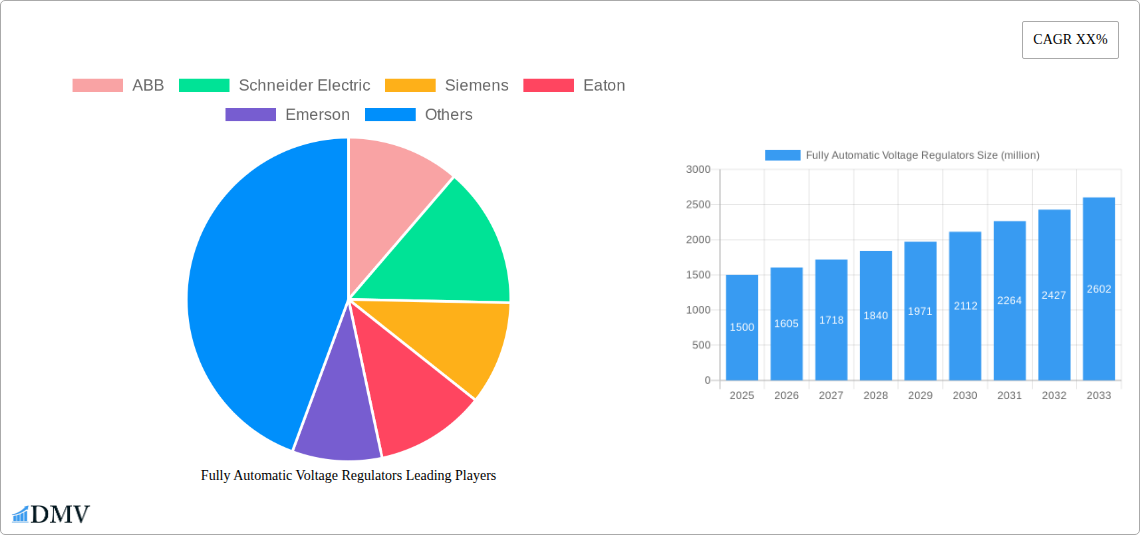
The global market for Fully Automatic Voltage Regulators (FAVR) is experiencing robust growth, driven by increasing demand for stable power supply across diverse sectors. The market, estimated at $1.5 billion in 2025, is projected to witness a Compound Annual Growth Rate (CAGR) of 7% from 2025 to 2033, reaching approximately $2.7 billion by 2033. This growth is fueled by several key factors. The expanding industrial automation sector necessitates reliable power solutions, fostering high demand for FAVRs. Furthermore, the rising adoption of renewable energy sources, while offering sustainability benefits, often introduces voltage fluctuations, necessitating the use of FAVRs for efficient energy management and equipment protection. Growth in data centers and the expanding need for uninterrupted power supply in critical infrastructure are additional drivers. Key players such as ABB, Schneider Electric, Siemens, and Eaton are actively investing in research and development to enhance FAVR technology, introducing advanced features like improved efficiency, enhanced monitoring capabilities, and integration with smart grids.
However, certain restraints exist. High initial investment costs for FAVR systems can hinder adoption, particularly in smaller businesses or developing regions. Furthermore, the availability of skilled technicians for installation and maintenance can pose a challenge. Despite these constraints, the overall market outlook remains positive, driven by the long-term need for reliable power solutions across various industries. Market segmentation reveals significant growth in industrial and commercial applications, with the North American and European markets currently holding the largest shares, followed by the Asia-Pacific region exhibiting high growth potential due to rapid industrialization and infrastructure development. The competitive landscape is characterized by the presence of established players alongside emerging technology providers, leading to increased innovation and competitive pricing.
Fully Automatic Voltage Regulators Market Report: 2019-2033
This comprehensive report provides an in-depth analysis of the global Fully Automatic Voltage Regulators (FAVR) market, offering invaluable insights for stakeholders seeking to understand market dynamics, growth opportunities, and competitive landscapes. The study period spans from 2019 to 2033, with 2025 serving as both the base and estimated year. The forecast period covers 2025-2033, and the historical period encompasses 2019-2024. The market size is valued in millions of USD.
Fully Automatic Voltage Regulators Market Composition & Trends
This section meticulously evaluates the FAVR market's structure, examining concentration levels, innovation drivers, regulatory frameworks, substitute product competition, end-user profiles, and merger & acquisition (M&A) activities. The market is characterized by a moderate level of concentration, with key players such as ABB, Schneider Electric, and Siemens holding significant market shares. However, the emergence of smaller, specialized players is increasing competition. The report details the market share distribution among these key players, revealing that ABB holds an estimated xx% market share in 2025, followed by Schneider Electric at xx% and Siemens at xx%. M&A activity in the sector has been moderately active during the historical period, with a total deal value of approximately $xx million. Significant innovation is driven by the need for improved efficiency, enhanced reliability, and integration with smart grids. Stringent regulatory requirements regarding power quality and grid stability are shaping market growth. The primary end-users include industrial facilities, commercial buildings, and utility companies. The report further analyzes the impact of substitute technologies and emerging trends on market dynamics.
- Market Concentration: Moderate, with a few major players dominating.
- Innovation Catalysts: Demand for improved efficiency, reliability, and smart grid integration.
- Regulatory Landscape: Stringent power quality and grid stability standards.
- Substitute Products: Analysis of alternative voltage regulation technologies and their market impact.
- End-User Profiles: Detailed segmentation by industry and application.
- M&A Activities: Review of recent mergers and acquisitions, including deal values (approximately $xx million during the historical period).
Fully Automatic Voltage Regulators Industry Evolution
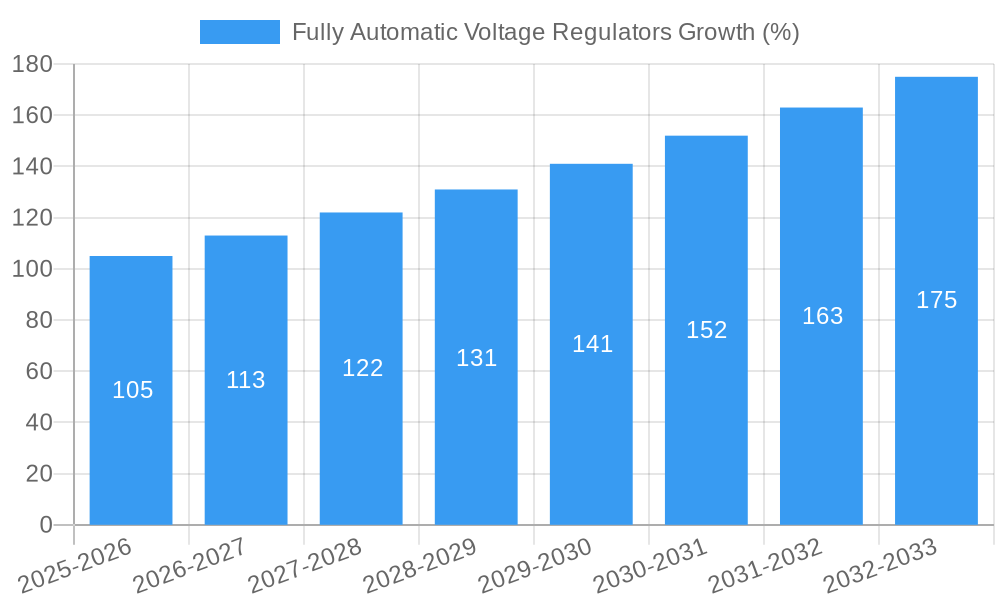
This section delves into the evolutionary trajectory of the FAVR market, exploring market growth trajectories, technological advancements, and evolving consumer demands over the period from 2019 to 2033. The market witnessed a Compound Annual Growth Rate (CAGR) of approximately xx% during the historical period (2019-2024). This growth is projected to continue, albeit at a slightly moderated pace, during the forecast period (2025-2033), with a projected CAGR of xx%. Key technological advancements driving market growth include the development of more efficient power electronics, the integration of advanced control algorithms, and the incorporation of digital communication capabilities. These advancements have resulted in improved performance, enhanced reliability, and reduced operational costs. The increasing demand for reliable and efficient power supply in various sectors, coupled with stricter environmental regulations, further fuels market expansion. Adoption of FAVRs is expected to reach xx million units globally by 2033, driven mainly by the industrial sector.
Leading Regions, Countries, or Segments in Fully Automatic Voltage Regulators
This section identifies the dominant regions and segments within the global FAVR market. North America currently holds the largest market share, primarily driven by robust industrial activity and stringent regulatory requirements. However, Asia-Pacific is expected to witness the fastest growth during the forecast period, fueled by substantial infrastructure development and rapid industrialization.
- North America: High market share driven by strong industrial activity and regulatory support.
- Asia-Pacific: Fastest-growing region, fueled by infrastructure development and industrialization.
- Europe: Mature market with steady growth, driven by upgrades and replacements.
- Key Drivers: Increased investment in renewable energy infrastructure, government initiatives promoting energy efficiency, and stringent regulations related to power quality.
Fully Automatic Voltage Regulators Product Innovations
Recent product innovations in FAVRs have focused on improving efficiency, enhancing reliability, and reducing energy losses. The integration of advanced control algorithms, digital communication capabilities and the use of new materials have led to significant advancements. These innovations offer unique selling propositions such as improved accuracy, faster response times, and enhanced remote monitoring capabilities. The market is also witnessing a shift towards smaller, more compact designs and the incorporation of smart grid technologies for better integration with renewable energy sources.
Propelling Factors for Fully Automatic Voltage Regulators Growth
Several factors contribute to the growth of the FAVR market. Technological advancements, such as the development of more efficient power electronics and advanced control algorithms, significantly improve performance and reduce costs. Stringent government regulations promoting energy efficiency and reliable power supply act as a major driver. Furthermore, the increasing demand for reliable power in various sectors, including industrial, commercial, and residential, pushes market growth. The rising adoption of renewable energy sources also necessitates the use of advanced voltage regulators for effective grid integration.
Obstacles in the Fully Automatic Voltage Regulators Market
The FAVR market faces challenges such as the high initial investment costs associated with implementing these systems. Supply chain disruptions and fluctuations in raw material prices can also impact profitability. Intense competition from existing players and the emergence of new technologies pose significant challenges. Furthermore, regulatory complexities and evolving standards necessitate continuous product adaptation. These factors could potentially hinder market growth if not properly addressed.
Future Opportunities in Fully Automatic Voltage Regulators
The FAVR market presents promising opportunities, particularly in emerging economies experiencing rapid industrialization and infrastructure development. The increasing integration of renewable energy sources opens up new avenues for growth. Further advancements in power electronics, smart grid technologies, and the development of more efficient and cost-effective FAVRs will unlock new market segments and drive future demand. The development of intelligent and adaptive voltage regulators for smart grids presents a significant opportunity.
Major Players in the Fully Automatic Voltage Regulators Ecosystem
- ABB
- Schneider Electric
- Siemens
- Eaton
- Emerson
- GE
- Watford Control
- Elsis
- Statron
- Ashley Edison
- Analog Devices
- Renesas Electronics
Key Developments in Fully Automatic Voltage Regulators Industry
- 2022 Q4: ABB launched a new line of high-efficiency FAVRs, incorporating advanced power electronics.
- 2023 Q1: Schneider Electric acquired a smaller FAVR manufacturer, expanding its market reach.
- 2023 Q3: Siemens introduced a smart grid-compatible FAVR model with enhanced monitoring capabilities. (Further significant developments will be detailed within the full report)
Strategic Fully Automatic Voltage Regulators Market Forecast
The FAVR market is poised for continued growth, driven by technological advancements, increasing demand for reliable power, and government initiatives promoting energy efficiency. The adoption of smart grid technologies and integration with renewable energy sources will play a crucial role in shaping future market dynamics. The market is projected to reach a value of $xx million by 2033, demonstrating significant growth potential. Continued innovation and strategic partnerships will be key factors for success in this rapidly evolving market.
Fully Automatic Voltage Regulators Segmentation
-
1. Application
- 1.1. Automotive
- 1.2. Electronic
- 1.3. Industrial
- 1.4. Other
-
2. Types
- 2.1. Single Phase Automatic Voltage Regulator
- 2.2. 3 Phase Automatic Voltage Regulator
Fully Automatic Voltage Regulators Segmentation By Geography
-
1. North America
- 1.1. United States
- 1.2. Canada
- 1.3. Mexico
-
2. South America
- 2.1. Brazil
- 2.2. Argentina
- 2.3. Rest of South America
-
3. Europe
- 3.1. United Kingdom
- 3.2. Germany
- 3.3. France
- 3.4. Italy
- 3.5. Spain
- 3.6. Russia
- 3.7. Benelux
- 3.8. Nordics
- 3.9. Rest of Europe
-
4. Middle East & Africa
- 4.1. Turkey
- 4.2. Israel
- 4.3. GCC
- 4.4. North Africa
- 4.5. South Africa
- 4.6. Rest of Middle East & Africa
-
5. Asia Pacific
- 5.1. China
- 5.2. India
- 5.3. Japan
- 5.4. South Korea
- 5.5. ASEAN
- 5.6. Oceania
- 5.7. Rest of Asia Pacific

Fully Automatic Voltage Regulators REPORT HIGHLIGHTS
| Aspects | Details |
|---|---|
| Study Period | 2019-2033 |
| Base Year | 2024 |
| Estimated Year | 2025 |
| Forecast Period | 2025-2033 |
| Historical Period | 2019-2024 |
| Growth Rate | CAGR of XX% from 2019-2033 |
| Segmentation |
|
Table of Contents
- 1. Introduction
- 1.1. Research Scope
- 1.2. Market Segmentation
- 1.3. Research Methodology
- 1.4. Definitions and Assumptions
- 2. Executive Summary
- 2.1. Introduction
- 3. Market Dynamics
- 3.1. Introduction
- 3.2. Market Drivers
- 3.3. Market Restrains
- 3.4. Market Trends
- 4. Market Factor Analysis
- 4.1. Porters Five Forces
- 4.2. Supply/Value Chain
- 4.3. PESTEL analysis
- 4.4. Market Entropy
- 4.5. Patent/Trademark Analysis
- 5. Global Fully Automatic Voltage Regulators Analysis, Insights and Forecast, 2019-2031
- 5.1. Market Analysis, Insights and Forecast - by Application
- 5.1.1. Automotive
- 5.1.2. Electronic
- 5.1.3. Industrial
- 5.1.4. Other
- 5.2. Market Analysis, Insights and Forecast - by Types
- 5.2.1. Single Phase Automatic Voltage Regulator
- 5.2.2. 3 Phase Automatic Voltage Regulator
- 5.3. Market Analysis, Insights and Forecast - by Region
- 5.3.1. North America
- 5.3.2. South America
- 5.3.3. Europe
- 5.3.4. Middle East & Africa
- 5.3.5. Asia Pacific
- 5.1. Market Analysis, Insights and Forecast - by Application
- 6. North America Fully Automatic Voltage Regulators Analysis, Insights and Forecast, 2019-2031
- 6.1. Market Analysis, Insights and Forecast - by Application
- 6.1.1. Automotive
- 6.1.2. Electronic
- 6.1.3. Industrial
- 6.1.4. Other
- 6.2. Market Analysis, Insights and Forecast - by Types
- 6.2.1. Single Phase Automatic Voltage Regulator
- 6.2.2. 3 Phase Automatic Voltage Regulator
- 6.1. Market Analysis, Insights and Forecast - by Application
- 7. South America Fully Automatic Voltage Regulators Analysis, Insights and Forecast, 2019-2031
- 7.1. Market Analysis, Insights and Forecast - by Application
- 7.1.1. Automotive
- 7.1.2. Electronic
- 7.1.3. Industrial
- 7.1.4. Other
- 7.2. Market Analysis, Insights and Forecast - by Types
- 7.2.1. Single Phase Automatic Voltage Regulator
- 7.2.2. 3 Phase Automatic Voltage Regulator
- 7.1. Market Analysis, Insights and Forecast - by Application
- 8. Europe Fully Automatic Voltage Regulators Analysis, Insights and Forecast, 2019-2031
- 8.1. Market Analysis, Insights and Forecast - by Application
- 8.1.1. Automotive
- 8.1.2. Electronic
- 8.1.3. Industrial
- 8.1.4. Other
- 8.2. Market Analysis, Insights and Forecast - by Types
- 8.2.1. Single Phase Automatic Voltage Regulator
- 8.2.2. 3 Phase Automatic Voltage Regulator
- 8.1. Market Analysis, Insights and Forecast - by Application
- 9. Middle East & Africa Fully Automatic Voltage Regulators Analysis, Insights and Forecast, 2019-2031
- 9.1. Market Analysis, Insights and Forecast - by Application
- 9.1.1. Automotive
- 9.1.2. Electronic
- 9.1.3. Industrial
- 9.1.4. Other
- 9.2. Market Analysis, Insights and Forecast - by Types
- 9.2.1. Single Phase Automatic Voltage Regulator
- 9.2.2. 3 Phase Automatic Voltage Regulator
- 9.1. Market Analysis, Insights and Forecast - by Application
- 10. Asia Pacific Fully Automatic Voltage Regulators Analysis, Insights and Forecast, 2019-2031
- 10.1. Market Analysis, Insights and Forecast - by Application
- 10.1.1. Automotive
- 10.1.2. Electronic
- 10.1.3. Industrial
- 10.1.4. Other
- 10.2. Market Analysis, Insights and Forecast - by Types
- 10.2.1. Single Phase Automatic Voltage Regulator
- 10.2.2. 3 Phase Automatic Voltage Regulator
- 10.1. Market Analysis, Insights and Forecast - by Application
- 11. Competitive Analysis
- 11.1. Global Market Share Analysis 2024
- 11.2. Company Profiles
- 11.2.1 ABB
- 11.2.1.1. Overview
- 11.2.1.2. Products
- 11.2.1.3. SWOT Analysis
- 11.2.1.4. Recent Developments
- 11.2.1.5. Financials (Based on Availability)
- 11.2.2 Schneider Electric
- 11.2.2.1. Overview
- 11.2.2.2. Products
- 11.2.2.3. SWOT Analysis
- 11.2.2.4. Recent Developments
- 11.2.2.5. Financials (Based on Availability)
- 11.2.3 Siemens
- 11.2.3.1. Overview
- 11.2.3.2. Products
- 11.2.3.3. SWOT Analysis
- 11.2.3.4. Recent Developments
- 11.2.3.5. Financials (Based on Availability)
- 11.2.4 Eaton
- 11.2.4.1. Overview
- 11.2.4.2. Products
- 11.2.4.3. SWOT Analysis
- 11.2.4.4. Recent Developments
- 11.2.4.5. Financials (Based on Availability)
- 11.2.5 Emerson
- 11.2.5.1. Overview
- 11.2.5.2. Products
- 11.2.5.3. SWOT Analysis
- 11.2.5.4. Recent Developments
- 11.2.5.5. Financials (Based on Availability)
- 11.2.6 GE
- 11.2.6.1. Overview
- 11.2.6.2. Products
- 11.2.6.3. SWOT Analysis
- 11.2.6.4. Recent Developments
- 11.2.6.5. Financials (Based on Availability)
- 11.2.7 Watford Control
- 11.2.7.1. Overview
- 11.2.7.2. Products
- 11.2.7.3. SWOT Analysis
- 11.2.7.4. Recent Developments
- 11.2.7.5. Financials (Based on Availability)
- 11.2.8 Elsis
- 11.2.8.1. Overview
- 11.2.8.2. Products
- 11.2.8.3. SWOT Analysis
- 11.2.8.4. Recent Developments
- 11.2.8.5. Financials (Based on Availability)
- 11.2.9 Statron
- 11.2.9.1. Overview
- 11.2.9.2. Products
- 11.2.9.3. SWOT Analysis
- 11.2.9.4. Recent Developments
- 11.2.9.5. Financials (Based on Availability)
- 11.2.10 Ashley Edison
- 11.2.10.1. Overview
- 11.2.10.2. Products
- 11.2.10.3. SWOT Analysis
- 11.2.10.4. Recent Developments
- 11.2.10.5. Financials (Based on Availability)
- 11.2.11 Analog Devices
- 11.2.11.1. Overview
- 11.2.11.2. Products
- 11.2.11.3. SWOT Analysis
- 11.2.11.4. Recent Developments
- 11.2.11.5. Financials (Based on Availability)
- 11.2.12 Renesas Electronics
- 11.2.12.1. Overview
- 11.2.12.2. Products
- 11.2.12.3. SWOT Analysis
- 11.2.12.4. Recent Developments
- 11.2.12.5. Financials (Based on Availability)
- 11.2.1 ABB
List of Figures
- Figure 1: Global Fully Automatic Voltage Regulators Revenue Breakdown (million, %) by Region 2024 & 2032
- Figure 2: North America Fully Automatic Voltage Regulators Revenue (million), by Application 2024 & 2032
- Figure 3: North America Fully Automatic Voltage Regulators Revenue Share (%), by Application 2024 & 2032
- Figure 4: North America Fully Automatic Voltage Regulators Revenue (million), by Types 2024 & 2032
- Figure 5: North America Fully Automatic Voltage Regulators Revenue Share (%), by Types 2024 & 2032
- Figure 6: North America Fully Automatic Voltage Regulators Revenue (million), by Country 2024 & 2032
- Figure 7: North America Fully Automatic Voltage Regulators Revenue Share (%), by Country 2024 & 2032
- Figure 8: South America Fully Automatic Voltage Regulators Revenue (million), by Application 2024 & 2032
- Figure 9: South America Fully Automatic Voltage Regulators Revenue Share (%), by Application 2024 & 2032
- Figure 10: South America Fully Automatic Voltage Regulators Revenue (million), by Types 2024 & 2032
- Figure 11: South America Fully Automatic Voltage Regulators Revenue Share (%), by Types 2024 & 2032
- Figure 12: South America Fully Automatic Voltage Regulators Revenue (million), by Country 2024 & 2032
- Figure 13: South America Fully Automatic Voltage Regulators Revenue Share (%), by Country 2024 & 2032
- Figure 14: Europe Fully Automatic Voltage Regulators Revenue (million), by Application 2024 & 2032
- Figure 15: Europe Fully Automatic Voltage Regulators Revenue Share (%), by Application 2024 & 2032
- Figure 16: Europe Fully Automatic Voltage Regulators Revenue (million), by Types 2024 & 2032
- Figure 17: Europe Fully Automatic Voltage Regulators Revenue Share (%), by Types 2024 & 2032
- Figure 18: Europe Fully Automatic Voltage Regulators Revenue (million), by Country 2024 & 2032
- Figure 19: Europe Fully Automatic Voltage Regulators Revenue Share (%), by Country 2024 & 2032
- Figure 20: Middle East & Africa Fully Automatic Voltage Regulators Revenue (million), by Application 2024 & 2032
- Figure 21: Middle East & Africa Fully Automatic Voltage Regulators Revenue Share (%), by Application 2024 & 2032
- Figure 22: Middle East & Africa Fully Automatic Voltage Regulators Revenue (million), by Types 2024 & 2032
- Figure 23: Middle East & Africa Fully Automatic Voltage Regulators Revenue Share (%), by Types 2024 & 2032
- Figure 24: Middle East & Africa Fully Automatic Voltage Regulators Revenue (million), by Country 2024 & 2032
- Figure 25: Middle East & Africa Fully Automatic Voltage Regulators Revenue Share (%), by Country 2024 & 2032
- Figure 26: Asia Pacific Fully Automatic Voltage Regulators Revenue (million), by Application 2024 & 2032
- Figure 27: Asia Pacific Fully Automatic Voltage Regulators Revenue Share (%), by Application 2024 & 2032
- Figure 28: Asia Pacific Fully Automatic Voltage Regulators Revenue (million), by Types 2024 & 2032
- Figure 29: Asia Pacific Fully Automatic Voltage Regulators Revenue Share (%), by Types 2024 & 2032
- Figure 30: Asia Pacific Fully Automatic Voltage Regulators Revenue (million), by Country 2024 & 2032
- Figure 31: Asia Pacific Fully Automatic Voltage Regulators Revenue Share (%), by Country 2024 & 2032
List of Tables
- Table 1: Global Fully Automatic Voltage Regulators Revenue million Forecast, by Region 2019 & 2032
- Table 2: Global Fully Automatic Voltage Regulators Revenue million Forecast, by Application 2019 & 2032
- Table 3: Global Fully Automatic Voltage Regulators Revenue million Forecast, by Types 2019 & 2032
- Table 4: Global Fully Automatic Voltage Regulators Revenue million Forecast, by Region 2019 & 2032
- Table 5: Global Fully Automatic Voltage Regulators Revenue million Forecast, by Application 2019 & 2032
- Table 6: Global Fully Automatic Voltage Regulators Revenue million Forecast, by Types 2019 & 2032
- Table 7: Global Fully Automatic Voltage Regulators Revenue million Forecast, by Country 2019 & 2032
- Table 8: United States Fully Automatic Voltage Regulators Revenue (million) Forecast, by Application 2019 & 2032
- Table 9: Canada Fully Automatic Voltage Regulators Revenue (million) Forecast, by Application 2019 & 2032
- Table 10: Mexico Fully Automatic Voltage Regulators Revenue (million) Forecast, by Application 2019 & 2032
- Table 11: Global Fully Automatic Voltage Regulators Revenue million Forecast, by Application 2019 & 2032
- Table 12: Global Fully Automatic Voltage Regulators Revenue million Forecast, by Types 2019 & 2032
- Table 13: Global Fully Automatic Voltage Regulators Revenue million Forecast, by Country 2019 & 2032
- Table 14: Brazil Fully Automatic Voltage Regulators Revenue (million) Forecast, by Application 2019 & 2032
- Table 15: Argentina Fully Automatic Voltage Regulators Revenue (million) Forecast, by Application 2019 & 2032
- Table 16: Rest of South America Fully Automatic Voltage Regulators Revenue (million) Forecast, by Application 2019 & 2032
- Table 17: Global Fully Automatic Voltage Regulators Revenue million Forecast, by Application 2019 & 2032
- Table 18: Global Fully Automatic Voltage Regulators Revenue million Forecast, by Types 2019 & 2032
- Table 19: Global Fully Automatic Voltage Regulators Revenue million Forecast, by Country 2019 & 2032
- Table 20: United Kingdom Fully Automatic Voltage Regulators Revenue (million) Forecast, by Application 2019 & 2032
- Table 21: Germany Fully Automatic Voltage Regulators Revenue (million) Forecast, by Application 2019 & 2032
- Table 22: France Fully Automatic Voltage Regulators Revenue (million) Forecast, by Application 2019 & 2032
- Table 23: Italy Fully Automatic Voltage Regulators Revenue (million) Forecast, by Application 2019 & 2032
- Table 24: Spain Fully Automatic Voltage Regulators Revenue (million) Forecast, by Application 2019 & 2032
- Table 25: Russia Fully Automatic Voltage Regulators Revenue (million) Forecast, by Application 2019 & 2032
- Table 26: Benelux Fully Automatic Voltage Regulators Revenue (million) Forecast, by Application 2019 & 2032
- Table 27: Nordics Fully Automatic Voltage Regulators Revenue (million) Forecast, by Application 2019 & 2032
- Table 28: Rest of Europe Fully Automatic Voltage Regulators Revenue (million) Forecast, by Application 2019 & 2032
- Table 29: Global Fully Automatic Voltage Regulators Revenue million Forecast, by Application 2019 & 2032
- Table 30: Global Fully Automatic Voltage Regulators Revenue million Forecast, by Types 2019 & 2032
- Table 31: Global Fully Automatic Voltage Regulators Revenue million Forecast, by Country 2019 & 2032
- Table 32: Turkey Fully Automatic Voltage Regulators Revenue (million) Forecast, by Application 2019 & 2032
- Table 33: Israel Fully Automatic Voltage Regulators Revenue (million) Forecast, by Application 2019 & 2032
- Table 34: GCC Fully Automatic Voltage Regulators Revenue (million) Forecast, by Application 2019 & 2032
- Table 35: North Africa Fully Automatic Voltage Regulators Revenue (million) Forecast, by Application 2019 & 2032
- Table 36: South Africa Fully Automatic Voltage Regulators Revenue (million) Forecast, by Application 2019 & 2032
- Table 37: Rest of Middle East & Africa Fully Automatic Voltage Regulators Revenue (million) Forecast, by Application 2019 & 2032
- Table 38: Global Fully Automatic Voltage Regulators Revenue million Forecast, by Application 2019 & 2032
- Table 39: Global Fully Automatic Voltage Regulators Revenue million Forecast, by Types 2019 & 2032
- Table 40: Global Fully Automatic Voltage Regulators Revenue million Forecast, by Country 2019 & 2032
- Table 41: China Fully Automatic Voltage Regulators Revenue (million) Forecast, by Application 2019 & 2032
- Table 42: India Fully Automatic Voltage Regulators Revenue (million) Forecast, by Application 2019 & 2032
- Table 43: Japan Fully Automatic Voltage Regulators Revenue (million) Forecast, by Application 2019 & 2032
- Table 44: South Korea Fully Automatic Voltage Regulators Revenue (million) Forecast, by Application 2019 & 2032
- Table 45: ASEAN Fully Automatic Voltage Regulators Revenue (million) Forecast, by Application 2019 & 2032
- Table 46: Oceania Fully Automatic Voltage Regulators Revenue (million) Forecast, by Application 2019 & 2032
- Table 47: Rest of Asia Pacific Fully Automatic Voltage Regulators Revenue (million) Forecast, by Application 2019 & 2032
Frequently Asked Questions
1. What is the projected Compound Annual Growth Rate (CAGR) of the Fully Automatic Voltage Regulators?
The projected CAGR is approximately XX%.
2. Which companies are prominent players in the Fully Automatic Voltage Regulators?
Key companies in the market include ABB, Schneider Electric, Siemens, Eaton, Emerson, GE, Watford Control, Elsis, Statron, Ashley Edison, Analog Devices, Renesas Electronics.
3. What are the main segments of the Fully Automatic Voltage Regulators?
The market segments include Application, Types.
4. Can you provide details about the market size?
The market size is estimated to be USD XXX million as of 2022.
5. What are some drivers contributing to market growth?
N/A
6. What are the notable trends driving market growth?
N/A
7. Are there any restraints impacting market growth?
N/A
8. Can you provide examples of recent developments in the market?
N/A
9. What pricing options are available for accessing the report?
Pricing options include single-user, multi-user, and enterprise licenses priced at USD 4900.00, USD 7350.00, and USD 9800.00 respectively.
10. Is the market size provided in terms of value or volume?
The market size is provided in terms of value, measured in million.
11. Are there any specific market keywords associated with the report?
Yes, the market keyword associated with the report is "Fully Automatic Voltage Regulators," which aids in identifying and referencing the specific market segment covered.
12. How do I determine which pricing option suits my needs best?
The pricing options vary based on user requirements and access needs. Individual users may opt for single-user licenses, while businesses requiring broader access may choose multi-user or enterprise licenses for cost-effective access to the report.
13. Are there any additional resources or data provided in the Fully Automatic Voltage Regulators report?
While the report offers comprehensive insights, it's advisable to review the specific contents or supplementary materials provided to ascertain if additional resources or data are available.
14. How can I stay updated on further developments or reports in the Fully Automatic Voltage Regulators?
To stay informed about further developments, trends, and reports in the Fully Automatic Voltage Regulators, consider subscribing to industry newsletters, following relevant companies and organizations, or regularly checking reputable industry news sources and publications.
Methodology
Step 1 - Identification of Relevant Samples Size from Population Database


Step 2 - Approaches for Defining Global Market Size (Value, Volume* & Price*)

Note*: In applicable scenarios
Step 3 - Data Sources
Primary Research
- Web Analytics
- Survey Reports
- Research Institute
- Latest Research Reports
- Opinion Leaders
Secondary Research
- Annual Reports
- White Paper
- Latest Press Release
- Industry Association
- Paid Database
- Investor Presentations

Step 4 - Data Triangulation
Involves using different sources of information in order to increase the validity of a study
These sources are likely to be stakeholders in a program - participants, other researchers, program staff, other community members, and so on.
Then we put all data in single framework & apply various statistical tools to find out the dynamic on the market.
During the analysis stage, feedback from the stakeholder groups would be compared to determine areas of agreement as well as areas of divergence
