

Key Insights
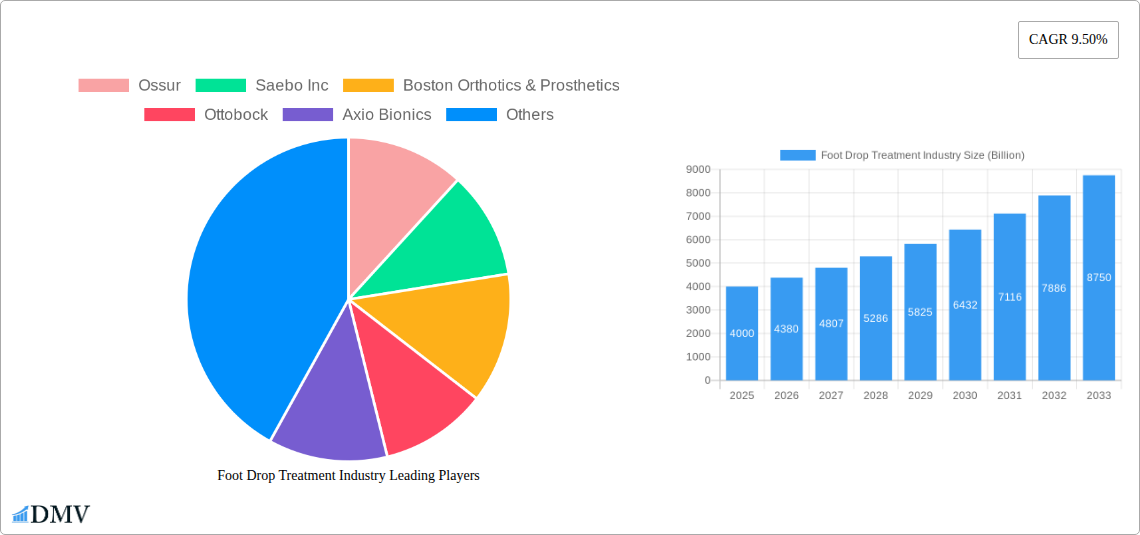
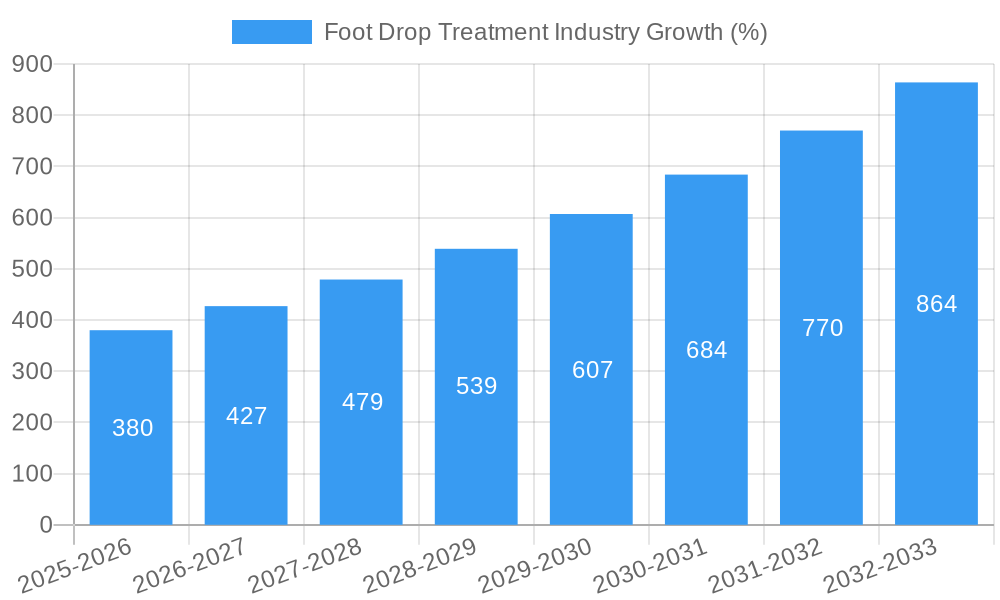
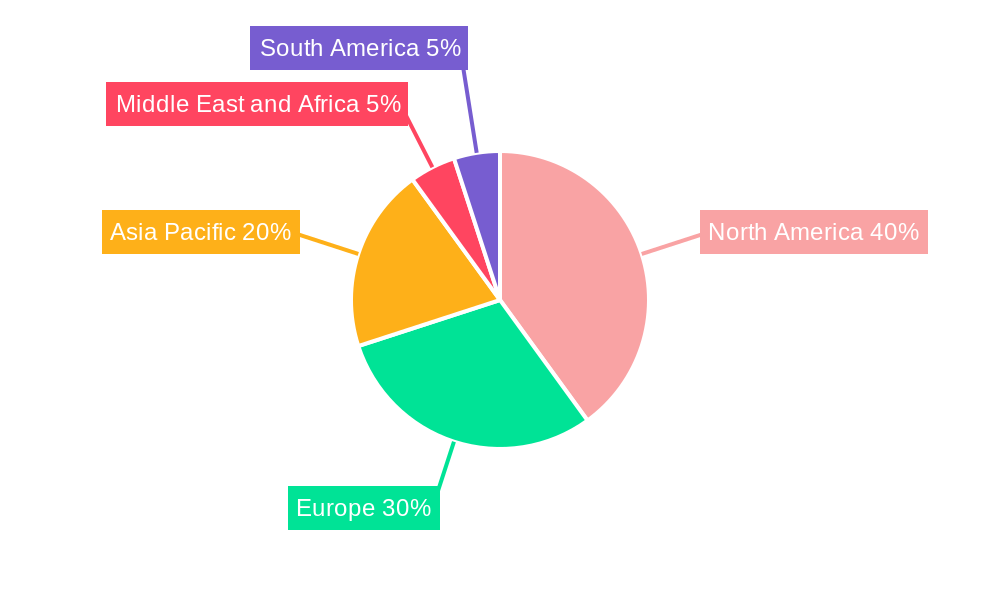
The global foot drop treatment market, valued at approximately $4 billion in 2025, is projected to experience robust growth, exhibiting a Compound Annual Growth Rate (CAGR) of 9.50% from 2025 to 2033. This expansion is driven by several key factors. The rising prevalence of neurological disorders like stroke, multiple sclerosis, and cerebral palsy, all leading causes of foot drop, significantly fuels market demand. Furthermore, an aging global population increases the incidence of these conditions, further bolstering market growth. Technological advancements in treatment modalities, such as the development of more sophisticated functional electrical stimulators (FES) and improved braces/splints offering enhanced comfort and functionality, are also contributing to market expansion. The increasing awareness about effective treatment options and the rising accessibility of advanced medical care in developing economies are also positive growth drivers. While the market faces certain restraints, such as high costs associated with advanced treatments and the potential for adverse effects from certain devices, the overall market outlook remains positive. The market is segmented by product type (functional electrical stimulators, braces/splints) and application (neuropathy, muscle disorders, brain & spinal disorders), with functional electrical stimulators expected to witness significant growth due to their effectiveness and technological advancements. North America currently holds a substantial market share, driven by high healthcare expenditure and technological advancements. However, Asia Pacific is poised for significant growth in the coming years due to the region's expanding healthcare infrastructure and increasing prevalence of neurological disorders.
The competitive landscape is characterized by the presence of both established players like Ossur, Ottobock, and Bioness Inc., and emerging companies specializing in innovative solutions. These companies are actively involved in research and development, focusing on improving existing products and introducing new technologies to cater to the growing demand. Strategic collaborations, mergers, and acquisitions are likely to shape the competitive dynamics in the coming years. The focus on minimally invasive procedures, telehealth integration for remote patient monitoring, and personalized treatment plans are emerging trends within the foot drop treatment market that are expected to significantly impact market growth and patient outcomes over the forecast period. The market is expected to witness continued expansion, driven by these factors, making it an attractive sector for investment and further innovation.
Foot Drop Treatment Industry: A Billion-Dollar Market Analysis (2019-2033)
This comprehensive report provides a detailed analysis of the global Foot Drop Treatment industry, projecting a market valuation exceeding $XX Billion by 2033. The study covers the period from 2019 to 2033, with 2025 as the base and estimated year. This in-depth analysis covers market trends, leading players, technological advancements, and future opportunities within this rapidly evolving sector.
Foot Drop Treatment Industry Market Composition & Trends
The Foot Drop Treatment market is characterized by a moderately concentrated landscape, with key players like Ossur, Saebo Inc, Boston Orthotics & Prosthetics, Ottobock, Axio Bionics, Thrive Orthopedics, Turbomed Orthotics, Accelerated Care Plus Corporation, Allard, and Bioness Inc. holding significant market share. However, the market also exhibits considerable room for new entrants due to ongoing innovation and unmet needs. Market share distribution currently leans towards established players with strong brand recognition and distribution networks, estimated at approximately 60% collectively in 2025. The remaining 40% is fragmented among smaller companies and niche players. M&A activity has been relatively moderate in recent years, with deal values averaging around $XX Billion annually, driven primarily by strategic acquisitions aimed at expanding product portfolios and geographical reach. Innovation catalysts include advancements in FES technology, biomaterials, and AI-driven diagnostics. The regulatory landscape varies across regions, impacting market access and product approvals. Substitute products, such as traditional bracing and physical therapy, continue to compete with newer technological solutions. End-users predominantly consist of hospitals, rehabilitation centers, and individual patients.
- Market Concentration: Moderately concentrated, with top players holding ~60% market share (2025).
- Innovation Catalysts: Advancements in FES, biomaterials, and AI-driven diagnostics.
- Regulatory Landscape: Variable across regions, influencing market access.
- Substitute Products: Traditional bracing and physical therapy.
- M&A Activity: Moderate, with average annual deal values of $XX Billion.
- End-Users: Hospitals, rehabilitation centers, and individual patients.
Foot Drop Treatment Industry Industry Evolution
The Foot Drop Treatment industry has witnessed significant growth over the historical period (2019-2024), driven by rising prevalence of neurological disorders and an aging population. The market experienced a Compound Annual Growth Rate (CAGR) of approximately XX% during this period. This growth is projected to continue during the forecast period (2025-2033), albeit at a slightly moderated pace, with a projected CAGR of XX%. Technological advancements, particularly in Functional Electrical Stimulation (FES) devices, have played a pivotal role in this evolution. The shift in consumer demand towards minimally invasive, comfortable, and effective treatment options is further propelling growth. Adoption rates for advanced FES devices are increasing steadily, with an estimated XX% of new foot drop patients opting for FES therapy in 2025. This reflects the growing awareness and acceptance of these technologies among healthcare professionals and patients alike. The increasing focus on personalized medicine and telehealth is also influencing market dynamics.
Leading Regions, Countries, or Segments in Foot Drop Treatment Industry
North America currently dominates the Foot Drop Treatment market, driven by factors such as high healthcare expenditure, advanced healthcare infrastructure, and a relatively high prevalence of neurological disorders.
- Key Drivers for North American Dominance:
- High healthcare expenditure.
- Advanced healthcare infrastructure.
- High prevalence of neurological disorders.
- Strong regulatory support for innovative medical devices.
- High adoption rates of advanced technologies.
Within product types, Functional Electrical Stimulators (FES) are experiencing the fastest growth, driven by their effectiveness and improved patient outcomes. Among applications, Neuropathy and Brain & Spinal Disorders represent the largest market segments, reflecting the substantial patient populations affected by these conditions.
Foot Drop Treatment Industry Product Innovations
Recent innovations include lightweight and comfortable FES devices with improved battery life and user-friendly interfaces. The development of smart sensors integrated into braces and splints for real-time monitoring and personalized feedback is another noteworthy advancement. These innovations aim to enhance patient compliance and improve therapeutic outcomes. Unique selling propositions include enhanced comfort, portability, and the integration of advanced technologies for better treatment efficacy.
Propelling Factors for Foot Drop Treatment Industry Growth
Several factors are driving the growth of the Foot Drop Treatment industry. Technological advancements, such as the development of more sophisticated FES devices and improved biomaterials for braces and splints, are significantly improving treatment outcomes and patient experience. The aging global population, resulting in an increased prevalence of neurological disorders, represents a large and growing market. Furthermore, favorable regulatory environments in many countries are facilitating the adoption of innovative treatment methods. Increased awareness and education about foot drop and its treatment options are also contributing to market growth.
Obstacles in the Foot Drop Treatment Industry Market
The Foot Drop Treatment market faces several obstacles, including the high cost of advanced FES devices, which limits accessibility for some patients. Supply chain disruptions can impact the availability of components and finished products. Furthermore, intense competition from established players and the emergence of new entrants create price pressures. Strict regulatory requirements and varying approval processes across different regions pose additional challenges for market entry and expansion.
Future Opportunities in Foot Drop Treatment Industry
Emerging opportunities include the development of AI-powered diagnostic tools for early detection of foot drop, the expansion of telehealth platforms for remote monitoring and treatment, and the penetration into emerging markets with high unmet needs. The integration of advanced materials and manufacturing techniques will improve product performance and reduce costs. Furthermore, personalized treatment plans based on individual patient needs will contribute to market growth.
Major Players in the Foot Drop Treatment Industry Ecosystem
- Ossur
- Saebo Inc
- Boston Orthotics & Prosthetics
- Ottobock
- Axio Bionics
- Thrive Orthopedics
- Turbomed Orthotics
- Accelerated Care Plus Corporation
- Allard
- Bioness Inc
Key Developments in Foot Drop Treatment Industry Industry
- August 2022: Development of a new electrode-integrated Velcro sleeve for FES therapy, targeting stroke, MS, and cerebral palsy patients (delivery expected in 2023).
- March 2022: USFDA approval of Cionic's Neural Sleeve for analyzing, predicting, and augmenting leg movements.
These developments significantly impact market dynamics by introducing innovative solutions and expanding the addressable market.
Strategic Foot Drop Treatment Industry Market Forecast
The Foot Drop Treatment market is poised for substantial growth over the forecast period (2025-2033), driven by continuous technological advancements, rising prevalence of neurological disorders, and favorable regulatory landscapes. The expanding adoption of FES devices and innovative bracing solutions, coupled with increased healthcare spending, presents significant opportunities for market players. The market's future growth hinges on continued innovation, improved accessibility, and the development of cost-effective solutions.
Foot Drop Treatment Industry Segmentation
-
1. Product Type
- 1.1. Functional Electrical Stimulator
- 1.2. Braces/Splints
-
2. Application
- 2.1. Neuropathy
- 2.2. Muscle Disorders
- 2.3. Brain & Spinal Disorders
Foot Drop Treatment Industry Segmentation By Geography
-
1. North America
- 1.1. United States
- 1.2. Canada
- 1.3. Mexico
-
2. Europe
- 2.1. Germany
- 2.2. United Kingdom
- 2.3. France
- 2.4. Italy
- 2.5. Spain
- 2.6. Rest of Europe
-
3. Asia Pacific
- 3.1. China
- 3.2. Japan
- 3.3. India
- 3.4. Australia
- 3.5. South Korea
- 3.6. Rest of Asia Pacific
-
4. Middle East and Africa
- 4.1. GCC
- 4.2. South Africa
- 4.3. Rest of Middle East and Africa
-
5. South America
- 5.1. Brazil
- 5.2. Argentina
- 5.3. Rest of South America
Foot Drop Treatment Industry REPORT HIGHLIGHTS
| Aspects | Details |
|---|---|
| Study Period | 2019-2033 |
| Base Year | 2024 |
| Estimated Year | 2025 |
| Forecast Period | 2025-2033 |
| Historical Period | 2019-2024 |
| Growth Rate | CAGR of 9.50% from 2019-2033 |
| Segmentation |
|
Table of Contents
- 1. Introduction
- 1.1. Research Scope
- 1.2. Market Segmentation
- 1.3. Research Methodology
- 1.4. Definitions and Assumptions
- 2. Executive Summary
- 2.1. Introduction
- 3. Market Dynamics
- 3.1. Introduction
- 3.2. Market Drivers
- 3.2.1. Growing Burden of Chronic Diseases; Advancements in Products
- 3.3. Market Restrains
- 3.3.1. High Cost of Functional Electrical Stimulators
- 3.4. Market Trends
- 3.4.1. Functional Electrical Stimulator Segment is Expected to Show a Significant Growth Rate in the Foot Drop Treatment Market
- 4. Market Factor Analysis
- 4.1. Porters Five Forces
- 4.2. Supply/Value Chain
- 4.3. PESTEL analysis
- 4.4. Market Entropy
- 4.5. Patent/Trademark Analysis
- 5. Global Foot Drop Treatment Industry Analysis, Insights and Forecast, 2019-2031
- 5.1. Market Analysis, Insights and Forecast - by Product Type
- 5.1.1. Functional Electrical Stimulator
- 5.1.2. Braces/Splints
- 5.2. Market Analysis, Insights and Forecast - by Application
- 5.2.1. Neuropathy
- 5.2.2. Muscle Disorders
- 5.2.3. Brain & Spinal Disorders
- 5.3. Market Analysis, Insights and Forecast - by Region
- 5.3.1. North America
- 5.3.2. Europe
- 5.3.3. Asia Pacific
- 5.3.4. Middle East and Africa
- 5.3.5. South America
- 5.1. Market Analysis, Insights and Forecast - by Product Type
- 6. North America Foot Drop Treatment Industry Analysis, Insights and Forecast, 2019-2031
- 6.1. Market Analysis, Insights and Forecast - by Product Type
- 6.1.1. Functional Electrical Stimulator
- 6.1.2. Braces/Splints
- 6.2. Market Analysis, Insights and Forecast - by Application
- 6.2.1. Neuropathy
- 6.2.2. Muscle Disorders
- 6.2.3. Brain & Spinal Disorders
- 6.1. Market Analysis, Insights and Forecast - by Product Type
- 7. Europe Foot Drop Treatment Industry Analysis, Insights and Forecast, 2019-2031
- 7.1. Market Analysis, Insights and Forecast - by Product Type
- 7.1.1. Functional Electrical Stimulator
- 7.1.2. Braces/Splints
- 7.2. Market Analysis, Insights and Forecast - by Application
- 7.2.1. Neuropathy
- 7.2.2. Muscle Disorders
- 7.2.3. Brain & Spinal Disorders
- 7.1. Market Analysis, Insights and Forecast - by Product Type
- 8. Asia Pacific Foot Drop Treatment Industry Analysis, Insights and Forecast, 2019-2031
- 8.1. Market Analysis, Insights and Forecast - by Product Type
- 8.1.1. Functional Electrical Stimulator
- 8.1.2. Braces/Splints
- 8.2. Market Analysis, Insights and Forecast - by Application
- 8.2.1. Neuropathy
- 8.2.2. Muscle Disorders
- 8.2.3. Brain & Spinal Disorders
- 8.1. Market Analysis, Insights and Forecast - by Product Type
- 9. Middle East and Africa Foot Drop Treatment Industry Analysis, Insights and Forecast, 2019-2031
- 9.1. Market Analysis, Insights and Forecast - by Product Type
- 9.1.1. Functional Electrical Stimulator
- 9.1.2. Braces/Splints
- 9.2. Market Analysis, Insights and Forecast - by Application
- 9.2.1. Neuropathy
- 9.2.2. Muscle Disorders
- 9.2.3. Brain & Spinal Disorders
- 9.1. Market Analysis, Insights and Forecast - by Product Type
- 10. South America Foot Drop Treatment Industry Analysis, Insights and Forecast, 2019-2031
- 10.1. Market Analysis, Insights and Forecast - by Product Type
- 10.1.1. Functional Electrical Stimulator
- 10.1.2. Braces/Splints
- 10.2. Market Analysis, Insights and Forecast - by Application
- 10.2.1. Neuropathy
- 10.2.2. Muscle Disorders
- 10.2.3. Brain & Spinal Disorders
- 10.1. Market Analysis, Insights and Forecast - by Product Type
- 11. North America Foot Drop Treatment Industry Analysis, Insights and Forecast, 2019-2031
- 11.1. Market Analysis, Insights and Forecast - By Country/Sub-region
- 11.1.1 United States
- 11.1.2 Canada
- 11.1.3 Mexico
- 12. Europe Foot Drop Treatment Industry Analysis, Insights and Forecast, 2019-2031
- 12.1. Market Analysis, Insights and Forecast - By Country/Sub-region
- 12.1.1 Germany
- 12.1.2 United Kingdom
- 12.1.3 France
- 12.1.4 Italy
- 12.1.5 Spain
- 12.1.6 Rest of Europe
- 13. Asia Pacific Foot Drop Treatment Industry Analysis, Insights and Forecast, 2019-2031
- 13.1. Market Analysis, Insights and Forecast - By Country/Sub-region
- 13.1.1 China
- 13.1.2 Japan
- 13.1.3 India
- 13.1.4 Australia
- 13.1.5 South Korea
- 13.1.6 Rest of Asia Pacific
- 14. Middle East and Africa Foot Drop Treatment Industry Analysis, Insights and Forecast, 2019-2031
- 14.1. Market Analysis, Insights and Forecast - By Country/Sub-region
- 14.1.1 GCC
- 14.1.2 South Africa
- 14.1.3 Rest of Middle East and Africa
- 15. South America Foot Drop Treatment Industry Analysis, Insights and Forecast, 2019-2031
- 15.1. Market Analysis, Insights and Forecast - By Country/Sub-region
- 15.1.1 Brazil
- 15.1.2 Argentina
- 15.1.3 Rest of South America
- 16. Competitive Analysis
- 16.1. Global Market Share Analysis 2024
- 16.2. Company Profiles
- 16.2.1 Ossur
- 16.2.1.1. Overview
- 16.2.1.2. Products
- 16.2.1.3. SWOT Analysis
- 16.2.1.4. Recent Developments
- 16.2.1.5. Financials (Based on Availability)
- 16.2.2 Saebo Inc
- 16.2.2.1. Overview
- 16.2.2.2. Products
- 16.2.2.3. SWOT Analysis
- 16.2.2.4. Recent Developments
- 16.2.2.5. Financials (Based on Availability)
- 16.2.3 Boston Orthotics & Prosthetics
- 16.2.3.1. Overview
- 16.2.3.2. Products
- 16.2.3.3. SWOT Analysis
- 16.2.3.4. Recent Developments
- 16.2.3.5. Financials (Based on Availability)
- 16.2.4 Ottobock
- 16.2.4.1. Overview
- 16.2.4.2. Products
- 16.2.4.3. SWOT Analysis
- 16.2.4.4. Recent Developments
- 16.2.4.5. Financials (Based on Availability)
- 16.2.5 Axio Bionics
- 16.2.5.1. Overview
- 16.2.5.2. Products
- 16.2.5.3. SWOT Analysis
- 16.2.5.4. Recent Developments
- 16.2.5.5. Financials (Based on Availability)
- 16.2.6 Thrive Orthopedics
- 16.2.6.1. Overview
- 16.2.6.2. Products
- 16.2.6.3. SWOT Analysis
- 16.2.6.4. Recent Developments
- 16.2.6.5. Financials (Based on Availability)
- 16.2.7 Turbomed Orthotics*List Not Exhaustive
- 16.2.7.1. Overview
- 16.2.7.2. Products
- 16.2.7.3. SWOT Analysis
- 16.2.7.4. Recent Developments
- 16.2.7.5. Financials (Based on Availability)
- 16.2.8 Accelerated Care Plus Corporation
- 16.2.8.1. Overview
- 16.2.8.2. Products
- 16.2.8.3. SWOT Analysis
- 16.2.8.4. Recent Developments
- 16.2.8.5. Financials (Based on Availability)
- 16.2.9 Allard
- 16.2.9.1. Overview
- 16.2.9.2. Products
- 16.2.9.3. SWOT Analysis
- 16.2.9.4. Recent Developments
- 16.2.9.5. Financials (Based on Availability)
- 16.2.10 Bioness Inc
- 16.2.10.1. Overview
- 16.2.10.2. Products
- 16.2.10.3. SWOT Analysis
- 16.2.10.4. Recent Developments
- 16.2.10.5. Financials (Based on Availability)
- 16.2.1 Ossur
List of Figures
- Figure 1: Global Foot Drop Treatment Industry Revenue Breakdown (Billion, %) by Region 2024 & 2032
- Figure 2: Global Foot Drop Treatment Industry Volume Breakdown (Piece, %) by Region 2024 & 2032
- Figure 3: North America Foot Drop Treatment Industry Revenue (Billion), by Country 2024 & 2032
- Figure 4: North America Foot Drop Treatment Industry Volume (Piece), by Country 2024 & 2032
- Figure 5: North America Foot Drop Treatment Industry Revenue Share (%), by Country 2024 & 2032
- Figure 6: North America Foot Drop Treatment Industry Volume Share (%), by Country 2024 & 2032
- Figure 7: Europe Foot Drop Treatment Industry Revenue (Billion), by Country 2024 & 2032
- Figure 8: Europe Foot Drop Treatment Industry Volume (Piece), by Country 2024 & 2032
- Figure 9: Europe Foot Drop Treatment Industry Revenue Share (%), by Country 2024 & 2032
- Figure 10: Europe Foot Drop Treatment Industry Volume Share (%), by Country 2024 & 2032
- Figure 11: Asia Pacific Foot Drop Treatment Industry Revenue (Billion), by Country 2024 & 2032
- Figure 12: Asia Pacific Foot Drop Treatment Industry Volume (Piece), by Country 2024 & 2032
- Figure 13: Asia Pacific Foot Drop Treatment Industry Revenue Share (%), by Country 2024 & 2032
- Figure 14: Asia Pacific Foot Drop Treatment Industry Volume Share (%), by Country 2024 & 2032
- Figure 15: Middle East and Africa Foot Drop Treatment Industry Revenue (Billion), by Country 2024 & 2032
- Figure 16: Middle East and Africa Foot Drop Treatment Industry Volume (Piece), by Country 2024 & 2032
- Figure 17: Middle East and Africa Foot Drop Treatment Industry Revenue Share (%), by Country 2024 & 2032
- Figure 18: Middle East and Africa Foot Drop Treatment Industry Volume Share (%), by Country 2024 & 2032
- Figure 19: South America Foot Drop Treatment Industry Revenue (Billion), by Country 2024 & 2032
- Figure 20: South America Foot Drop Treatment Industry Volume (Piece), by Country 2024 & 2032
- Figure 21: South America Foot Drop Treatment Industry Revenue Share (%), by Country 2024 & 2032
- Figure 22: South America Foot Drop Treatment Industry Volume Share (%), by Country 2024 & 2032
- Figure 23: North America Foot Drop Treatment Industry Revenue (Billion), by Product Type 2024 & 2032
- Figure 24: North America Foot Drop Treatment Industry Volume (Piece), by Product Type 2024 & 2032
- Figure 25: North America Foot Drop Treatment Industry Revenue Share (%), by Product Type 2024 & 2032
- Figure 26: North America Foot Drop Treatment Industry Volume Share (%), by Product Type 2024 & 2032
- Figure 27: North America Foot Drop Treatment Industry Revenue (Billion), by Application 2024 & 2032
- Figure 28: North America Foot Drop Treatment Industry Volume (Piece), by Application 2024 & 2032
- Figure 29: North America Foot Drop Treatment Industry Revenue Share (%), by Application 2024 & 2032
- Figure 30: North America Foot Drop Treatment Industry Volume Share (%), by Application 2024 & 2032
- Figure 31: North America Foot Drop Treatment Industry Revenue (Billion), by Country 2024 & 2032
- Figure 32: North America Foot Drop Treatment Industry Volume (Piece), by Country 2024 & 2032
- Figure 33: North America Foot Drop Treatment Industry Revenue Share (%), by Country 2024 & 2032
- Figure 34: North America Foot Drop Treatment Industry Volume Share (%), by Country 2024 & 2032
- Figure 35: Europe Foot Drop Treatment Industry Revenue (Billion), by Product Type 2024 & 2032
- Figure 36: Europe Foot Drop Treatment Industry Volume (Piece), by Product Type 2024 & 2032
- Figure 37: Europe Foot Drop Treatment Industry Revenue Share (%), by Product Type 2024 & 2032
- Figure 38: Europe Foot Drop Treatment Industry Volume Share (%), by Product Type 2024 & 2032
- Figure 39: Europe Foot Drop Treatment Industry Revenue (Billion), by Application 2024 & 2032
- Figure 40: Europe Foot Drop Treatment Industry Volume (Piece), by Application 2024 & 2032
- Figure 41: Europe Foot Drop Treatment Industry Revenue Share (%), by Application 2024 & 2032
- Figure 42: Europe Foot Drop Treatment Industry Volume Share (%), by Application 2024 & 2032
- Figure 43: Europe Foot Drop Treatment Industry Revenue (Billion), by Country 2024 & 2032
- Figure 44: Europe Foot Drop Treatment Industry Volume (Piece), by Country 2024 & 2032
- Figure 45: Europe Foot Drop Treatment Industry Revenue Share (%), by Country 2024 & 2032
- Figure 46: Europe Foot Drop Treatment Industry Volume Share (%), by Country 2024 & 2032
- Figure 47: Asia Pacific Foot Drop Treatment Industry Revenue (Billion), by Product Type 2024 & 2032
- Figure 48: Asia Pacific Foot Drop Treatment Industry Volume (Piece), by Product Type 2024 & 2032
- Figure 49: Asia Pacific Foot Drop Treatment Industry Revenue Share (%), by Product Type 2024 & 2032
- Figure 50: Asia Pacific Foot Drop Treatment Industry Volume Share (%), by Product Type 2024 & 2032
- Figure 51: Asia Pacific Foot Drop Treatment Industry Revenue (Billion), by Application 2024 & 2032
- Figure 52: Asia Pacific Foot Drop Treatment Industry Volume (Piece), by Application 2024 & 2032
- Figure 53: Asia Pacific Foot Drop Treatment Industry Revenue Share (%), by Application 2024 & 2032
- Figure 54: Asia Pacific Foot Drop Treatment Industry Volume Share (%), by Application 2024 & 2032
- Figure 55: Asia Pacific Foot Drop Treatment Industry Revenue (Billion), by Country 2024 & 2032
- Figure 56: Asia Pacific Foot Drop Treatment Industry Volume (Piece), by Country 2024 & 2032
- Figure 57: Asia Pacific Foot Drop Treatment Industry Revenue Share (%), by Country 2024 & 2032
- Figure 58: Asia Pacific Foot Drop Treatment Industry Volume Share (%), by Country 2024 & 2032
- Figure 59: Middle East and Africa Foot Drop Treatment Industry Revenue (Billion), by Product Type 2024 & 2032
- Figure 60: Middle East and Africa Foot Drop Treatment Industry Volume (Piece), by Product Type 2024 & 2032
- Figure 61: Middle East and Africa Foot Drop Treatment Industry Revenue Share (%), by Product Type 2024 & 2032
- Figure 62: Middle East and Africa Foot Drop Treatment Industry Volume Share (%), by Product Type 2024 & 2032
- Figure 63: Middle East and Africa Foot Drop Treatment Industry Revenue (Billion), by Application 2024 & 2032
- Figure 64: Middle East and Africa Foot Drop Treatment Industry Volume (Piece), by Application 2024 & 2032
- Figure 65: Middle East and Africa Foot Drop Treatment Industry Revenue Share (%), by Application 2024 & 2032
- Figure 66: Middle East and Africa Foot Drop Treatment Industry Volume Share (%), by Application 2024 & 2032
- Figure 67: Middle East and Africa Foot Drop Treatment Industry Revenue (Billion), by Country 2024 & 2032
- Figure 68: Middle East and Africa Foot Drop Treatment Industry Volume (Piece), by Country 2024 & 2032
- Figure 69: Middle East and Africa Foot Drop Treatment Industry Revenue Share (%), by Country 2024 & 2032
- Figure 70: Middle East and Africa Foot Drop Treatment Industry Volume Share (%), by Country 2024 & 2032
- Figure 71: South America Foot Drop Treatment Industry Revenue (Billion), by Product Type 2024 & 2032
- Figure 72: South America Foot Drop Treatment Industry Volume (Piece), by Product Type 2024 & 2032
- Figure 73: South America Foot Drop Treatment Industry Revenue Share (%), by Product Type 2024 & 2032
- Figure 74: South America Foot Drop Treatment Industry Volume Share (%), by Product Type 2024 & 2032
- Figure 75: South America Foot Drop Treatment Industry Revenue (Billion), by Application 2024 & 2032
- Figure 76: South America Foot Drop Treatment Industry Volume (Piece), by Application 2024 & 2032
- Figure 77: South America Foot Drop Treatment Industry Revenue Share (%), by Application 2024 & 2032
- Figure 78: South America Foot Drop Treatment Industry Volume Share (%), by Application 2024 & 2032
- Figure 79: South America Foot Drop Treatment Industry Revenue (Billion), by Country 2024 & 2032
- Figure 80: South America Foot Drop Treatment Industry Volume (Piece), by Country 2024 & 2032
- Figure 81: South America Foot Drop Treatment Industry Revenue Share (%), by Country 2024 & 2032
- Figure 82: South America Foot Drop Treatment Industry Volume Share (%), by Country 2024 & 2032
List of Tables
- Table 1: Global Foot Drop Treatment Industry Revenue Billion Forecast, by Region 2019 & 2032
- Table 2: Global Foot Drop Treatment Industry Volume Piece Forecast, by Region 2019 & 2032
- Table 3: Global Foot Drop Treatment Industry Revenue Billion Forecast, by Product Type 2019 & 2032
- Table 4: Global Foot Drop Treatment Industry Volume Piece Forecast, by Product Type 2019 & 2032
- Table 5: Global Foot Drop Treatment Industry Revenue Billion Forecast, by Application 2019 & 2032
- Table 6: Global Foot Drop Treatment Industry Volume Piece Forecast, by Application 2019 & 2032
- Table 7: Global Foot Drop Treatment Industry Revenue Billion Forecast, by Region 2019 & 2032
- Table 8: Global Foot Drop Treatment Industry Volume Piece Forecast, by Region 2019 & 2032
- Table 9: Global Foot Drop Treatment Industry Revenue Billion Forecast, by Country 2019 & 2032
- Table 10: Global Foot Drop Treatment Industry Volume Piece Forecast, by Country 2019 & 2032
- Table 11: United States Foot Drop Treatment Industry Revenue (Billion) Forecast, by Application 2019 & 2032
- Table 12: United States Foot Drop Treatment Industry Volume (Piece) Forecast, by Application 2019 & 2032
- Table 13: Canada Foot Drop Treatment Industry Revenue (Billion) Forecast, by Application 2019 & 2032
- Table 14: Canada Foot Drop Treatment Industry Volume (Piece) Forecast, by Application 2019 & 2032
- Table 15: Mexico Foot Drop Treatment Industry Revenue (Billion) Forecast, by Application 2019 & 2032
- Table 16: Mexico Foot Drop Treatment Industry Volume (Piece) Forecast, by Application 2019 & 2032
- Table 17: Global Foot Drop Treatment Industry Revenue Billion Forecast, by Country 2019 & 2032
- Table 18: Global Foot Drop Treatment Industry Volume Piece Forecast, by Country 2019 & 2032
- Table 19: Germany Foot Drop Treatment Industry Revenue (Billion) Forecast, by Application 2019 & 2032
- Table 20: Germany Foot Drop Treatment Industry Volume (Piece) Forecast, by Application 2019 & 2032
- Table 21: United Kingdom Foot Drop Treatment Industry Revenue (Billion) Forecast, by Application 2019 & 2032
- Table 22: United Kingdom Foot Drop Treatment Industry Volume (Piece) Forecast, by Application 2019 & 2032
- Table 23: France Foot Drop Treatment Industry Revenue (Billion) Forecast, by Application 2019 & 2032
- Table 24: France Foot Drop Treatment Industry Volume (Piece) Forecast, by Application 2019 & 2032
- Table 25: Italy Foot Drop Treatment Industry Revenue (Billion) Forecast, by Application 2019 & 2032
- Table 26: Italy Foot Drop Treatment Industry Volume (Piece) Forecast, by Application 2019 & 2032
- Table 27: Spain Foot Drop Treatment Industry Revenue (Billion) Forecast, by Application 2019 & 2032
- Table 28: Spain Foot Drop Treatment Industry Volume (Piece) Forecast, by Application 2019 & 2032
- Table 29: Rest of Europe Foot Drop Treatment Industry Revenue (Billion) Forecast, by Application 2019 & 2032
- Table 30: Rest of Europe Foot Drop Treatment Industry Volume (Piece) Forecast, by Application 2019 & 2032
- Table 31: Global Foot Drop Treatment Industry Revenue Billion Forecast, by Country 2019 & 2032
- Table 32: Global Foot Drop Treatment Industry Volume Piece Forecast, by Country 2019 & 2032
- Table 33: China Foot Drop Treatment Industry Revenue (Billion) Forecast, by Application 2019 & 2032
- Table 34: China Foot Drop Treatment Industry Volume (Piece) Forecast, by Application 2019 & 2032
- Table 35: Japan Foot Drop Treatment Industry Revenue (Billion) Forecast, by Application 2019 & 2032
- Table 36: Japan Foot Drop Treatment Industry Volume (Piece) Forecast, by Application 2019 & 2032
- Table 37: India Foot Drop Treatment Industry Revenue (Billion) Forecast, by Application 2019 & 2032
- Table 38: India Foot Drop Treatment Industry Volume (Piece) Forecast, by Application 2019 & 2032
- Table 39: Australia Foot Drop Treatment Industry Revenue (Billion) Forecast, by Application 2019 & 2032
- Table 40: Australia Foot Drop Treatment Industry Volume (Piece) Forecast, by Application 2019 & 2032
- Table 41: South Korea Foot Drop Treatment Industry Revenue (Billion) Forecast, by Application 2019 & 2032
- Table 42: South Korea Foot Drop Treatment Industry Volume (Piece) Forecast, by Application 2019 & 2032
- Table 43: Rest of Asia Pacific Foot Drop Treatment Industry Revenue (Billion) Forecast, by Application 2019 & 2032
- Table 44: Rest of Asia Pacific Foot Drop Treatment Industry Volume (Piece) Forecast, by Application 2019 & 2032
- Table 45: Global Foot Drop Treatment Industry Revenue Billion Forecast, by Country 2019 & 2032
- Table 46: Global Foot Drop Treatment Industry Volume Piece Forecast, by Country 2019 & 2032
- Table 47: GCC Foot Drop Treatment Industry Revenue (Billion) Forecast, by Application 2019 & 2032
- Table 48: GCC Foot Drop Treatment Industry Volume (Piece) Forecast, by Application 2019 & 2032
- Table 49: South Africa Foot Drop Treatment Industry Revenue (Billion) Forecast, by Application 2019 & 2032
- Table 50: South Africa Foot Drop Treatment Industry Volume (Piece) Forecast, by Application 2019 & 2032
- Table 51: Rest of Middle East and Africa Foot Drop Treatment Industry Revenue (Billion) Forecast, by Application 2019 & 2032
- Table 52: Rest of Middle East and Africa Foot Drop Treatment Industry Volume (Piece) Forecast, by Application 2019 & 2032
- Table 53: Global Foot Drop Treatment Industry Revenue Billion Forecast, by Country 2019 & 2032
- Table 54: Global Foot Drop Treatment Industry Volume Piece Forecast, by Country 2019 & 2032
- Table 55: Brazil Foot Drop Treatment Industry Revenue (Billion) Forecast, by Application 2019 & 2032
- Table 56: Brazil Foot Drop Treatment Industry Volume (Piece) Forecast, by Application 2019 & 2032
- Table 57: Argentina Foot Drop Treatment Industry Revenue (Billion) Forecast, by Application 2019 & 2032
- Table 58: Argentina Foot Drop Treatment Industry Volume (Piece) Forecast, by Application 2019 & 2032
- Table 59: Rest of South America Foot Drop Treatment Industry Revenue (Billion) Forecast, by Application 2019 & 2032
- Table 60: Rest of South America Foot Drop Treatment Industry Volume (Piece) Forecast, by Application 2019 & 2032
- Table 61: Global Foot Drop Treatment Industry Revenue Billion Forecast, by Product Type 2019 & 2032
- Table 62: Global Foot Drop Treatment Industry Volume Piece Forecast, by Product Type 2019 & 2032
- Table 63: Global Foot Drop Treatment Industry Revenue Billion Forecast, by Application 2019 & 2032
- Table 64: Global Foot Drop Treatment Industry Volume Piece Forecast, by Application 2019 & 2032
- Table 65: Global Foot Drop Treatment Industry Revenue Billion Forecast, by Country 2019 & 2032
- Table 66: Global Foot Drop Treatment Industry Volume Piece Forecast, by Country 2019 & 2032
- Table 67: United States Foot Drop Treatment Industry Revenue (Billion) Forecast, by Application 2019 & 2032
- Table 68: United States Foot Drop Treatment Industry Volume (Piece) Forecast, by Application 2019 & 2032
- Table 69: Canada Foot Drop Treatment Industry Revenue (Billion) Forecast, by Application 2019 & 2032
- Table 70: Canada Foot Drop Treatment Industry Volume (Piece) Forecast, by Application 2019 & 2032
- Table 71: Mexico Foot Drop Treatment Industry Revenue (Billion) Forecast, by Application 2019 & 2032
- Table 72: Mexico Foot Drop Treatment Industry Volume (Piece) Forecast, by Application 2019 & 2032
- Table 73: Global Foot Drop Treatment Industry Revenue Billion Forecast, by Product Type 2019 & 2032
- Table 74: Global Foot Drop Treatment Industry Volume Piece Forecast, by Product Type 2019 & 2032
- Table 75: Global Foot Drop Treatment Industry Revenue Billion Forecast, by Application 2019 & 2032
- Table 76: Global Foot Drop Treatment Industry Volume Piece Forecast, by Application 2019 & 2032
- Table 77: Global Foot Drop Treatment Industry Revenue Billion Forecast, by Country 2019 & 2032
- Table 78: Global Foot Drop Treatment Industry Volume Piece Forecast, by Country 2019 & 2032
- Table 79: Germany Foot Drop Treatment Industry Revenue (Billion) Forecast, by Application 2019 & 2032
- Table 80: Germany Foot Drop Treatment Industry Volume (Piece) Forecast, by Application 2019 & 2032
- Table 81: United Kingdom Foot Drop Treatment Industry Revenue (Billion) Forecast, by Application 2019 & 2032
- Table 82: United Kingdom Foot Drop Treatment Industry Volume (Piece) Forecast, by Application 2019 & 2032
- Table 83: France Foot Drop Treatment Industry Revenue (Billion) Forecast, by Application 2019 & 2032
- Table 84: France Foot Drop Treatment Industry Volume (Piece) Forecast, by Application 2019 & 2032
- Table 85: Italy Foot Drop Treatment Industry Revenue (Billion) Forecast, by Application 2019 & 2032
- Table 86: Italy Foot Drop Treatment Industry Volume (Piece) Forecast, by Application 2019 & 2032
- Table 87: Spain Foot Drop Treatment Industry Revenue (Billion) Forecast, by Application 2019 & 2032
- Table 88: Spain Foot Drop Treatment Industry Volume (Piece) Forecast, by Application 2019 & 2032
- Table 89: Rest of Europe Foot Drop Treatment Industry Revenue (Billion) Forecast, by Application 2019 & 2032
- Table 90: Rest of Europe Foot Drop Treatment Industry Volume (Piece) Forecast, by Application 2019 & 2032
- Table 91: Global Foot Drop Treatment Industry Revenue Billion Forecast, by Product Type 2019 & 2032
- Table 92: Global Foot Drop Treatment Industry Volume Piece Forecast, by Product Type 2019 & 2032
- Table 93: Global Foot Drop Treatment Industry Revenue Billion Forecast, by Application 2019 & 2032
- Table 94: Global Foot Drop Treatment Industry Volume Piece Forecast, by Application 2019 & 2032
- Table 95: Global Foot Drop Treatment Industry Revenue Billion Forecast, by Country 2019 & 2032
- Table 96: Global Foot Drop Treatment Industry Volume Piece Forecast, by Country 2019 & 2032
- Table 97: China Foot Drop Treatment Industry Revenue (Billion) Forecast, by Application 2019 & 2032
- Table 98: China Foot Drop Treatment Industry Volume (Piece) Forecast, by Application 2019 & 2032
- Table 99: Japan Foot Drop Treatment Industry Revenue (Billion) Forecast, by Application 2019 & 2032
- Table 100: Japan Foot Drop Treatment Industry Volume (Piece) Forecast, by Application 2019 & 2032
- Table 101: India Foot Drop Treatment Industry Revenue (Billion) Forecast, by Application 2019 & 2032
- Table 102: India Foot Drop Treatment Industry Volume (Piece) Forecast, by Application 2019 & 2032
- Table 103: Australia Foot Drop Treatment Industry Revenue (Billion) Forecast, by Application 2019 & 2032
- Table 104: Australia Foot Drop Treatment Industry Volume (Piece) Forecast, by Application 2019 & 2032
- Table 105: South Korea Foot Drop Treatment Industry Revenue (Billion) Forecast, by Application 2019 & 2032
- Table 106: South Korea Foot Drop Treatment Industry Volume (Piece) Forecast, by Application 2019 & 2032
- Table 107: Rest of Asia Pacific Foot Drop Treatment Industry Revenue (Billion) Forecast, by Application 2019 & 2032
- Table 108: Rest of Asia Pacific Foot Drop Treatment Industry Volume (Piece) Forecast, by Application 2019 & 2032
- Table 109: Global Foot Drop Treatment Industry Revenue Billion Forecast, by Product Type 2019 & 2032
- Table 110: Global Foot Drop Treatment Industry Volume Piece Forecast, by Product Type 2019 & 2032
- Table 111: Global Foot Drop Treatment Industry Revenue Billion Forecast, by Application 2019 & 2032
- Table 112: Global Foot Drop Treatment Industry Volume Piece Forecast, by Application 2019 & 2032
- Table 113: Global Foot Drop Treatment Industry Revenue Billion Forecast, by Country 2019 & 2032
- Table 114: Global Foot Drop Treatment Industry Volume Piece Forecast, by Country 2019 & 2032
- Table 115: GCC Foot Drop Treatment Industry Revenue (Billion) Forecast, by Application 2019 & 2032
- Table 116: GCC Foot Drop Treatment Industry Volume (Piece) Forecast, by Application 2019 & 2032
- Table 117: South Africa Foot Drop Treatment Industry Revenue (Billion) Forecast, by Application 2019 & 2032
- Table 118: South Africa Foot Drop Treatment Industry Volume (Piece) Forecast, by Application 2019 & 2032
- Table 119: Rest of Middle East and Africa Foot Drop Treatment Industry Revenue (Billion) Forecast, by Application 2019 & 2032
- Table 120: Rest of Middle East and Africa Foot Drop Treatment Industry Volume (Piece) Forecast, by Application 2019 & 2032
- Table 121: Global Foot Drop Treatment Industry Revenue Billion Forecast, by Product Type 2019 & 2032
- Table 122: Global Foot Drop Treatment Industry Volume Piece Forecast, by Product Type 2019 & 2032
- Table 123: Global Foot Drop Treatment Industry Revenue Billion Forecast, by Application 2019 & 2032
- Table 124: Global Foot Drop Treatment Industry Volume Piece Forecast, by Application 2019 & 2032
- Table 125: Global Foot Drop Treatment Industry Revenue Billion Forecast, by Country 2019 & 2032
- Table 126: Global Foot Drop Treatment Industry Volume Piece Forecast, by Country 2019 & 2032
- Table 127: Brazil Foot Drop Treatment Industry Revenue (Billion) Forecast, by Application 2019 & 2032
- Table 128: Brazil Foot Drop Treatment Industry Volume (Piece) Forecast, by Application 2019 & 2032
- Table 129: Argentina Foot Drop Treatment Industry Revenue (Billion) Forecast, by Application 2019 & 2032
- Table 130: Argentina Foot Drop Treatment Industry Volume (Piece) Forecast, by Application 2019 & 2032
- Table 131: Rest of South America Foot Drop Treatment Industry Revenue (Billion) Forecast, by Application 2019 & 2032
- Table 132: Rest of South America Foot Drop Treatment Industry Volume (Piece) Forecast, by Application 2019 & 2032
Frequently Asked Questions
1. What is the projected Compound Annual Growth Rate (CAGR) of the Foot Drop Treatment Industry?
The projected CAGR is approximately 9.50%.
2. Which companies are prominent players in the Foot Drop Treatment Industry?
Key companies in the market include Ossur, Saebo Inc, Boston Orthotics & Prosthetics, Ottobock, Axio Bionics, Thrive Orthopedics, Turbomed Orthotics*List Not Exhaustive, Accelerated Care Plus Corporation, Allard, Bioness Inc.
3. What are the main segments of the Foot Drop Treatment Industry?
The market segments include Product Type, Application.
4. Can you provide details about the market size?
The market size is estimated to be USD 4 Billion as of 2022.
5. What are some drivers contributing to market growth?
Growing Burden of Chronic Diseases; Advancements in Products.
6. What are the notable trends driving market growth?
Functional Electrical Stimulator Segment is Expected to Show a Significant Growth Rate in the Foot Drop Treatment Market.
7. Are there any restraints impacting market growth?
High Cost of Functional Electrical Stimulators.
8. Can you provide examples of recent developments in the market?
As per the news published in August 2022, a Velcro sleeve fastened around the leg has been designed with electrodes that help stimulate the muscles of those who experience difficulty getting around due to nervous system conditions. This device will be ready for delivery to those who have experienced a stroke, or have multiple sclerosis or cerebral palsy, in 2023.
9. What pricing options are available for accessing the report?
Pricing options include single-user, multi-user, and enterprise licenses priced at USD 4750, USD 5250, and USD 8750 respectively.
10. Is the market size provided in terms of value or volume?
The market size is provided in terms of value, measured in Billion and volume, measured in Piece.
11. Are there any specific market keywords associated with the report?
Yes, the market keyword associated with the report is "Foot Drop Treatment Industry," which aids in identifying and referencing the specific market segment covered.
12. How do I determine which pricing option suits my needs best?
The pricing options vary based on user requirements and access needs. Individual users may opt for single-user licenses, while businesses requiring broader access may choose multi-user or enterprise licenses for cost-effective access to the report.
13. Are there any additional resources or data provided in the Foot Drop Treatment Industry report?
While the report offers comprehensive insights, it's advisable to review the specific contents or supplementary materials provided to ascertain if additional resources or data are available.
14. How can I stay updated on further developments or reports in the Foot Drop Treatment Industry?
To stay informed about further developments, trends, and reports in the Foot Drop Treatment Industry, consider subscribing to industry newsletters, following relevant companies and organizations, or regularly checking reputable industry news sources and publications.
Methodology
Step 1 - Identification of Relevant Samples Size from Population Database


Step 2 - Approaches for Defining Global Market Size (Value, Volume* & Price*)

Note*: In applicable scenarios
Step 3 - Data Sources
Primary Research
- Web Analytics
- Survey Reports
- Research Institute
- Latest Research Reports
- Opinion Leaders
Secondary Research
- Annual Reports
- White Paper
- Latest Press Release
- Industry Association
- Paid Database
- Investor Presentations

Step 4 - Data Triangulation
Involves using different sources of information in order to increase the validity of a study
These sources are likely to be stakeholders in a program - participants, other researchers, program staff, other community members, and so on.
Then we put all data in single framework & apply various statistical tools to find out the dynamic on the market.
During the analysis stage, feedback from the stakeholder groups would be compared to determine areas of agreement as well as areas of divergence
