

Key Insights
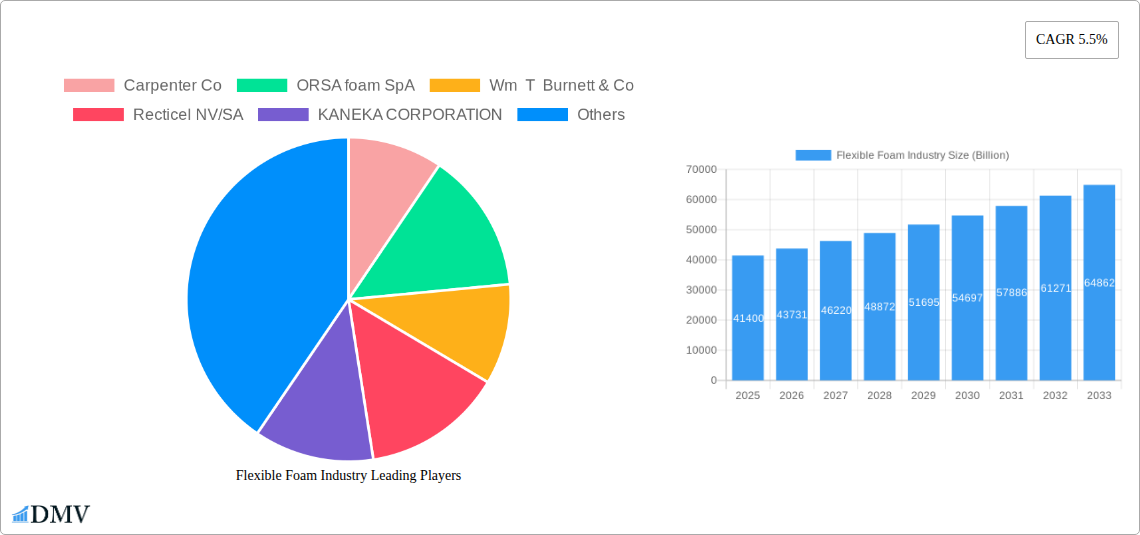
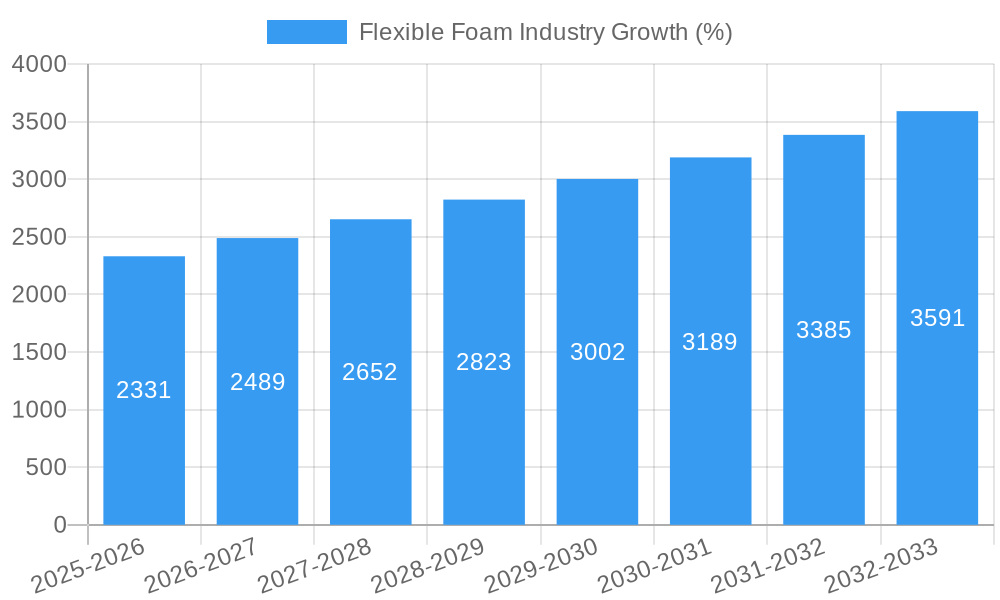
The global flexible foam market, valued at $41.4 billion in 2025, is projected to experience robust growth, driven by a compound annual growth rate (CAGR) of 5.5% from 2025 to 2033. This expansion is fueled by several key factors. Firstly, the construction industry's increasing demand for flexible foam in insulation, cushioning, and upholstery applications is a significant driver. Secondly, the burgeoning consumer goods sector, particularly in furniture and bedding, is contributing substantially to market growth. The automotive industry's adoption of flexible foam for seating and interior components also presents a significant opportunity. Technological advancements leading to the development of more sustainable and high-performance flexible foams further contribute to market expansion. Finally, the rising disposable incomes in developing economies are boosting consumer spending on products incorporating flexible foam, particularly in Asia-Pacific.
However, certain restraints exist. Fluctuations in raw material prices, particularly those of polyurethane and polyether, pose a challenge to market stability. Furthermore, increasing environmental concerns regarding the production and disposal of certain types of flexible foams are prompting the development of eco-friendly alternatives and stricter regulations, which may impact market dynamics. Market segmentation reveals a strong presence of polyurethane-based foams, which are expected to maintain their dominance throughout the forecast period. Key players such as BASF, Huntsman, and Dow are strategically positioning themselves to capitalize on market opportunities through product innovation and expansion into new geographic regions. The competitive landscape is characterized by both established global players and regional manufacturers, creating a dynamic and evolving market structure. Regional growth is anticipated to be particularly strong in Asia-Pacific, fueled by rapid industrialization and rising consumer demand.
Flexible Foam Industry: A Billion-Dollar Market Analysis (2019-2033)
This comprehensive report provides an in-depth analysis of the flexible foam industry, projecting a market valuation exceeding $XX billion by 2033. It covers market composition, key players, technological advancements, and future opportunities, offering invaluable insights for stakeholders across the value chain. The report leverages a robust data set spanning the historical period (2019-2024), base year (2025), and forecast period (2025-2033), ensuring a reliable and future-oriented perspective.
Flexible Foam Industry Market Composition & Trends
The flexible foam market, valued at $XX billion in 2025, exhibits a moderately concentrated landscape. Key players such as BASF SE, Huntsman International LLC, and Dow hold significant market share, while numerous regional and specialized companies contribute to a dynamic competitive environment. Market concentration is expected to shift slightly with ongoing mergers and acquisitions (M&A). Innovation is driven by demand for sustainable materials, improved performance characteristics, and specialized applications. Stringent environmental regulations are shaping material choices and manufacturing processes. Substitute materials, like recycled foams and bio-based alternatives, present both opportunities and challenges. End-users span diverse sectors including construction, furniture, transportation, and consumer goods, each with unique material requirements.
- Market Share Distribution (2025): BASF SE (XX%), Huntsman International LLC (XX%), Dow (XX%), Others (XX%).
- M&A Activity (2019-2025): Total deal value exceeding $XX billion, with significant transactions including Carpenter Co.’s acquisition of Recticel N.V.’s Engineered Foams Division.
- Innovation Catalysts: Focus on bio-based foams, improved fire resistance, and lightweighting technologies.
- Regulatory Landscape: Growing emphasis on environmental sustainability and reduced VOC emissions.
Flexible Foam Industry Industry Evolution
The flexible foam market has witnessed consistent growth throughout the historical period (2019-2024), driven by increasing demand across various end-use sectors. Technological advancements, including the development of more efficient manufacturing processes and the introduction of innovative foam formulations, are boosting production efficiency and product performance. Consumer demands for sustainable and high-performance materials are further accelerating innovation. The market experienced a compound annual growth rate (CAGR) of XX% from 2019 to 2024, and is projected to maintain a robust CAGR of XX% during the forecast period (2025-2033). This growth is underpinned by rising disposable incomes, increasing urbanization, and the expansion of construction and automotive sectors globally. The adoption of advanced technologies, like AI-powered optimization in manufacturing, is gradually increasing, improving efficiency and minimizing waste. However, the rising cost of raw materials, along with supply chain volatility, presents challenges to sustained growth.
Leading Regions, Countries, or Segments in Flexible Foam Industry
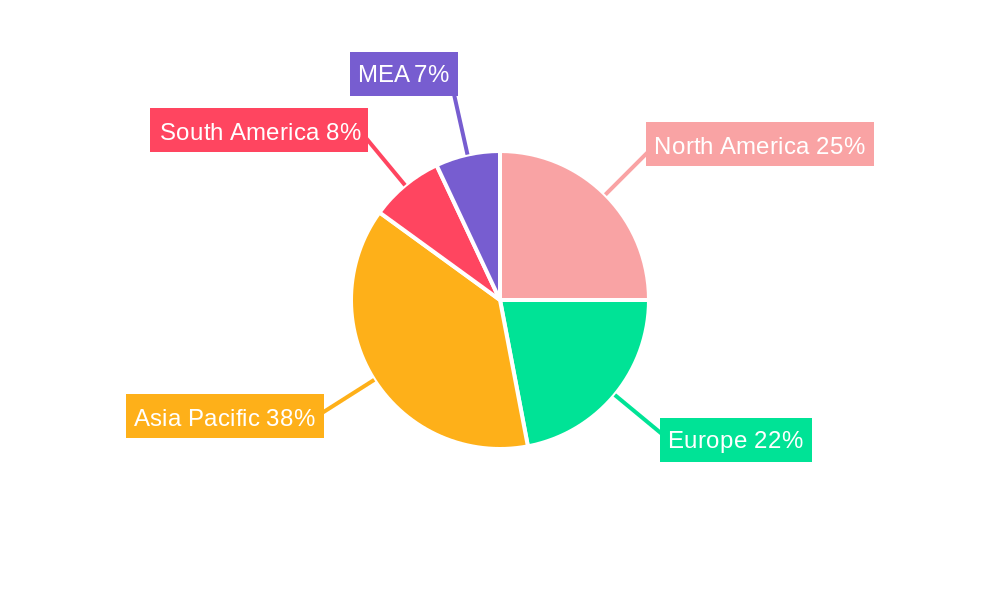
The flexible foam market exhibits regional variations in growth and dominance. While the precise leading region and segment require further analysis, initial observations based on current trends and established market presence point to several dominant areas.
Dominant Segments:
- Application: Construction (driven by insulation needs in building and infrastructure projects) and Transportation (due to demand for lightweight and cushioning materials).
- Type: Polyurethane (due to its versatility and performance characteristics) remains the dominant type.
Key Drivers:
- Construction: Increased infrastructure spending, particularly in developing economies, fuels robust growth. Stringent energy efficiency regulations drive demand for high-performance insulation foams.
- Transportation: Lightweighting initiatives in the automotive and aerospace industries stimulate demand for flexible foams with high strength-to-weight ratios.
- Polyurethane: Versatility in applications, coupled with relatively lower cost compared to other types, secures its market leadership.
The dominance of specific regions and countries will depend on factors like economic growth, infrastructural development, and government policies promoting sustainable building practices and efficient transportation systems.
Flexible Foam Industry Product Innovations
Recent innovations focus on enhancing foam properties like fire resistance, thermal insulation, and durability. High-performance polyurethane foams with improved resilience and longevity are gaining popularity, alongside bio-based alternatives offering enhanced sustainability. These advancements are driven by a rising demand for greener and more efficient materials across various applications. Unique selling propositions often include superior performance characteristics, improved sustainability profiles, and ease of processing.
Propelling Factors for Flexible Foam Industry Growth
Several factors fuel the growth of the flexible foam industry. Technological advancements, such as the development of novel foam formulations and efficient manufacturing processes, improve product performance and reduce costs. Economic growth, particularly in developing economies, drives increased demand across various sectors. Furthermore, supportive government regulations promoting energy efficiency and sustainable building practices incentivize the adoption of high-performance flexible foams. For instance, construction regulations mandating specific insulation levels directly impact demand.
Obstacles in the Flexible Foam Industry Market
The flexible foam industry faces challenges, including fluctuating raw material prices, affecting production costs. Supply chain disruptions, exacerbated by geopolitical uncertainties, can restrict production and delivery. Moreover, intense competition among established players and emerging entrants necessitates continuous innovation and cost optimization to maintain profitability. Strict environmental regulations introduce compliance costs, requiring investment in cleaner production technologies.
Future Opportunities in Flexible Foam Industry
Emerging markets, particularly in Asia and Africa, present significant growth opportunities, driven by expanding construction and transportation sectors. Innovation in bio-based foams and recycled materials offers substantial potential for sustainable growth. Advancements in foam processing technologies will improve efficiency and reduce waste, creating further opportunities.
Major Players in the Flexible Foam Industry Ecosystem
- Carpenter Co
- ORSA foam SpA
- Wm T Burnett & Co
- Recticel NV/SA
- KANEKA CORPORATION
- Rogers Corporation
- BASF SE
- Huntsman International LLC
- Dow
- Inoac Corporation
- Woodbridge
- Greiner AG
- SEKISUI CHEMICAL CO LTD
- Sheela Foam Ltd
- American Excelsior Company
- Covestro AG
- Changzhou Xingang Plastic Products Co Ltd
Key Developments in Flexible Foam Industry Industry
- July 2022: William T. Burnett & Co. acquired Flex Foam, expanding its specialty urethane foam production capabilities. This strengthens their market position in Arizona and beyond.
- May 2022: Huntsman International LLC collaborated with BRUGG pipes to develop a next-generation polyurethane foam system for highly efficient pre-insulated pipes, enhancing energy efficiency in building applications. This partnership drives innovation in the insulation market.
- March 2022: Carpenter Co. acquired Recticel N.V.'s Engineered Foams Division, creating the world's largest vertically integrated manufacturer of polyurethane foams. This transformative merger significantly alters the competitive landscape.
Strategic Flexible Foam Industry Market Forecast
The flexible foam market is poised for continued growth, driven by technological advancements, increasing demand from diverse end-use sectors, and supportive regulatory policies. Expanding into emerging markets and developing innovative, sustainable materials will be key to unlocking the market's full potential. The long-term outlook remains positive, with significant opportunities for companies that can adapt to evolving market demands and leverage technological advancements.
Flexible Foam Industry Segmentation
-
1. Type
-
1.1. Polyurethane
- 1.1.1. Polyester
- 1.1.2. Polyether
-
1.2. Polyethylene
- 1.2.1. Cross linked
- 1.2.2. Non-cross linked
- 1.3. Polypropylene
-
1.1. Polyurethane
-
2. Application
- 2.1. Construction
- 2.2. Consumer Goods
- 2.3. Furniture
- 2.4. Transportation
- 2.5. Other Applications
Flexible Foam Industry Segmentation By Geography
-
1. Asia Pacific
- 1.1. China
- 1.2. India
- 1.3. Japan
- 1.4. South Korea
- 1.5. Rest of Asia Pacific
-
2. North America
- 2.1. United States
- 2.2. Canada
- 2.3. Mexico
-
3. Europe
- 3.1. Germany
- 3.2. United Kingdom
- 3.3. Italy
- 3.4. France
- 3.5. Rest of Europe
-
4. South America
- 4.1. Brazil
- 4.2. Argentina
- 4.3. Rest of South America
-
5. Middle East and Africa
- 5.1. Saudi Arabia
- 5.2. South Africa
- 5.3. Rest of Middle East and Africa
Flexible Foam Industry REPORT HIGHLIGHTS
| Aspects | Details |
|---|---|
| Study Period | 2019-2033 |
| Base Year | 2024 |
| Estimated Year | 2025 |
| Forecast Period | 2025-2033 |
| Historical Period | 2019-2024 |
| Growth Rate | CAGR of 5.5% from 2019-2033 |
| Segmentation |
|
Table of Contents
- 1. Introduction
- 1.1. Research Scope
- 1.2. Market Segmentation
- 1.3. Research Methodology
- 1.4. Definitions and Assumptions
- 2. Executive Summary
- 2.1. Introduction
- 3. Market Dynamics
- 3.1. Introduction
- 3.2. Market Drivers
- 3.2.1. Growing Demand of Flexible Foam in Packaging; Increasing Demand for Flexible Foam in Carpet Cushion; Other Drivers
- 3.3. Market Restrains
- 3.3.1. Environmental Degradation while Fabrication; Other Restraints
- 3.4. Market Trends
- 3.4.1. Growing Demand for Flexible Foam in Furniture Industry
- 4. Market Factor Analysis
- 4.1. Porters Five Forces
- 4.2. Supply/Value Chain
- 4.3. PESTEL analysis
- 4.4. Market Entropy
- 4.5. Patent/Trademark Analysis
- 5. Global Flexible Foam Industry Analysis, Insights and Forecast, 2019-2031
- 5.1. Market Analysis, Insights and Forecast - by Type
- 5.1.1. Polyurethane
- 5.1.1.1. Polyester
- 5.1.1.2. Polyether
- 5.1.2. Polyethylene
- 5.1.2.1. Cross linked
- 5.1.2.2. Non-cross linked
- 5.1.3. Polypropylene
- 5.1.1. Polyurethane
- 5.2. Market Analysis, Insights and Forecast - by Application
- 5.2.1. Construction
- 5.2.2. Consumer Goods
- 5.2.3. Furniture
- 5.2.4. Transportation
- 5.2.5. Other Applications
- 5.3. Market Analysis, Insights and Forecast - by Region
- 5.3.1. Asia Pacific
- 5.3.2. North America
- 5.3.3. Europe
- 5.3.4. South America
- 5.3.5. Middle East and Africa
- 5.1. Market Analysis, Insights and Forecast - by Type
- 6. Asia Pacific Flexible Foam Industry Analysis, Insights and Forecast, 2019-2031
- 6.1. Market Analysis, Insights and Forecast - by Type
- 6.1.1. Polyurethane
- 6.1.1.1. Polyester
- 6.1.1.2. Polyether
- 6.1.2. Polyethylene
- 6.1.2.1. Cross linked
- 6.1.2.2. Non-cross linked
- 6.1.3. Polypropylene
- 6.1.1. Polyurethane
- 6.2. Market Analysis, Insights and Forecast - by Application
- 6.2.1. Construction
- 6.2.2. Consumer Goods
- 6.2.3. Furniture
- 6.2.4. Transportation
- 6.2.5. Other Applications
- 6.1. Market Analysis, Insights and Forecast - by Type
- 7. North America Flexible Foam Industry Analysis, Insights and Forecast, 2019-2031
- 7.1. Market Analysis, Insights and Forecast - by Type
- 7.1.1. Polyurethane
- 7.1.1.1. Polyester
- 7.1.1.2. Polyether
- 7.1.2. Polyethylene
- 7.1.2.1. Cross linked
- 7.1.2.2. Non-cross linked
- 7.1.3. Polypropylene
- 7.1.1. Polyurethane
- 7.2. Market Analysis, Insights and Forecast - by Application
- 7.2.1. Construction
- 7.2.2. Consumer Goods
- 7.2.3. Furniture
- 7.2.4. Transportation
- 7.2.5. Other Applications
- 7.1. Market Analysis, Insights and Forecast - by Type
- 8. Europe Flexible Foam Industry Analysis, Insights and Forecast, 2019-2031
- 8.1. Market Analysis, Insights and Forecast - by Type
- 8.1.1. Polyurethane
- 8.1.1.1. Polyester
- 8.1.1.2. Polyether
- 8.1.2. Polyethylene
- 8.1.2.1. Cross linked
- 8.1.2.2. Non-cross linked
- 8.1.3. Polypropylene
- 8.1.1. Polyurethane
- 8.2. Market Analysis, Insights and Forecast - by Application
- 8.2.1. Construction
- 8.2.2. Consumer Goods
- 8.2.3. Furniture
- 8.2.4. Transportation
- 8.2.5. Other Applications
- 8.1. Market Analysis, Insights and Forecast - by Type
- 9. South America Flexible Foam Industry Analysis, Insights and Forecast, 2019-2031
- 9.1. Market Analysis, Insights and Forecast - by Type
- 9.1.1. Polyurethane
- 9.1.1.1. Polyester
- 9.1.1.2. Polyether
- 9.1.2. Polyethylene
- 9.1.2.1. Cross linked
- 9.1.2.2. Non-cross linked
- 9.1.3. Polypropylene
- 9.1.1. Polyurethane
- 9.2. Market Analysis, Insights and Forecast - by Application
- 9.2.1. Construction
- 9.2.2. Consumer Goods
- 9.2.3. Furniture
- 9.2.4. Transportation
- 9.2.5. Other Applications
- 9.1. Market Analysis, Insights and Forecast - by Type
- 10. Middle East and Africa Flexible Foam Industry Analysis, Insights and Forecast, 2019-2031
- 10.1. Market Analysis, Insights and Forecast - by Type
- 10.1.1. Polyurethane
- 10.1.1.1. Polyester
- 10.1.1.2. Polyether
- 10.1.2. Polyethylene
- 10.1.2.1. Cross linked
- 10.1.2.2. Non-cross linked
- 10.1.3. Polypropylene
- 10.1.1. Polyurethane
- 10.2. Market Analysis, Insights and Forecast - by Application
- 10.2.1. Construction
- 10.2.2. Consumer Goods
- 10.2.3. Furniture
- 10.2.4. Transportation
- 10.2.5. Other Applications
- 10.1. Market Analysis, Insights and Forecast - by Type
- 11. North America Flexible Foam Industry Analysis, Insights and Forecast, 2019-2031
- 11.1. Market Analysis, Insights and Forecast - By Country/Sub-region
- 11.1.1 United States
- 11.1.2 Canada
- 11.1.3 Mexico
- 12. Europe Flexible Foam Industry Analysis, Insights and Forecast, 2019-2031
- 12.1. Market Analysis, Insights and Forecast - By Country/Sub-region
- 12.1.1 Germany
- 12.1.2 France
- 12.1.3 Italy
- 12.1.4 United Kingdom
- 12.1.5 Netherlands
- 12.1.6 Rest of Europe
- 13. Asia Pacific Flexible Foam Industry Analysis, Insights and Forecast, 2019-2031
- 13.1. Market Analysis, Insights and Forecast - By Country/Sub-region
- 13.1.1 China
- 13.1.2 Japan
- 13.1.3 India
- 13.1.4 South Korea
- 13.1.5 Taiwan
- 13.1.6 Australia
- 13.1.7 Rest of Asia-Pacific
- 14. South America Flexible Foam Industry Analysis, Insights and Forecast, 2019-2031
- 14.1. Market Analysis, Insights and Forecast - By Country/Sub-region
- 14.1.1 Brazil
- 14.1.2 Argentina
- 14.1.3 Rest of South America
- 15. MEA Flexible Foam Industry Analysis, Insights and Forecast, 2019-2031
- 15.1. Market Analysis, Insights and Forecast - By Country/Sub-region
- 15.1.1 Middle East
- 15.1.2 Africa
- 16. Competitive Analysis
- 16.1. Global Market Share Analysis 2024
- 16.2. Company Profiles
- 16.2.1 Carpenter Co
- 16.2.1.1. Overview
- 16.2.1.2. Products
- 16.2.1.3. SWOT Analysis
- 16.2.1.4. Recent Developments
- 16.2.1.5. Financials (Based on Availability)
- 16.2.2 ORSA foam SpA
- 16.2.2.1. Overview
- 16.2.2.2. Products
- 16.2.2.3. SWOT Analysis
- 16.2.2.4. Recent Developments
- 16.2.2.5. Financials (Based on Availability)
- 16.2.3 Wm T Burnett & Co
- 16.2.3.1. Overview
- 16.2.3.2. Products
- 16.2.3.3. SWOT Analysis
- 16.2.3.4. Recent Developments
- 16.2.3.5. Financials (Based on Availability)
- 16.2.4 Recticel NV/SA
- 16.2.4.1. Overview
- 16.2.4.2. Products
- 16.2.4.3. SWOT Analysis
- 16.2.4.4. Recent Developments
- 16.2.4.5. Financials (Based on Availability)
- 16.2.5 KANEKA CORPORATION
- 16.2.5.1. Overview
- 16.2.5.2. Products
- 16.2.5.3. SWOT Analysis
- 16.2.5.4. Recent Developments
- 16.2.5.5. Financials (Based on Availability)
- 16.2.6 Rogers Corporation
- 16.2.6.1. Overview
- 16.2.6.2. Products
- 16.2.6.3. SWOT Analysis
- 16.2.6.4. Recent Developments
- 16.2.6.5. Financials (Based on Availability)
- 16.2.7 BASF SE
- 16.2.7.1. Overview
- 16.2.7.2. Products
- 16.2.7.3. SWOT Analysis
- 16.2.7.4. Recent Developments
- 16.2.7.5. Financials (Based on Availability)
- 16.2.8 Huntsman International LLC
- 16.2.8.1. Overview
- 16.2.8.2. Products
- 16.2.8.3. SWOT Analysis
- 16.2.8.4. Recent Developments
- 16.2.8.5. Financials (Based on Availability)
- 16.2.9 Dow
- 16.2.9.1. Overview
- 16.2.9.2. Products
- 16.2.9.3. SWOT Analysis
- 16.2.9.4. Recent Developments
- 16.2.9.5. Financials (Based on Availability)
- 16.2.10 Inoac Corporation
- 16.2.10.1. Overview
- 16.2.10.2. Products
- 16.2.10.3. SWOT Analysis
- 16.2.10.4. Recent Developments
- 16.2.10.5. Financials (Based on Availability)
- 16.2.11 Woodbridge
- 16.2.11.1. Overview
- 16.2.11.2. Products
- 16.2.11.3. SWOT Analysis
- 16.2.11.4. Recent Developments
- 16.2.11.5. Financials (Based on Availability)
- 16.2.12 Greiner AG
- 16.2.12.1. Overview
- 16.2.12.2. Products
- 16.2.12.3. SWOT Analysis
- 16.2.12.4. Recent Developments
- 16.2.12.5. Financials (Based on Availability)
- 16.2.13 SEKISUI CHEMICAL CO LTD
- 16.2.13.1. Overview
- 16.2.13.2. Products
- 16.2.13.3. SWOT Analysis
- 16.2.13.4. Recent Developments
- 16.2.13.5. Financials (Based on Availability)
- 16.2.14 Sheela Foam Ltd
- 16.2.14.1. Overview
- 16.2.14.2. Products
- 16.2.14.3. SWOT Analysis
- 16.2.14.4. Recent Developments
- 16.2.14.5. Financials (Based on Availability)
- 16.2.15 American Excelsior Company
- 16.2.15.1. Overview
- 16.2.15.2. Products
- 16.2.15.3. SWOT Analysis
- 16.2.15.4. Recent Developments
- 16.2.15.5. Financials (Based on Availability)
- 16.2.16 Covestro AG
- 16.2.16.1. Overview
- 16.2.16.2. Products
- 16.2.16.3. SWOT Analysis
- 16.2.16.4. Recent Developments
- 16.2.16.5. Financials (Based on Availability)
- 16.2.17 Changzhou Xingang Plastic Products Co Ltd
- 16.2.17.1. Overview
- 16.2.17.2. Products
- 16.2.17.3. SWOT Analysis
- 16.2.17.4. Recent Developments
- 16.2.17.5. Financials (Based on Availability)
- 16.2.1 Carpenter Co
List of Figures
- Figure 1: Global Flexible Foam Industry Revenue Breakdown (Billion, %) by Region 2024 & 2032
- Figure 2: Global Flexible Foam Industry Volume Breakdown (K Tons, %) by Region 2024 & 2032
- Figure 3: North America Flexible Foam Industry Revenue (Billion), by Country 2024 & 2032
- Figure 4: North America Flexible Foam Industry Volume (K Tons), by Country 2024 & 2032
- Figure 5: North America Flexible Foam Industry Revenue Share (%), by Country 2024 & 2032
- Figure 6: North America Flexible Foam Industry Volume Share (%), by Country 2024 & 2032
- Figure 7: Europe Flexible Foam Industry Revenue (Billion), by Country 2024 & 2032
- Figure 8: Europe Flexible Foam Industry Volume (K Tons), by Country 2024 & 2032
- Figure 9: Europe Flexible Foam Industry Revenue Share (%), by Country 2024 & 2032
- Figure 10: Europe Flexible Foam Industry Volume Share (%), by Country 2024 & 2032
- Figure 11: Asia Pacific Flexible Foam Industry Revenue (Billion), by Country 2024 & 2032
- Figure 12: Asia Pacific Flexible Foam Industry Volume (K Tons), by Country 2024 & 2032
- Figure 13: Asia Pacific Flexible Foam Industry Revenue Share (%), by Country 2024 & 2032
- Figure 14: Asia Pacific Flexible Foam Industry Volume Share (%), by Country 2024 & 2032
- Figure 15: South America Flexible Foam Industry Revenue (Billion), by Country 2024 & 2032
- Figure 16: South America Flexible Foam Industry Volume (K Tons), by Country 2024 & 2032
- Figure 17: South America Flexible Foam Industry Revenue Share (%), by Country 2024 & 2032
- Figure 18: South America Flexible Foam Industry Volume Share (%), by Country 2024 & 2032
- Figure 19: MEA Flexible Foam Industry Revenue (Billion), by Country 2024 & 2032
- Figure 20: MEA Flexible Foam Industry Volume (K Tons), by Country 2024 & 2032
- Figure 21: MEA Flexible Foam Industry Revenue Share (%), by Country 2024 & 2032
- Figure 22: MEA Flexible Foam Industry Volume Share (%), by Country 2024 & 2032
- Figure 23: Asia Pacific Flexible Foam Industry Revenue (Billion), by Type 2024 & 2032
- Figure 24: Asia Pacific Flexible Foam Industry Volume (K Tons), by Type 2024 & 2032
- Figure 25: Asia Pacific Flexible Foam Industry Revenue Share (%), by Type 2024 & 2032
- Figure 26: Asia Pacific Flexible Foam Industry Volume Share (%), by Type 2024 & 2032
- Figure 27: Asia Pacific Flexible Foam Industry Revenue (Billion), by Application 2024 & 2032
- Figure 28: Asia Pacific Flexible Foam Industry Volume (K Tons), by Application 2024 & 2032
- Figure 29: Asia Pacific Flexible Foam Industry Revenue Share (%), by Application 2024 & 2032
- Figure 30: Asia Pacific Flexible Foam Industry Volume Share (%), by Application 2024 & 2032
- Figure 31: Asia Pacific Flexible Foam Industry Revenue (Billion), by Country 2024 & 2032
- Figure 32: Asia Pacific Flexible Foam Industry Volume (K Tons), by Country 2024 & 2032
- Figure 33: Asia Pacific Flexible Foam Industry Revenue Share (%), by Country 2024 & 2032
- Figure 34: Asia Pacific Flexible Foam Industry Volume Share (%), by Country 2024 & 2032
- Figure 35: North America Flexible Foam Industry Revenue (Billion), by Type 2024 & 2032
- Figure 36: North America Flexible Foam Industry Volume (K Tons), by Type 2024 & 2032
- Figure 37: North America Flexible Foam Industry Revenue Share (%), by Type 2024 & 2032
- Figure 38: North America Flexible Foam Industry Volume Share (%), by Type 2024 & 2032
- Figure 39: North America Flexible Foam Industry Revenue (Billion), by Application 2024 & 2032
- Figure 40: North America Flexible Foam Industry Volume (K Tons), by Application 2024 & 2032
- Figure 41: North America Flexible Foam Industry Revenue Share (%), by Application 2024 & 2032
- Figure 42: North America Flexible Foam Industry Volume Share (%), by Application 2024 & 2032
- Figure 43: North America Flexible Foam Industry Revenue (Billion), by Country 2024 & 2032
- Figure 44: North America Flexible Foam Industry Volume (K Tons), by Country 2024 & 2032
- Figure 45: North America Flexible Foam Industry Revenue Share (%), by Country 2024 & 2032
- Figure 46: North America Flexible Foam Industry Volume Share (%), by Country 2024 & 2032
- Figure 47: Europe Flexible Foam Industry Revenue (Billion), by Type 2024 & 2032
- Figure 48: Europe Flexible Foam Industry Volume (K Tons), by Type 2024 & 2032
- Figure 49: Europe Flexible Foam Industry Revenue Share (%), by Type 2024 & 2032
- Figure 50: Europe Flexible Foam Industry Volume Share (%), by Type 2024 & 2032
- Figure 51: Europe Flexible Foam Industry Revenue (Billion), by Application 2024 & 2032
- Figure 52: Europe Flexible Foam Industry Volume (K Tons), by Application 2024 & 2032
- Figure 53: Europe Flexible Foam Industry Revenue Share (%), by Application 2024 & 2032
- Figure 54: Europe Flexible Foam Industry Volume Share (%), by Application 2024 & 2032
- Figure 55: Europe Flexible Foam Industry Revenue (Billion), by Country 2024 & 2032
- Figure 56: Europe Flexible Foam Industry Volume (K Tons), by Country 2024 & 2032
- Figure 57: Europe Flexible Foam Industry Revenue Share (%), by Country 2024 & 2032
- Figure 58: Europe Flexible Foam Industry Volume Share (%), by Country 2024 & 2032
- Figure 59: South America Flexible Foam Industry Revenue (Billion), by Type 2024 & 2032
- Figure 60: South America Flexible Foam Industry Volume (K Tons), by Type 2024 & 2032
- Figure 61: South America Flexible Foam Industry Revenue Share (%), by Type 2024 & 2032
- Figure 62: South America Flexible Foam Industry Volume Share (%), by Type 2024 & 2032
- Figure 63: South America Flexible Foam Industry Revenue (Billion), by Application 2024 & 2032
- Figure 64: South America Flexible Foam Industry Volume (K Tons), by Application 2024 & 2032
- Figure 65: South America Flexible Foam Industry Revenue Share (%), by Application 2024 & 2032
- Figure 66: South America Flexible Foam Industry Volume Share (%), by Application 2024 & 2032
- Figure 67: South America Flexible Foam Industry Revenue (Billion), by Country 2024 & 2032
- Figure 68: South America Flexible Foam Industry Volume (K Tons), by Country 2024 & 2032
- Figure 69: South America Flexible Foam Industry Revenue Share (%), by Country 2024 & 2032
- Figure 70: South America Flexible Foam Industry Volume Share (%), by Country 2024 & 2032
- Figure 71: Middle East and Africa Flexible Foam Industry Revenue (Billion), by Type 2024 & 2032
- Figure 72: Middle East and Africa Flexible Foam Industry Volume (K Tons), by Type 2024 & 2032
- Figure 73: Middle East and Africa Flexible Foam Industry Revenue Share (%), by Type 2024 & 2032
- Figure 74: Middle East and Africa Flexible Foam Industry Volume Share (%), by Type 2024 & 2032
- Figure 75: Middle East and Africa Flexible Foam Industry Revenue (Billion), by Application 2024 & 2032
- Figure 76: Middle East and Africa Flexible Foam Industry Volume (K Tons), by Application 2024 & 2032
- Figure 77: Middle East and Africa Flexible Foam Industry Revenue Share (%), by Application 2024 & 2032
- Figure 78: Middle East and Africa Flexible Foam Industry Volume Share (%), by Application 2024 & 2032
- Figure 79: Middle East and Africa Flexible Foam Industry Revenue (Billion), by Country 2024 & 2032
- Figure 80: Middle East and Africa Flexible Foam Industry Volume (K Tons), by Country 2024 & 2032
- Figure 81: Middle East and Africa Flexible Foam Industry Revenue Share (%), by Country 2024 & 2032
- Figure 82: Middle East and Africa Flexible Foam Industry Volume Share (%), by Country 2024 & 2032
List of Tables
- Table 1: Global Flexible Foam Industry Revenue Billion Forecast, by Region 2019 & 2032
- Table 2: Global Flexible Foam Industry Volume K Tons Forecast, by Region 2019 & 2032
- Table 3: Global Flexible Foam Industry Revenue Billion Forecast, by Type 2019 & 2032
- Table 4: Global Flexible Foam Industry Volume K Tons Forecast, by Type 2019 & 2032
- Table 5: Global Flexible Foam Industry Revenue Billion Forecast, by Application 2019 & 2032
- Table 6: Global Flexible Foam Industry Volume K Tons Forecast, by Application 2019 & 2032
- Table 7: Global Flexible Foam Industry Revenue Billion Forecast, by Region 2019 & 2032
- Table 8: Global Flexible Foam Industry Volume K Tons Forecast, by Region 2019 & 2032
- Table 9: Global Flexible Foam Industry Revenue Billion Forecast, by Country 2019 & 2032
- Table 10: Global Flexible Foam Industry Volume K Tons Forecast, by Country 2019 & 2032
- Table 11: United States Flexible Foam Industry Revenue (Billion) Forecast, by Application 2019 & 2032
- Table 12: United States Flexible Foam Industry Volume (K Tons) Forecast, by Application 2019 & 2032
- Table 13: Canada Flexible Foam Industry Revenue (Billion) Forecast, by Application 2019 & 2032
- Table 14: Canada Flexible Foam Industry Volume (K Tons) Forecast, by Application 2019 & 2032
- Table 15: Mexico Flexible Foam Industry Revenue (Billion) Forecast, by Application 2019 & 2032
- Table 16: Mexico Flexible Foam Industry Volume (K Tons) Forecast, by Application 2019 & 2032
- Table 17: Global Flexible Foam Industry Revenue Billion Forecast, by Country 2019 & 2032
- Table 18: Global Flexible Foam Industry Volume K Tons Forecast, by Country 2019 & 2032
- Table 19: Germany Flexible Foam Industry Revenue (Billion) Forecast, by Application 2019 & 2032
- Table 20: Germany Flexible Foam Industry Volume (K Tons) Forecast, by Application 2019 & 2032
- Table 21: France Flexible Foam Industry Revenue (Billion) Forecast, by Application 2019 & 2032
- Table 22: France Flexible Foam Industry Volume (K Tons) Forecast, by Application 2019 & 2032
- Table 23: Italy Flexible Foam Industry Revenue (Billion) Forecast, by Application 2019 & 2032
- Table 24: Italy Flexible Foam Industry Volume (K Tons) Forecast, by Application 2019 & 2032
- Table 25: United Kingdom Flexible Foam Industry Revenue (Billion) Forecast, by Application 2019 & 2032
- Table 26: United Kingdom Flexible Foam Industry Volume (K Tons) Forecast, by Application 2019 & 2032
- Table 27: Netherlands Flexible Foam Industry Revenue (Billion) Forecast, by Application 2019 & 2032
- Table 28: Netherlands Flexible Foam Industry Volume (K Tons) Forecast, by Application 2019 & 2032
- Table 29: Rest of Europe Flexible Foam Industry Revenue (Billion) Forecast, by Application 2019 & 2032
- Table 30: Rest of Europe Flexible Foam Industry Volume (K Tons) Forecast, by Application 2019 & 2032
- Table 31: Global Flexible Foam Industry Revenue Billion Forecast, by Country 2019 & 2032
- Table 32: Global Flexible Foam Industry Volume K Tons Forecast, by Country 2019 & 2032
- Table 33: China Flexible Foam Industry Revenue (Billion) Forecast, by Application 2019 & 2032
- Table 34: China Flexible Foam Industry Volume (K Tons) Forecast, by Application 2019 & 2032
- Table 35: Japan Flexible Foam Industry Revenue (Billion) Forecast, by Application 2019 & 2032
- Table 36: Japan Flexible Foam Industry Volume (K Tons) Forecast, by Application 2019 & 2032
- Table 37: India Flexible Foam Industry Revenue (Billion) Forecast, by Application 2019 & 2032
- Table 38: India Flexible Foam Industry Volume (K Tons) Forecast, by Application 2019 & 2032
- Table 39: South Korea Flexible Foam Industry Revenue (Billion) Forecast, by Application 2019 & 2032
- Table 40: South Korea Flexible Foam Industry Volume (K Tons) Forecast, by Application 2019 & 2032
- Table 41: Taiwan Flexible Foam Industry Revenue (Billion) Forecast, by Application 2019 & 2032
- Table 42: Taiwan Flexible Foam Industry Volume (K Tons) Forecast, by Application 2019 & 2032
- Table 43: Australia Flexible Foam Industry Revenue (Billion) Forecast, by Application 2019 & 2032
- Table 44: Australia Flexible Foam Industry Volume (K Tons) Forecast, by Application 2019 & 2032
- Table 45: Rest of Asia-Pacific Flexible Foam Industry Revenue (Billion) Forecast, by Application 2019 & 2032
- Table 46: Rest of Asia-Pacific Flexible Foam Industry Volume (K Tons) Forecast, by Application 2019 & 2032
- Table 47: Global Flexible Foam Industry Revenue Billion Forecast, by Country 2019 & 2032
- Table 48: Global Flexible Foam Industry Volume K Tons Forecast, by Country 2019 & 2032
- Table 49: Brazil Flexible Foam Industry Revenue (Billion) Forecast, by Application 2019 & 2032
- Table 50: Brazil Flexible Foam Industry Volume (K Tons) Forecast, by Application 2019 & 2032
- Table 51: Argentina Flexible Foam Industry Revenue (Billion) Forecast, by Application 2019 & 2032
- Table 52: Argentina Flexible Foam Industry Volume (K Tons) Forecast, by Application 2019 & 2032
- Table 53: Rest of South America Flexible Foam Industry Revenue (Billion) Forecast, by Application 2019 & 2032
- Table 54: Rest of South America Flexible Foam Industry Volume (K Tons) Forecast, by Application 2019 & 2032
- Table 55: Global Flexible Foam Industry Revenue Billion Forecast, by Country 2019 & 2032
- Table 56: Global Flexible Foam Industry Volume K Tons Forecast, by Country 2019 & 2032
- Table 57: Middle East Flexible Foam Industry Revenue (Billion) Forecast, by Application 2019 & 2032
- Table 58: Middle East Flexible Foam Industry Volume (K Tons) Forecast, by Application 2019 & 2032
- Table 59: Africa Flexible Foam Industry Revenue (Billion) Forecast, by Application 2019 & 2032
- Table 60: Africa Flexible Foam Industry Volume (K Tons) Forecast, by Application 2019 & 2032
- Table 61: Global Flexible Foam Industry Revenue Billion Forecast, by Type 2019 & 2032
- Table 62: Global Flexible Foam Industry Volume K Tons Forecast, by Type 2019 & 2032
- Table 63: Global Flexible Foam Industry Revenue Billion Forecast, by Application 2019 & 2032
- Table 64: Global Flexible Foam Industry Volume K Tons Forecast, by Application 2019 & 2032
- Table 65: Global Flexible Foam Industry Revenue Billion Forecast, by Country 2019 & 2032
- Table 66: Global Flexible Foam Industry Volume K Tons Forecast, by Country 2019 & 2032
- Table 67: China Flexible Foam Industry Revenue (Billion) Forecast, by Application 2019 & 2032
- Table 68: China Flexible Foam Industry Volume (K Tons) Forecast, by Application 2019 & 2032
- Table 69: India Flexible Foam Industry Revenue (Billion) Forecast, by Application 2019 & 2032
- Table 70: India Flexible Foam Industry Volume (K Tons) Forecast, by Application 2019 & 2032
- Table 71: Japan Flexible Foam Industry Revenue (Billion) Forecast, by Application 2019 & 2032
- Table 72: Japan Flexible Foam Industry Volume (K Tons) Forecast, by Application 2019 & 2032
- Table 73: South Korea Flexible Foam Industry Revenue (Billion) Forecast, by Application 2019 & 2032
- Table 74: South Korea Flexible Foam Industry Volume (K Tons) Forecast, by Application 2019 & 2032
- Table 75: Rest of Asia Pacific Flexible Foam Industry Revenue (Billion) Forecast, by Application 2019 & 2032
- Table 76: Rest of Asia Pacific Flexible Foam Industry Volume (K Tons) Forecast, by Application 2019 & 2032
- Table 77: Global Flexible Foam Industry Revenue Billion Forecast, by Type 2019 & 2032
- Table 78: Global Flexible Foam Industry Volume K Tons Forecast, by Type 2019 & 2032
- Table 79: Global Flexible Foam Industry Revenue Billion Forecast, by Application 2019 & 2032
- Table 80: Global Flexible Foam Industry Volume K Tons Forecast, by Application 2019 & 2032
- Table 81: Global Flexible Foam Industry Revenue Billion Forecast, by Country 2019 & 2032
- Table 82: Global Flexible Foam Industry Volume K Tons Forecast, by Country 2019 & 2032
- Table 83: United States Flexible Foam Industry Revenue (Billion) Forecast, by Application 2019 & 2032
- Table 84: United States Flexible Foam Industry Volume (K Tons) Forecast, by Application 2019 & 2032
- Table 85: Canada Flexible Foam Industry Revenue (Billion) Forecast, by Application 2019 & 2032
- Table 86: Canada Flexible Foam Industry Volume (K Tons) Forecast, by Application 2019 & 2032
- Table 87: Mexico Flexible Foam Industry Revenue (Billion) Forecast, by Application 2019 & 2032
- Table 88: Mexico Flexible Foam Industry Volume (K Tons) Forecast, by Application 2019 & 2032
- Table 89: Global Flexible Foam Industry Revenue Billion Forecast, by Type 2019 & 2032
- Table 90: Global Flexible Foam Industry Volume K Tons Forecast, by Type 2019 & 2032
- Table 91: Global Flexible Foam Industry Revenue Billion Forecast, by Application 2019 & 2032
- Table 92: Global Flexible Foam Industry Volume K Tons Forecast, by Application 2019 & 2032
- Table 93: Global Flexible Foam Industry Revenue Billion Forecast, by Country 2019 & 2032
- Table 94: Global Flexible Foam Industry Volume K Tons Forecast, by Country 2019 & 2032
- Table 95: Germany Flexible Foam Industry Revenue (Billion) Forecast, by Application 2019 & 2032
- Table 96: Germany Flexible Foam Industry Volume (K Tons) Forecast, by Application 2019 & 2032
- Table 97: United Kingdom Flexible Foam Industry Revenue (Billion) Forecast, by Application 2019 & 2032
- Table 98: United Kingdom Flexible Foam Industry Volume (K Tons) Forecast, by Application 2019 & 2032
- Table 99: Italy Flexible Foam Industry Revenue (Billion) Forecast, by Application 2019 & 2032
- Table 100: Italy Flexible Foam Industry Volume (K Tons) Forecast, by Application 2019 & 2032
- Table 101: France Flexible Foam Industry Revenue (Billion) Forecast, by Application 2019 & 2032
- Table 102: France Flexible Foam Industry Volume (K Tons) Forecast, by Application 2019 & 2032
- Table 103: Rest of Europe Flexible Foam Industry Revenue (Billion) Forecast, by Application 2019 & 2032
- Table 104: Rest of Europe Flexible Foam Industry Volume (K Tons) Forecast, by Application 2019 & 2032
- Table 105: Global Flexible Foam Industry Revenue Billion Forecast, by Type 2019 & 2032
- Table 106: Global Flexible Foam Industry Volume K Tons Forecast, by Type 2019 & 2032
- Table 107: Global Flexible Foam Industry Revenue Billion Forecast, by Application 2019 & 2032
- Table 108: Global Flexible Foam Industry Volume K Tons Forecast, by Application 2019 & 2032
- Table 109: Global Flexible Foam Industry Revenue Billion Forecast, by Country 2019 & 2032
- Table 110: Global Flexible Foam Industry Volume K Tons Forecast, by Country 2019 & 2032
- Table 111: Brazil Flexible Foam Industry Revenue (Billion) Forecast, by Application 2019 & 2032
- Table 112: Brazil Flexible Foam Industry Volume (K Tons) Forecast, by Application 2019 & 2032
- Table 113: Argentina Flexible Foam Industry Revenue (Billion) Forecast, by Application 2019 & 2032
- Table 114: Argentina Flexible Foam Industry Volume (K Tons) Forecast, by Application 2019 & 2032
- Table 115: Rest of South America Flexible Foam Industry Revenue (Billion) Forecast, by Application 2019 & 2032
- Table 116: Rest of South America Flexible Foam Industry Volume (K Tons) Forecast, by Application 2019 & 2032
- Table 117: Global Flexible Foam Industry Revenue Billion Forecast, by Type 2019 & 2032
- Table 118: Global Flexible Foam Industry Volume K Tons Forecast, by Type 2019 & 2032
- Table 119: Global Flexible Foam Industry Revenue Billion Forecast, by Application 2019 & 2032
- Table 120: Global Flexible Foam Industry Volume K Tons Forecast, by Application 2019 & 2032
- Table 121: Global Flexible Foam Industry Revenue Billion Forecast, by Country 2019 & 2032
- Table 122: Global Flexible Foam Industry Volume K Tons Forecast, by Country 2019 & 2032
- Table 123: Saudi Arabia Flexible Foam Industry Revenue (Billion) Forecast, by Application 2019 & 2032
- Table 124: Saudi Arabia Flexible Foam Industry Volume (K Tons) Forecast, by Application 2019 & 2032
- Table 125: South Africa Flexible Foam Industry Revenue (Billion) Forecast, by Application 2019 & 2032
- Table 126: South Africa Flexible Foam Industry Volume (K Tons) Forecast, by Application 2019 & 2032
- Table 127: Rest of Middle East and Africa Flexible Foam Industry Revenue (Billion) Forecast, by Application 2019 & 2032
- Table 128: Rest of Middle East and Africa Flexible Foam Industry Volume (K Tons) Forecast, by Application 2019 & 2032
Frequently Asked Questions
1. What is the projected Compound Annual Growth Rate (CAGR) of the Flexible Foam Industry?
The projected CAGR is approximately 5.5%.
2. Which companies are prominent players in the Flexible Foam Industry?
Key companies in the market include Carpenter Co, ORSA foam SpA, Wm T Burnett & Co, Recticel NV/SA, KANEKA CORPORATION, Rogers Corporation, BASF SE, Huntsman International LLC, Dow, Inoac Corporation, Woodbridge, Greiner AG, SEKISUI CHEMICAL CO LTD, Sheela Foam Ltd, American Excelsior Company, Covestro AG, Changzhou Xingang Plastic Products Co Ltd.
3. What are the main segments of the Flexible Foam Industry?
The market segments include Type, Application.
4. Can you provide details about the market size?
The market size is estimated to be USD 41.4 Billion as of 2022.
5. What are some drivers contributing to market growth?
Growing Demand of Flexible Foam in Packaging; Increasing Demand for Flexible Foam in Carpet Cushion; Other Drivers.
6. What are the notable trends driving market growth?
Growing Demand for Flexible Foam in Furniture Industry.
7. Are there any restraints impacting market growth?
Environmental Degradation while Fabrication; Other Restraints.
8. Can you provide examples of recent developments in the market?
July 2022: William T. Burnett & Co. acquired Flex Foam, the first polyurethane foam manufacturer in Arizona, which will help them in growing Flex Foam's existing business and also in expanding their own ability to produce specialty urethane foams in Phoenix that would meet exacting technical specifications for use in a wide range of industries.
9. What pricing options are available for accessing the report?
Pricing options include single-user, multi-user, and enterprise licenses priced at USD 4750, USD 5250, and USD 8750 respectively.
10. Is the market size provided in terms of value or volume?
The market size is provided in terms of value, measured in Billion and volume, measured in K Tons.
11. Are there any specific market keywords associated with the report?
Yes, the market keyword associated with the report is "Flexible Foam Industry," which aids in identifying and referencing the specific market segment covered.
12. How do I determine which pricing option suits my needs best?
The pricing options vary based on user requirements and access needs. Individual users may opt for single-user licenses, while businesses requiring broader access may choose multi-user or enterprise licenses for cost-effective access to the report.
13. Are there any additional resources or data provided in the Flexible Foam Industry report?
While the report offers comprehensive insights, it's advisable to review the specific contents or supplementary materials provided to ascertain if additional resources or data are available.
14. How can I stay updated on further developments or reports in the Flexible Foam Industry?
To stay informed about further developments, trends, and reports in the Flexible Foam Industry, consider subscribing to industry newsletters, following relevant companies and organizations, or regularly checking reputable industry news sources and publications.
Methodology
Step 1 - Identification of Relevant Samples Size from Population Database


Step 2 - Approaches for Defining Global Market Size (Value, Volume* & Price*)

Note*: In applicable scenarios
Step 3 - Data Sources
Primary Research
- Web Analytics
- Survey Reports
- Research Institute
- Latest Research Reports
- Opinion Leaders
Secondary Research
- Annual Reports
- White Paper
- Latest Press Release
- Industry Association
- Paid Database
- Investor Presentations

Step 4 - Data Triangulation
Involves using different sources of information in order to increase the validity of a study
These sources are likely to be stakeholders in a program - participants, other researchers, program staff, other community members, and so on.
Then we put all data in single framework & apply various statistical tools to find out the dynamic on the market.
During the analysis stage, feedback from the stakeholder groups would be compared to determine areas of agreement as well as areas of divergence
