

Key Insights
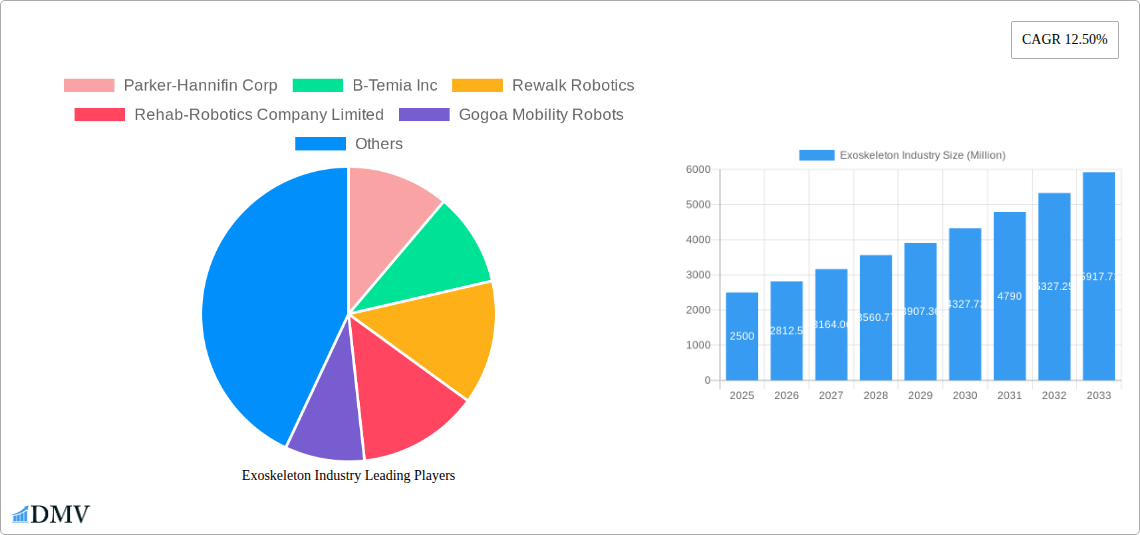
The global exoskeleton market is experiencing robust growth, projected to reach a substantial size driven by several key factors. The aging global population, increasing prevalence of neurological disorders like stroke and spinal cord injuries, and the rising demand for rehabilitation solutions are major contributors to this expansion. Technological advancements, including improved sensor technology, more intuitive control systems, and lighter, more comfortable designs, are further fueling market growth. The market's segmentation reflects diverse applications: rehabilitation exoskeletons are seeing significant adoption in physical therapy settings, while augmentation exoskeletons are finding niches in industrial applications demanding enhanced strength and endurance. Upper body exoskeletons are currently more prevalent than lower body due to established applications in manufacturing and healthcare, however, lower body exoskeletons are witnessing rapid growth fueled by advancements in powered gait assistance. The market is further divided based on product type, with stationary exoskeletons primarily used in rehabilitation centers and mobile exoskeletons providing greater flexibility and mobility for users. This differentiation contributes to a dynamic landscape offering varied solutions for different user needs and settings. North America currently dominates the market due to high healthcare spending and robust technological infrastructure. However, Asia-Pacific is poised for significant growth in the coming years due to its large population and rapidly expanding healthcare sector. Competition is fierce, with established players like Parker-Hannifin and Ekso Bionics competing with emerging innovative companies such as B-Temia and Rewalk Robotics. The market is expected to continue its upward trajectory, driven by ongoing technological innovation and increasing demand across diverse sectors.
The 12.50% CAGR projected through 2033 signifies a substantial increase in market value over the forecast period. While precise figures are unavailable, considering the current market size and CAGR, a logical estimation points to significant expansion within specific segments. For instance, the rehabilitation segment is likely to witness substantial growth due to its direct correlation with the aging population and rising healthcare expenditure. Similarly, the mobile exoskeleton segment is expected to outpace the stationary segment as technological advancements enable greater portability and user-friendliness. Regional variations will also influence growth; for example, the Asia-Pacific region's considerable population and expanding healthcare infrastructure suggest potential for faster growth compared to already mature markets like North America. Ongoing research and development are crucial to address existing limitations, such as cost, weight, and battery life, thus fostering wider adoption and shaping the future trajectory of the exoskeleton market.
Exoskeleton Industry Market Report: 2019-2033
This comprehensive report provides a detailed analysis of the global exoskeleton industry, projecting robust growth from $XX Million in 2025 to $XX Million by 2033. It offers invaluable insights for stakeholders, investors, and industry professionals seeking to understand market dynamics, technological advancements, and future opportunities within this rapidly evolving sector. The report covers the period 2019-2033, with a focus on 2025 as the base and estimated year.
Exoskeleton Industry Market Composition & Trends
The exoskeleton market is characterized by moderate concentration, with key players like Parker-Hannifin Corp, Ekso Bionics Holdings, and Cyberdyne Inc holding significant market share. However, a dynamic landscape with numerous smaller, innovative companies fuels competition. Innovation is driven by advancements in materials science, robotics, and sensor technology, leading to lighter, more powerful, and user-friendly exoskeletons. Regulatory landscapes vary significantly across regions, impacting adoption rates. Substitute products, such as traditional mobility aids, remain competitive, particularly in cost-sensitive markets. The primary end-users are healthcare providers, industrial workers, and military personnel. M&A activity has been moderate, with deal values ranging from $XX Million to $XX Million in recent years, reflecting strategic consolidation and technological integration efforts.
- Market Share Distribution (2025): Parker-Hannifin Corp (XX%), Ekso Bionics Holdings (XX%), Cyberdyne Inc (XX%), Others (XX%)
- Recent M&A Activities: [Insert details of significant M&A deals with deal values]
Exoskeleton Industry Evolution
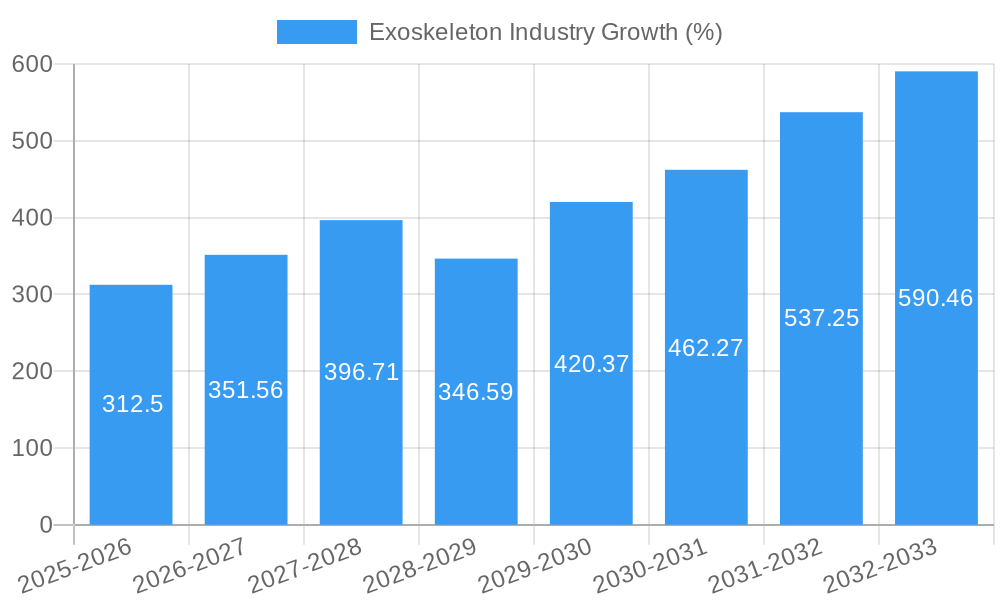
The exoskeleton market has witnessed remarkable growth over the historical period (2019-2024), driven by technological breakthroughs and increasing demand across various sectors. The Compound Annual Growth Rate (CAGR) from 2019 to 2024 was approximately XX%, and a CAGR of XX% is projected from 2025 to 2033. This growth is fueled by factors such as an aging global population requiring rehabilitation solutions, the rise of industrial automation necessitating enhanced worker capabilities, and military applications emphasizing enhanced soldier performance. Advancements in lightweight materials, AI-powered control systems, and improved human-machine interfaces are continuously enhancing the functionality and user experience of exoskeletons. Consumer demands are shifting towards more affordable, adaptable, and comfortable devices. Adoption rates are increasing across healthcare settings, with notable progress in rehabilitation therapies and assistive technologies. The market is also witnessing a growing interest in exoskeletons for augmentation purposes, expanding beyond rehabilitation applications.
Leading Regions, Countries, or Segments in Exoskeleton Industry
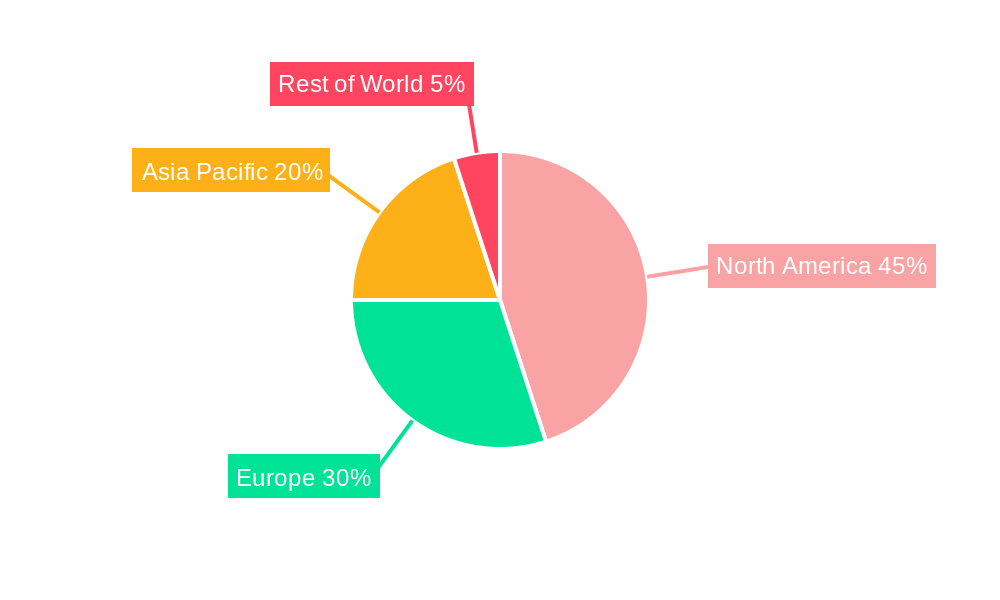
North America currently holds the largest market share, driven by high healthcare spending, robust technological innovation, and supportive regulatory environments. Within treatment types, rehabilitation dominates the market, followed by augmentation. Lower body exoskeletons account for the largest segment by body part type, owing to the significant demand for mobility assistance. Mobile exoskeletons are gaining popularity over stationary ones due to their versatility and real-world applicability.
- Key Drivers in North America: Strong R&D investments, favorable regulatory frameworks, high healthcare expenditure, early adoption by hospitals and rehabilitation centers.
- Dominance Factors: High disposable income, advanced healthcare infrastructure, strong technological expertise, proactive government support for medical technology innovation.
Exoskeleton Industry Product Innovations
Recent innovations include the development of soft exoskeletons, offering greater comfort and flexibility compared to rigid designs. Advancements in sensor technology enable more precise movement detection and control, improving responsiveness and effectiveness. The integration of AI and machine learning algorithms is enhancing exoskeleton performance, allowing for personalized adaptation and optimized assistance. Unique selling propositions include improved ergonomics, lightweight designs, increased power output, and enhanced user interfaces.
Propelling Factors for Exoskeleton Industry Growth
Several factors contribute to the industry's growth. Technological advancements, including improved battery life, more compact designs, and enhanced sensor technology, are making exoskeletons more practical and affordable. The increasing prevalence of age-related disabilities and workplace injuries are driving demand for rehabilitation and assistive technologies. Furthermore, government initiatives and funding programs promoting technological innovation are accelerating market expansion.
Obstacles in the Exoskeleton Industry Market
High costs, particularly for advanced models, remain a significant barrier to widespread adoption. Regulatory hurdles and varying approval processes across countries create challenges for market penetration. Supply chain disruptions and the availability of specialized components can impact production and lead times. Intense competition from established players and emerging startups creates price pressures and necessitates continuous innovation.
Future Opportunities in Exoskeleton Industry
Emerging markets, particularly in Asia and developing economies, represent significant growth potential. The integration of exoskeletons with virtual reality (VR) and augmented reality (AR) technologies offers exciting possibilities for rehabilitation and training. Miniaturization and improved comfort will drive adoption across broader applications, including personal use.
Major Players in the Exoskeleton Industry Ecosystem
- Parker-Hannifin Corp
- B-Temia Inc
- Rewalk Robotics
- Rehab-Robotics Company Limited
- Gogoa Mobility Robots
- Bioservo Technologies AB
- Bionik Laboratories Corp
- Cyberdyne Inc
- Ekso Bionics Holdings
- Bioness Inc
Key Developments in Exoskeleton Industry
- [Month, Year]: Launch of a new lightweight exoskeleton by [Company Name], significantly reducing weight and improving user comfort.
- [Month, Year]: Acquisition of [Company A] by [Company B], expanding market reach and product portfolio.
- [Month, Year]: FDA approval of a new exoskeleton for [specific application], increasing market accessibility.
- [Add more bullet points with relevant dates and details]
Strategic Exoskeleton Industry Market Forecast
The exoskeleton market is poised for significant growth, driven by continuous technological advancements, expanding applications across healthcare, industry, and defense, and increasing regulatory support. The focus on developing more affordable, adaptable, and user-friendly exoskeletons will further broaden market penetration. The integration of AI and other advanced technologies will enhance functionality and drive adoption across various sectors. The global market is expected to experience substantial growth, creating significant opportunities for both established players and new entrants.
Exoskeleton Industry Segmentation
-
1. Treatment Type
- 1.1. Rehabilitation
- 1.2. Augmentation
-
2. Body Part Type
- 2.1. Upper Body
- 2.2. Lower Body
-
3. Product Type
- 3.1. Stationary
- 3.2. Mobile
Exoskeleton Industry Segmentation By Geography
-
1. North America
- 1.1. United States
- 1.2. Canada
- 1.3. Mexico
-
2. Europe
- 2.1. Germany
- 2.2. United Kingdom
- 2.3. France
- 2.4. Italy
- 2.5. Spain
- 2.6. Rest of Europe
-
3. Asia Pacific
- 3.1. China
- 3.2. Japan
- 3.3. India
- 3.4. Australia
- 3.5. South Korea
- 3.6. Rest of Asia Pacific
-
4. Middle East and Africa
- 4.1. GCC
- 4.2. South Africa
- 4.3. Rest of Middle East and Africa
-
5. South America
- 5.1. Brazil
- 5.2. Argentina
- 5.3. Rest of South America
Exoskeleton Industry REPORT HIGHLIGHTS
| Aspects | Details |
|---|---|
| Study Period | 2019-2033 |
| Base Year | 2024 |
| Estimated Year | 2025 |
| Forecast Period | 2025-2033 |
| Historical Period | 2019-2024 |
| Growth Rate | CAGR of 12.50% from 2019-2033 |
| Segmentation |
|
Table of Contents
- 1. Introduction
- 1.1. Research Scope
- 1.2. Market Segmentation
- 1.3. Research Methodology
- 1.4. Definitions and Assumptions
- 2. Executive Summary
- 2.1. Introduction
- 3. Market Dynamics
- 3.1. Introduction
- 3.2. Market Drivers
- 3.2.1. Growing Demand from Healthcare Sector for Robotic Rehabilitation; Advancement in Robotic Technologies; Huge Investment for the Development of the Exoskeleton Technology
- 3.3. Market Restrains
- 3.3.1. Risks Involved with Using Exoskeletons Due to Vague Safety Guidelines
- 3.4. Market Trends
- 3.4.1. The Mobile Segment is Expected to Hold the Largest Share by Product Type Over the Forecast Period
- 4. Market Factor Analysis
- 4.1. Porters Five Forces
- 4.2. Supply/Value Chain
- 4.3. PESTEL analysis
- 4.4. Market Entropy
- 4.5. Patent/Trademark Analysis
- 5. Global Exoskeleton Industry Analysis, Insights and Forecast, 2019-2031
- 5.1. Market Analysis, Insights and Forecast - by Treatment Type
- 5.1.1. Rehabilitation
- 5.1.2. Augmentation
- 5.2. Market Analysis, Insights and Forecast - by Body Part Type
- 5.2.1. Upper Body
- 5.2.2. Lower Body
- 5.3. Market Analysis, Insights and Forecast - by Product Type
- 5.3.1. Stationary
- 5.3.2. Mobile
- 5.4. Market Analysis, Insights and Forecast - by Region
- 5.4.1. North America
- 5.4.2. Europe
- 5.4.3. Asia Pacific
- 5.4.4. Middle East and Africa
- 5.4.5. South America
- 5.1. Market Analysis, Insights and Forecast - by Treatment Type
- 6. North America Exoskeleton Industry Analysis, Insights and Forecast, 2019-2031
- 6.1. Market Analysis, Insights and Forecast - by Treatment Type
- 6.1.1. Rehabilitation
- 6.1.2. Augmentation
- 6.2. Market Analysis, Insights and Forecast - by Body Part Type
- 6.2.1. Upper Body
- 6.2.2. Lower Body
- 6.3. Market Analysis, Insights and Forecast - by Product Type
- 6.3.1. Stationary
- 6.3.2. Mobile
- 6.1. Market Analysis, Insights and Forecast - by Treatment Type
- 7. Europe Exoskeleton Industry Analysis, Insights and Forecast, 2019-2031
- 7.1. Market Analysis, Insights and Forecast - by Treatment Type
- 7.1.1. Rehabilitation
- 7.1.2. Augmentation
- 7.2. Market Analysis, Insights and Forecast - by Body Part Type
- 7.2.1. Upper Body
- 7.2.2. Lower Body
- 7.3. Market Analysis, Insights and Forecast - by Product Type
- 7.3.1. Stationary
- 7.3.2. Mobile
- 7.1. Market Analysis, Insights and Forecast - by Treatment Type
- 8. Asia Pacific Exoskeleton Industry Analysis, Insights and Forecast, 2019-2031
- 8.1. Market Analysis, Insights and Forecast - by Treatment Type
- 8.1.1. Rehabilitation
- 8.1.2. Augmentation
- 8.2. Market Analysis, Insights and Forecast - by Body Part Type
- 8.2.1. Upper Body
- 8.2.2. Lower Body
- 8.3. Market Analysis, Insights and Forecast - by Product Type
- 8.3.1. Stationary
- 8.3.2. Mobile
- 8.1. Market Analysis, Insights and Forecast - by Treatment Type
- 9. Middle East and Africa Exoskeleton Industry Analysis, Insights and Forecast, 2019-2031
- 9.1. Market Analysis, Insights and Forecast - by Treatment Type
- 9.1.1. Rehabilitation
- 9.1.2. Augmentation
- 9.2. Market Analysis, Insights and Forecast - by Body Part Type
- 9.2.1. Upper Body
- 9.2.2. Lower Body
- 9.3. Market Analysis, Insights and Forecast - by Product Type
- 9.3.1. Stationary
- 9.3.2. Mobile
- 9.1. Market Analysis, Insights and Forecast - by Treatment Type
- 10. South America Exoskeleton Industry Analysis, Insights and Forecast, 2019-2031
- 10.1. Market Analysis, Insights and Forecast - by Treatment Type
- 10.1.1. Rehabilitation
- 10.1.2. Augmentation
- 10.2. Market Analysis, Insights and Forecast - by Body Part Type
- 10.2.1. Upper Body
- 10.2.2. Lower Body
- 10.3. Market Analysis, Insights and Forecast - by Product Type
- 10.3.1. Stationary
- 10.3.2. Mobile
- 10.1. Market Analysis, Insights and Forecast - by Treatment Type
- 11. North America Exoskeleton Industry Analysis, Insights and Forecast, 2019-2031
- 11.1. Market Analysis, Insights and Forecast - By Country/Sub-region
- 11.1.1 United States
- 11.1.2 Canada
- 11.1.3 Mexico
- 12. Europe Exoskeleton Industry Analysis, Insights and Forecast, 2019-2031
- 12.1. Market Analysis, Insights and Forecast - By Country/Sub-region
- 12.1.1 Germany
- 12.1.2 United Kingdom
- 12.1.3 France
- 12.1.4 Italy
- 12.1.5 Spain
- 12.1.6 Rest of Europe
- 13. Asia Pacific Exoskeleton Industry Analysis, Insights and Forecast, 2019-2031
- 13.1. Market Analysis, Insights and Forecast - By Country/Sub-region
- 13.1.1 China
- 13.1.2 Japan
- 13.1.3 India
- 13.1.4 Australia
- 13.1.5 South Korea
- 13.1.6 Rest of Asia Pacific
- 14. Middle East and Africa Exoskeleton Industry Analysis, Insights and Forecast, 2019-2031
- 14.1. Market Analysis, Insights and Forecast - By Country/Sub-region
- 14.1.1 GCC
- 14.1.2 South Africa
- 14.1.3 Rest of Middle East and Africa
- 15. South America Exoskeleton Industry Analysis, Insights and Forecast, 2019-2031
- 15.1. Market Analysis, Insights and Forecast - By Country/Sub-region
- 15.1.1 Brazil
- 15.1.2 Argentina
- 15.1.3 Rest of South America
- 16. Competitive Analysis
- 16.1. Global Market Share Analysis 2024
- 16.2. Company Profiles
- 16.2.1 Parker-Hannifin Corp
- 16.2.1.1. Overview
- 16.2.1.2. Products
- 16.2.1.3. SWOT Analysis
- 16.2.1.4. Recent Developments
- 16.2.1.5. Financials (Based on Availability)
- 16.2.2 B-Temia Inc
- 16.2.2.1. Overview
- 16.2.2.2. Products
- 16.2.2.3. SWOT Analysis
- 16.2.2.4. Recent Developments
- 16.2.2.5. Financials (Based on Availability)
- 16.2.3 Rewalk Robotics
- 16.2.3.1. Overview
- 16.2.3.2. Products
- 16.2.3.3. SWOT Analysis
- 16.2.3.4. Recent Developments
- 16.2.3.5. Financials (Based on Availability)
- 16.2.4 Rehab-Robotics Company Limited
- 16.2.4.1. Overview
- 16.2.4.2. Products
- 16.2.4.3. SWOT Analysis
- 16.2.4.4. Recent Developments
- 16.2.4.5. Financials (Based on Availability)
- 16.2.5 Gogoa Mobility Robots
- 16.2.5.1. Overview
- 16.2.5.2. Products
- 16.2.5.3. SWOT Analysis
- 16.2.5.4. Recent Developments
- 16.2.5.5. Financials (Based on Availability)
- 16.2.6 Bioservo Technologies AB
- 16.2.6.1. Overview
- 16.2.6.2. Products
- 16.2.6.3. SWOT Analysis
- 16.2.6.4. Recent Developments
- 16.2.6.5. Financials (Based on Availability)
- 16.2.7 Bionik Laboratories Corp
- 16.2.7.1. Overview
- 16.2.7.2. Products
- 16.2.7.3. SWOT Analysis
- 16.2.7.4. Recent Developments
- 16.2.7.5. Financials (Based on Availability)
- 16.2.8 Cyberdyne Inc
- 16.2.8.1. Overview
- 16.2.8.2. Products
- 16.2.8.3. SWOT Analysis
- 16.2.8.4. Recent Developments
- 16.2.8.5. Financials (Based on Availability)
- 16.2.9 Ekso Bionics Holdings
- 16.2.9.1. Overview
- 16.2.9.2. Products
- 16.2.9.3. SWOT Analysis
- 16.2.9.4. Recent Developments
- 16.2.9.5. Financials (Based on Availability)
- 16.2.10 Bioness Inc
- 16.2.10.1. Overview
- 16.2.10.2. Products
- 16.2.10.3. SWOT Analysis
- 16.2.10.4. Recent Developments
- 16.2.10.5. Financials (Based on Availability)
- 16.2.1 Parker-Hannifin Corp
List of Figures
- Figure 1: Global Exoskeleton Industry Revenue Breakdown (Million, %) by Region 2024 & 2032
- Figure 2: North America Exoskeleton Industry Revenue (Million), by Country 2024 & 2032
- Figure 3: North America Exoskeleton Industry Revenue Share (%), by Country 2024 & 2032
- Figure 4: Europe Exoskeleton Industry Revenue (Million), by Country 2024 & 2032
- Figure 5: Europe Exoskeleton Industry Revenue Share (%), by Country 2024 & 2032
- Figure 6: Asia Pacific Exoskeleton Industry Revenue (Million), by Country 2024 & 2032
- Figure 7: Asia Pacific Exoskeleton Industry Revenue Share (%), by Country 2024 & 2032
- Figure 8: Middle East and Africa Exoskeleton Industry Revenue (Million), by Country 2024 & 2032
- Figure 9: Middle East and Africa Exoskeleton Industry Revenue Share (%), by Country 2024 & 2032
- Figure 10: South America Exoskeleton Industry Revenue (Million), by Country 2024 & 2032
- Figure 11: South America Exoskeleton Industry Revenue Share (%), by Country 2024 & 2032
- Figure 12: North America Exoskeleton Industry Revenue (Million), by Treatment Type 2024 & 2032
- Figure 13: North America Exoskeleton Industry Revenue Share (%), by Treatment Type 2024 & 2032
- Figure 14: North America Exoskeleton Industry Revenue (Million), by Body Part Type 2024 & 2032
- Figure 15: North America Exoskeleton Industry Revenue Share (%), by Body Part Type 2024 & 2032
- Figure 16: North America Exoskeleton Industry Revenue (Million), by Product Type 2024 & 2032
- Figure 17: North America Exoskeleton Industry Revenue Share (%), by Product Type 2024 & 2032
- Figure 18: North America Exoskeleton Industry Revenue (Million), by Country 2024 & 2032
- Figure 19: North America Exoskeleton Industry Revenue Share (%), by Country 2024 & 2032
- Figure 20: Europe Exoskeleton Industry Revenue (Million), by Treatment Type 2024 & 2032
- Figure 21: Europe Exoskeleton Industry Revenue Share (%), by Treatment Type 2024 & 2032
- Figure 22: Europe Exoskeleton Industry Revenue (Million), by Body Part Type 2024 & 2032
- Figure 23: Europe Exoskeleton Industry Revenue Share (%), by Body Part Type 2024 & 2032
- Figure 24: Europe Exoskeleton Industry Revenue (Million), by Product Type 2024 & 2032
- Figure 25: Europe Exoskeleton Industry Revenue Share (%), by Product Type 2024 & 2032
- Figure 26: Europe Exoskeleton Industry Revenue (Million), by Country 2024 & 2032
- Figure 27: Europe Exoskeleton Industry Revenue Share (%), by Country 2024 & 2032
- Figure 28: Asia Pacific Exoskeleton Industry Revenue (Million), by Treatment Type 2024 & 2032
- Figure 29: Asia Pacific Exoskeleton Industry Revenue Share (%), by Treatment Type 2024 & 2032
- Figure 30: Asia Pacific Exoskeleton Industry Revenue (Million), by Body Part Type 2024 & 2032
- Figure 31: Asia Pacific Exoskeleton Industry Revenue Share (%), by Body Part Type 2024 & 2032
- Figure 32: Asia Pacific Exoskeleton Industry Revenue (Million), by Product Type 2024 & 2032
- Figure 33: Asia Pacific Exoskeleton Industry Revenue Share (%), by Product Type 2024 & 2032
- Figure 34: Asia Pacific Exoskeleton Industry Revenue (Million), by Country 2024 & 2032
- Figure 35: Asia Pacific Exoskeleton Industry Revenue Share (%), by Country 2024 & 2032
- Figure 36: Middle East and Africa Exoskeleton Industry Revenue (Million), by Treatment Type 2024 & 2032
- Figure 37: Middle East and Africa Exoskeleton Industry Revenue Share (%), by Treatment Type 2024 & 2032
- Figure 38: Middle East and Africa Exoskeleton Industry Revenue (Million), by Body Part Type 2024 & 2032
- Figure 39: Middle East and Africa Exoskeleton Industry Revenue Share (%), by Body Part Type 2024 & 2032
- Figure 40: Middle East and Africa Exoskeleton Industry Revenue (Million), by Product Type 2024 & 2032
- Figure 41: Middle East and Africa Exoskeleton Industry Revenue Share (%), by Product Type 2024 & 2032
- Figure 42: Middle East and Africa Exoskeleton Industry Revenue (Million), by Country 2024 & 2032
- Figure 43: Middle East and Africa Exoskeleton Industry Revenue Share (%), by Country 2024 & 2032
- Figure 44: South America Exoskeleton Industry Revenue (Million), by Treatment Type 2024 & 2032
- Figure 45: South America Exoskeleton Industry Revenue Share (%), by Treatment Type 2024 & 2032
- Figure 46: South America Exoskeleton Industry Revenue (Million), by Body Part Type 2024 & 2032
- Figure 47: South America Exoskeleton Industry Revenue Share (%), by Body Part Type 2024 & 2032
- Figure 48: South America Exoskeleton Industry Revenue (Million), by Product Type 2024 & 2032
- Figure 49: South America Exoskeleton Industry Revenue Share (%), by Product Type 2024 & 2032
- Figure 50: South America Exoskeleton Industry Revenue (Million), by Country 2024 & 2032
- Figure 51: South America Exoskeleton Industry Revenue Share (%), by Country 2024 & 2032
List of Tables
- Table 1: Global Exoskeleton Industry Revenue Million Forecast, by Region 2019 & 2032
- Table 2: Global Exoskeleton Industry Revenue Million Forecast, by Treatment Type 2019 & 2032
- Table 3: Global Exoskeleton Industry Revenue Million Forecast, by Body Part Type 2019 & 2032
- Table 4: Global Exoskeleton Industry Revenue Million Forecast, by Product Type 2019 & 2032
- Table 5: Global Exoskeleton Industry Revenue Million Forecast, by Region 2019 & 2032
- Table 6: Global Exoskeleton Industry Revenue Million Forecast, by Country 2019 & 2032
- Table 7: United States Exoskeleton Industry Revenue (Million) Forecast, by Application 2019 & 2032
- Table 8: Canada Exoskeleton Industry Revenue (Million) Forecast, by Application 2019 & 2032
- Table 9: Mexico Exoskeleton Industry Revenue (Million) Forecast, by Application 2019 & 2032
- Table 10: Global Exoskeleton Industry Revenue Million Forecast, by Country 2019 & 2032
- Table 11: Germany Exoskeleton Industry Revenue (Million) Forecast, by Application 2019 & 2032
- Table 12: United Kingdom Exoskeleton Industry Revenue (Million) Forecast, by Application 2019 & 2032
- Table 13: France Exoskeleton Industry Revenue (Million) Forecast, by Application 2019 & 2032
- Table 14: Italy Exoskeleton Industry Revenue (Million) Forecast, by Application 2019 & 2032
- Table 15: Spain Exoskeleton Industry Revenue (Million) Forecast, by Application 2019 & 2032
- Table 16: Rest of Europe Exoskeleton Industry Revenue (Million) Forecast, by Application 2019 & 2032
- Table 17: Global Exoskeleton Industry Revenue Million Forecast, by Country 2019 & 2032
- Table 18: China Exoskeleton Industry Revenue (Million) Forecast, by Application 2019 & 2032
- Table 19: Japan Exoskeleton Industry Revenue (Million) Forecast, by Application 2019 & 2032
- Table 20: India Exoskeleton Industry Revenue (Million) Forecast, by Application 2019 & 2032
- Table 21: Australia Exoskeleton Industry Revenue (Million) Forecast, by Application 2019 & 2032
- Table 22: South Korea Exoskeleton Industry Revenue (Million) Forecast, by Application 2019 & 2032
- Table 23: Rest of Asia Pacific Exoskeleton Industry Revenue (Million) Forecast, by Application 2019 & 2032
- Table 24: Global Exoskeleton Industry Revenue Million Forecast, by Country 2019 & 2032
- Table 25: GCC Exoskeleton Industry Revenue (Million) Forecast, by Application 2019 & 2032
- Table 26: South Africa Exoskeleton Industry Revenue (Million) Forecast, by Application 2019 & 2032
- Table 27: Rest of Middle East and Africa Exoskeleton Industry Revenue (Million) Forecast, by Application 2019 & 2032
- Table 28: Global Exoskeleton Industry Revenue Million Forecast, by Country 2019 & 2032
- Table 29: Brazil Exoskeleton Industry Revenue (Million) Forecast, by Application 2019 & 2032
- Table 30: Argentina Exoskeleton Industry Revenue (Million) Forecast, by Application 2019 & 2032
- Table 31: Rest of South America Exoskeleton Industry Revenue (Million) Forecast, by Application 2019 & 2032
- Table 32: Global Exoskeleton Industry Revenue Million Forecast, by Treatment Type 2019 & 2032
- Table 33: Global Exoskeleton Industry Revenue Million Forecast, by Body Part Type 2019 & 2032
- Table 34: Global Exoskeleton Industry Revenue Million Forecast, by Product Type 2019 & 2032
- Table 35: Global Exoskeleton Industry Revenue Million Forecast, by Country 2019 & 2032
- Table 36: United States Exoskeleton Industry Revenue (Million) Forecast, by Application 2019 & 2032
- Table 37: Canada Exoskeleton Industry Revenue (Million) Forecast, by Application 2019 & 2032
- Table 38: Mexico Exoskeleton Industry Revenue (Million) Forecast, by Application 2019 & 2032
- Table 39: Global Exoskeleton Industry Revenue Million Forecast, by Treatment Type 2019 & 2032
- Table 40: Global Exoskeleton Industry Revenue Million Forecast, by Body Part Type 2019 & 2032
- Table 41: Global Exoskeleton Industry Revenue Million Forecast, by Product Type 2019 & 2032
- Table 42: Global Exoskeleton Industry Revenue Million Forecast, by Country 2019 & 2032
- Table 43: Germany Exoskeleton Industry Revenue (Million) Forecast, by Application 2019 & 2032
- Table 44: United Kingdom Exoskeleton Industry Revenue (Million) Forecast, by Application 2019 & 2032
- Table 45: France Exoskeleton Industry Revenue (Million) Forecast, by Application 2019 & 2032
- Table 46: Italy Exoskeleton Industry Revenue (Million) Forecast, by Application 2019 & 2032
- Table 47: Spain Exoskeleton Industry Revenue (Million) Forecast, by Application 2019 & 2032
- Table 48: Rest of Europe Exoskeleton Industry Revenue (Million) Forecast, by Application 2019 & 2032
- Table 49: Global Exoskeleton Industry Revenue Million Forecast, by Treatment Type 2019 & 2032
- Table 50: Global Exoskeleton Industry Revenue Million Forecast, by Body Part Type 2019 & 2032
- Table 51: Global Exoskeleton Industry Revenue Million Forecast, by Product Type 2019 & 2032
- Table 52: Global Exoskeleton Industry Revenue Million Forecast, by Country 2019 & 2032
- Table 53: China Exoskeleton Industry Revenue (Million) Forecast, by Application 2019 & 2032
- Table 54: Japan Exoskeleton Industry Revenue (Million) Forecast, by Application 2019 & 2032
- Table 55: India Exoskeleton Industry Revenue (Million) Forecast, by Application 2019 & 2032
- Table 56: Australia Exoskeleton Industry Revenue (Million) Forecast, by Application 2019 & 2032
- Table 57: South Korea Exoskeleton Industry Revenue (Million) Forecast, by Application 2019 & 2032
- Table 58: Rest of Asia Pacific Exoskeleton Industry Revenue (Million) Forecast, by Application 2019 & 2032
- Table 59: Global Exoskeleton Industry Revenue Million Forecast, by Treatment Type 2019 & 2032
- Table 60: Global Exoskeleton Industry Revenue Million Forecast, by Body Part Type 2019 & 2032
- Table 61: Global Exoskeleton Industry Revenue Million Forecast, by Product Type 2019 & 2032
- Table 62: Global Exoskeleton Industry Revenue Million Forecast, by Country 2019 & 2032
- Table 63: GCC Exoskeleton Industry Revenue (Million) Forecast, by Application 2019 & 2032
- Table 64: South Africa Exoskeleton Industry Revenue (Million) Forecast, by Application 2019 & 2032
- Table 65: Rest of Middle East and Africa Exoskeleton Industry Revenue (Million) Forecast, by Application 2019 & 2032
- Table 66: Global Exoskeleton Industry Revenue Million Forecast, by Treatment Type 2019 & 2032
- Table 67: Global Exoskeleton Industry Revenue Million Forecast, by Body Part Type 2019 & 2032
- Table 68: Global Exoskeleton Industry Revenue Million Forecast, by Product Type 2019 & 2032
- Table 69: Global Exoskeleton Industry Revenue Million Forecast, by Country 2019 & 2032
- Table 70: Brazil Exoskeleton Industry Revenue (Million) Forecast, by Application 2019 & 2032
- Table 71: Argentina Exoskeleton Industry Revenue (Million) Forecast, by Application 2019 & 2032
- Table 72: Rest of South America Exoskeleton Industry Revenue (Million) Forecast, by Application 2019 & 2032
Frequently Asked Questions
1. What is the projected Compound Annual Growth Rate (CAGR) of the Exoskeleton Industry?
The projected CAGR is approximately 12.50%.
2. Which companies are prominent players in the Exoskeleton Industry?
Key companies in the market include Parker-Hannifin Corp, B-Temia Inc, Rewalk Robotics, Rehab-Robotics Company Limited, Gogoa Mobility Robots, Bioservo Technologies AB, Bionik Laboratories Corp, Cyberdyne Inc, Ekso Bionics Holdings, Bioness Inc.
3. What are the main segments of the Exoskeleton Industry?
The market segments include Treatment Type, Body Part Type, Product Type.
4. Can you provide details about the market size?
The market size is estimated to be USD XX Million as of 2022.
5. What are some drivers contributing to market growth?
Growing Demand from Healthcare Sector for Robotic Rehabilitation; Advancement in Robotic Technologies; Huge Investment for the Development of the Exoskeleton Technology.
6. What are the notable trends driving market growth?
The Mobile Segment is Expected to Hold the Largest Share by Product Type Over the Forecast Period.
7. Are there any restraints impacting market growth?
Risks Involved with Using Exoskeletons Due to Vague Safety Guidelines.
8. Can you provide examples of recent developments in the market?
N/A
9. What pricing options are available for accessing the report?
Pricing options include single-user, multi-user, and enterprise licenses priced at USD 4750, USD 5250, and USD 8750 respectively.
10. Is the market size provided in terms of value or volume?
The market size is provided in terms of value, measured in Million.
11. Are there any specific market keywords associated with the report?
Yes, the market keyword associated with the report is "Exoskeleton Industry," which aids in identifying and referencing the specific market segment covered.
12. How do I determine which pricing option suits my needs best?
The pricing options vary based on user requirements and access needs. Individual users may opt for single-user licenses, while businesses requiring broader access may choose multi-user or enterprise licenses for cost-effective access to the report.
13. Are there any additional resources or data provided in the Exoskeleton Industry report?
While the report offers comprehensive insights, it's advisable to review the specific contents or supplementary materials provided to ascertain if additional resources or data are available.
14. How can I stay updated on further developments or reports in the Exoskeleton Industry?
To stay informed about further developments, trends, and reports in the Exoskeleton Industry, consider subscribing to industry newsletters, following relevant companies and organizations, or regularly checking reputable industry news sources and publications.
Methodology
Step 1 - Identification of Relevant Samples Size from Population Database


Step 2 - Approaches for Defining Global Market Size (Value, Volume* & Price*)

Note*: In applicable scenarios
Step 3 - Data Sources
Primary Research
- Web Analytics
- Survey Reports
- Research Institute
- Latest Research Reports
- Opinion Leaders
Secondary Research
- Annual Reports
- White Paper
- Latest Press Release
- Industry Association
- Paid Database
- Investor Presentations

Step 4 - Data Triangulation
Involves using different sources of information in order to increase the validity of a study
These sources are likely to be stakeholders in a program - participants, other researchers, program staff, other community members, and so on.
Then we put all data in single framework & apply various statistical tools to find out the dynamic on the market.
During the analysis stage, feedback from the stakeholder groups would be compared to determine areas of agreement as well as areas of divergence
