

Key Insights
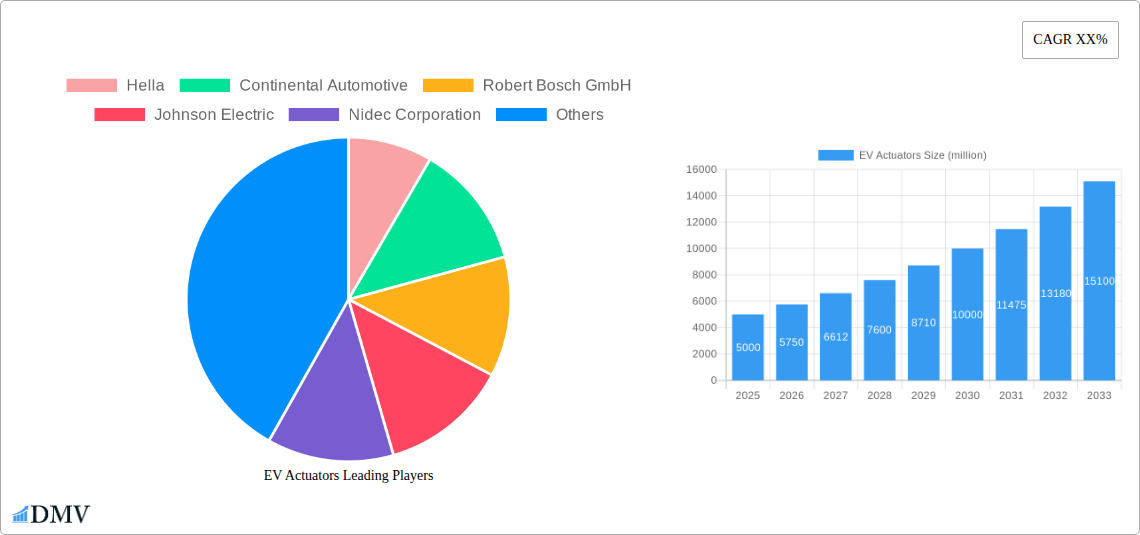
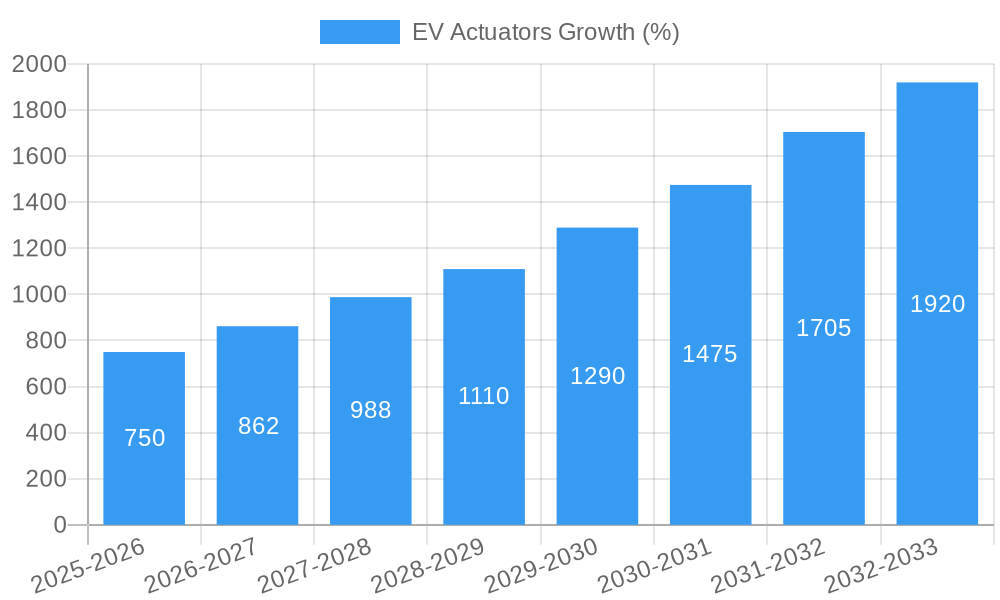
The electric vehicle (EV) actuator market is experiencing robust growth, driven by the global surge in EV adoption and the increasing demand for advanced driver-assistance systems (ADAS). The market, estimated at $5 billion in 2025, is projected to exhibit a Compound Annual Growth Rate (CAGR) of 15% from 2025 to 2033, reaching approximately $15 billion by 2033. This growth is fueled by several key factors. Firstly, the rising adoption of EVs necessitates sophisticated actuator systems for functions like throttle control, braking, and steering, which are significantly different from those in internal combustion engine (ICE) vehicles. Secondly, the integration of ADAS features such as lane keeping assist, adaptive cruise control, and automated parking demands increasingly complex and precise actuators. Thirdly, technological advancements in actuator technology, such as the development of more efficient and compact electromechanical and electrohydraulic actuators, are further accelerating market expansion. Leading players like Bosch, Continental, and Valeo are heavily investing in R&D to improve efficiency, durability, and functionalities of their products, driving innovation in the sector.
However, the market faces certain restraints. The high initial cost of EV actuators compared to traditional mechanical systems can hinder widespread adoption, particularly in budget-friendly EV models. Furthermore, the need for rigorous testing and certification processes to ensure safety and reliability can lead to increased development time and costs. Despite these challenges, the long-term growth outlook remains highly positive, driven by government incentives for EV adoption, stringent emission regulations, and the continuous improvement of EV actuator technology leading to cost reductions. Market segmentation by actuator type (electromechanical, electrohydraulic, etc.), vehicle type (passenger cars, commercial vehicles), and region will further reveal lucrative investment opportunities.
EV Actuators Market Report: A Comprehensive Analysis of a Multi-Million Dollar Industry (2019-2033)
This in-depth report provides a comprehensive analysis of the global EV Actuators market, projecting a multi-million dollar valuation by 2033. The study meticulously examines market dynamics, technological advancements, key players, and future growth prospects, offering invaluable insights for stakeholders across the electric vehicle (EV) ecosystem. The report covers the historical period (2019-2024), the base year (2025), and forecasts until 2033. This analysis utilizes extensive data to provide actionable intelligence for strategic decision-making.
EV Actuators Market Composition & Trends
This section delves into the intricate structure of the EV Actuators market, evaluating its concentration, innovative drivers, regulatory landscape, and competitive dynamics. We analyze the market share distribution amongst key players, highlighting the strategic M&A activities shaping the industry landscape. The analysis reveals a market valued at $XX million in 2025, projected to reach $XX million by 2033, exhibiting a CAGR of XX%.
- Market Concentration: The market exhibits a moderately concentrated structure, with the top five players—Hella, Continental Automotive, Robert Bosch GmbH, Johnson Electric, and Nidec Corporation—holding approximately XX% of the global market share in 2025.
- Innovation Catalysts: Advancements in electric motor technology, particularly the rise of high-efficiency BLDC motors, are driving innovation in actuator design, enabling greater precision and efficiency.
- Regulatory Landscape: Stringent emission regulations globally are incentivizing the adoption of EVs, indirectly boosting the demand for high-performance EV actuators.
- Substitute Products: While limited, alternative technologies such as pneumatic and hydraulic systems exist, however, their limitations in efficiency and precision restrict their market share.
- End-User Profiles: The primary end-users are EV manufacturers, Tier-1 automotive suppliers, and aftermarket component providers.
- M&A Activities: The study identifies XX major M&A deals within the period 2019-2024, with a total transaction value of approximately $XX million, showcasing the consolidation within the EV actuator market. These deals indicate a strategic focus on expanding product portfolios and strengthening technological capabilities.
EV Actuators Industry Evolution
This section traces the evolution of the EV Actuators industry, analyzing market growth trajectories, technological breakthroughs, and evolving consumer demands. We assess the transition from traditional internal combustion engine (ICE) vehicles to EVs and the implications for actuator design and functionality. We examine the impact of factors such as increasing range anxiety and demand for improved vehicle performance on market growth. The market is expected to grow from $XX million in 2019 to $XX million in 2024, demonstrating significant growth potential. This expansion is directly linked to the substantial rise in global EV adoption during this period.
Leading Regions, Countries, or Segments in EV Actuators
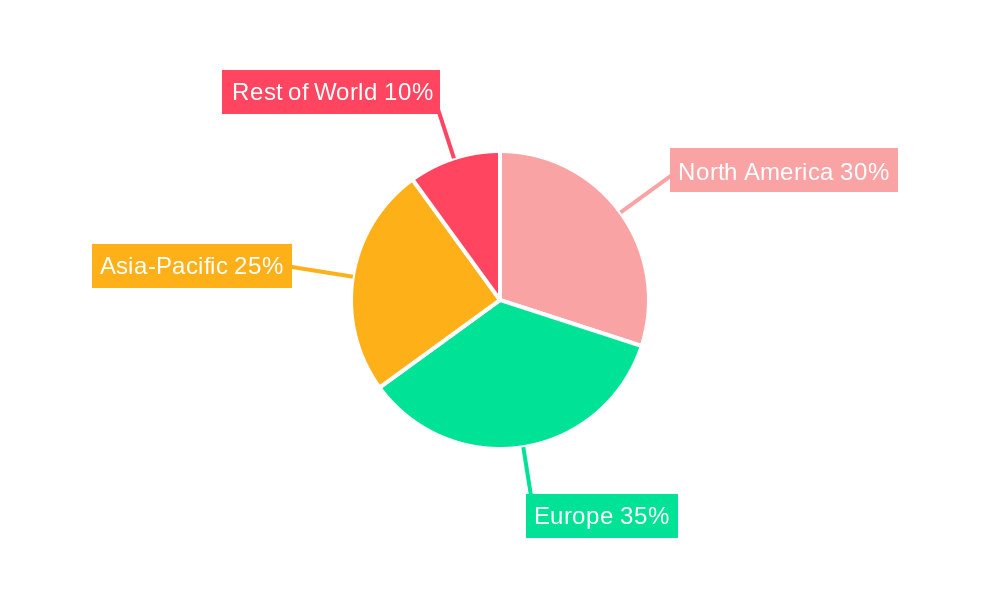
This section identifies the dominant regions, countries, and segments within the EV Actuators market. We pinpoint the key drivers behind this dominance, considering factors such as government policies, infrastructure development, and consumer preferences. Asia-Pacific emerges as the leading region, driven by high EV adoption rates and a robust manufacturing base.
- Key Drivers in Asia-Pacific:
- Massive investments in EV infrastructure and supportive government policies.
- Significant production capacity and cost-effective manufacturing.
- High demand for electric vehicles, fueled by rising disposable incomes and environmental concerns.
- In-depth Analysis: The region's dominance is further underpinned by the presence of major EV manufacturers and a robust supply chain for actuator components. This makes Asia-Pacific a crucial hub for EV actuator production and consumption.
EV Actuators Product Innovations
Recent innovations in EV actuators focus on enhancing efficiency, reducing size and weight, and improving precision. Advancements such as integrated control units, high-performance materials (e.g., lightweight composites), and optimized motor designs are driving improved performance and fuel economy. These innovations deliver unique selling propositions for original equipment manufacturers (OEMs) by improving vehicle performance and reducing manufacturing costs.
Propelling Factors for EV Actuators Growth
Several factors are driving growth within the EV actuator market. Technological advancements in actuator designs (e.g., the use of high-torque density motors) are paramount. Economies of scale in manufacturing, coupled with the continuous rise in EV adoption rates and supportive government regulations (e.g., subsidies for electric vehicles), are accelerating market expansion.
Obstacles in the EV Actuators Market
The EV actuator market faces several challenges, including the high initial investment costs associated with developing and manufacturing advanced actuators and potential supply chain disruptions affecting the availability of crucial components. Furthermore, intense competition from established players and the emergence of new entrants add complexity to market dynamics.
Future Opportunities in EV Actuators
The future of EV actuators is bright. Expanding EV adoption across new vehicle segments (e.g., commercial vehicles, buses) presents significant market opportunities. Technological advancements, like the development of highly efficient and compact actuators, will further drive market growth. Emerging markets in developing economies also present attractive growth prospects.
Major Players in the EV Actuators Ecosystem
- Hella
- Continental Automotive
- Robert Bosch GmbH
- Johnson Electric
- Nidec Corporation
- BorgWarner
- Valeo
- Magna International
- Mando Corporation
- Hitachi Automotive Systems
- Denso Corporation
- Mitsuba Corporation
- Mahle GmbH
- Rheinmetall Automotive
- Brose Fahrzeugteile GmbH & Co. KG
Key Developments in EV Actuators Industry
- 2022 Q4: Hella launches a new generation of highly efficient EV actuators, featuring improved energy management.
- 2023 Q1: Continental Automotive and Bosch GmbH announce a joint venture to develop next-generation actuator technology.
- 2023 Q2: Nidec Corporation acquires a smaller actuator manufacturer, expanding its product portfolio. (Further details on specific M&A’s will be included in the full report)
Strategic EV Actuators Market Forecast
The global EV actuator market is poised for significant expansion over the forecast period (2025-2033). Continued advancements in actuator technology, coupled with the rising adoption of electric vehicles and supportive governmental policies, will be key growth catalysts. Emerging opportunities in new vehicle segments and geographic markets will further fuel market expansion, potentially driving a multi-million dollar market by 2033.
EV Actuators Segmentation
-
1. Application
- 1.1. Commercial Vehicles
- 1.2. Passenger Vehicles
-
2. Types
- 2.1. Hydraulic
- 2.2. Electric
- 2.3. Pneumatic Type
EV Actuators Segmentation By Geography
-
1. North America
- 1.1. United States
- 1.2. Canada
- 1.3. Mexico
-
2. South America
- 2.1. Brazil
- 2.2. Argentina
- 2.3. Rest of South America
-
3. Europe
- 3.1. United Kingdom
- 3.2. Germany
- 3.3. France
- 3.4. Italy
- 3.5. Spain
- 3.6. Russia
- 3.7. Benelux
- 3.8. Nordics
- 3.9. Rest of Europe
-
4. Middle East & Africa
- 4.1. Turkey
- 4.2. Israel
- 4.3. GCC
- 4.4. North Africa
- 4.5. South Africa
- 4.6. Rest of Middle East & Africa
-
5. Asia Pacific
- 5.1. China
- 5.2. India
- 5.3. Japan
- 5.4. South Korea
- 5.5. ASEAN
- 5.6. Oceania
- 5.7. Rest of Asia Pacific
EV Actuators REPORT HIGHLIGHTS
| Aspects | Details |
|---|---|
| Study Period | 2019-2033 |
| Base Year | 2024 |
| Estimated Year | 2025 |
| Forecast Period | 2025-2033 |
| Historical Period | 2019-2024 |
| Growth Rate | CAGR of XX% from 2019-2033 |
| Segmentation |
|
Table of Contents
- 1. Introduction
- 1.1. Research Scope
- 1.2. Market Segmentation
- 1.3. Research Methodology
- 1.4. Definitions and Assumptions
- 2. Executive Summary
- 2.1. Introduction
- 3. Market Dynamics
- 3.1. Introduction
- 3.2. Market Drivers
- 3.3. Market Restrains
- 3.4. Market Trends
- 4. Market Factor Analysis
- 4.1. Porters Five Forces
- 4.2. Supply/Value Chain
- 4.3. PESTEL analysis
- 4.4. Market Entropy
- 4.5. Patent/Trademark Analysis
- 5. Global EV Actuators Analysis, Insights and Forecast, 2019-2031
- 5.1. Market Analysis, Insights and Forecast - by Application
- 5.1.1. Commercial Vehicles
- 5.1.2. Passenger Vehicles
- 5.2. Market Analysis, Insights and Forecast - by Types
- 5.2.1. Hydraulic
- 5.2.2. Electric
- 5.2.3. Pneumatic Type
- 5.3. Market Analysis, Insights and Forecast - by Region
- 5.3.1. North America
- 5.3.2. South America
- 5.3.3. Europe
- 5.3.4. Middle East & Africa
- 5.3.5. Asia Pacific
- 5.1. Market Analysis, Insights and Forecast - by Application
- 6. North America EV Actuators Analysis, Insights and Forecast, 2019-2031
- 6.1. Market Analysis, Insights and Forecast - by Application
- 6.1.1. Commercial Vehicles
- 6.1.2. Passenger Vehicles
- 6.2. Market Analysis, Insights and Forecast - by Types
- 6.2.1. Hydraulic
- 6.2.2. Electric
- 6.2.3. Pneumatic Type
- 6.1. Market Analysis, Insights and Forecast - by Application
- 7. South America EV Actuators Analysis, Insights and Forecast, 2019-2031
- 7.1. Market Analysis, Insights and Forecast - by Application
- 7.1.1. Commercial Vehicles
- 7.1.2. Passenger Vehicles
- 7.2. Market Analysis, Insights and Forecast - by Types
- 7.2.1. Hydraulic
- 7.2.2. Electric
- 7.2.3. Pneumatic Type
- 7.1. Market Analysis, Insights and Forecast - by Application
- 8. Europe EV Actuators Analysis, Insights and Forecast, 2019-2031
- 8.1. Market Analysis, Insights and Forecast - by Application
- 8.1.1. Commercial Vehicles
- 8.1.2. Passenger Vehicles
- 8.2. Market Analysis, Insights and Forecast - by Types
- 8.2.1. Hydraulic
- 8.2.2. Electric
- 8.2.3. Pneumatic Type
- 8.1. Market Analysis, Insights and Forecast - by Application
- 9. Middle East & Africa EV Actuators Analysis, Insights and Forecast, 2019-2031
- 9.1. Market Analysis, Insights and Forecast - by Application
- 9.1.1. Commercial Vehicles
- 9.1.2. Passenger Vehicles
- 9.2. Market Analysis, Insights and Forecast - by Types
- 9.2.1. Hydraulic
- 9.2.2. Electric
- 9.2.3. Pneumatic Type
- 9.1. Market Analysis, Insights and Forecast - by Application
- 10. Asia Pacific EV Actuators Analysis, Insights and Forecast, 2019-2031
- 10.1. Market Analysis, Insights and Forecast - by Application
- 10.1.1. Commercial Vehicles
- 10.1.2. Passenger Vehicles
- 10.2. Market Analysis, Insights and Forecast - by Types
- 10.2.1. Hydraulic
- 10.2.2. Electric
- 10.2.3. Pneumatic Type
- 10.1. Market Analysis, Insights and Forecast - by Application
- 11. Competitive Analysis
- 11.1. Global Market Share Analysis 2024
- 11.2. Company Profiles
- 11.2.1 Hella
- 11.2.1.1. Overview
- 11.2.1.2. Products
- 11.2.1.3. SWOT Analysis
- 11.2.1.4. Recent Developments
- 11.2.1.5. Financials (Based on Availability)
- 11.2.2 Continental Automotive
- 11.2.2.1. Overview
- 11.2.2.2. Products
- 11.2.2.3. SWOT Analysis
- 11.2.2.4. Recent Developments
- 11.2.2.5. Financials (Based on Availability)
- 11.2.3 Robert Bosch GmbH
- 11.2.3.1. Overview
- 11.2.3.2. Products
- 11.2.3.3. SWOT Analysis
- 11.2.3.4. Recent Developments
- 11.2.3.5. Financials (Based on Availability)
- 11.2.4 Johnson Electric
- 11.2.4.1. Overview
- 11.2.4.2. Products
- 11.2.4.3. SWOT Analysis
- 11.2.4.4. Recent Developments
- 11.2.4.5. Financials (Based on Availability)
- 11.2.5 Nidec Corporation
- 11.2.5.1. Overview
- 11.2.5.2. Products
- 11.2.5.3. SWOT Analysis
- 11.2.5.4. Recent Developments
- 11.2.5.5. Financials (Based on Availability)
- 11.2.6 BorgWarner
- 11.2.6.1. Overview
- 11.2.6.2. Products
- 11.2.6.3. SWOT Analysis
- 11.2.6.4. Recent Developments
- 11.2.6.5. Financials (Based on Availability)
- 11.2.7 Valeo
- 11.2.7.1. Overview
- 11.2.7.2. Products
- 11.2.7.3. SWOT Analysis
- 11.2.7.4. Recent Developments
- 11.2.7.5. Financials (Based on Availability)
- 11.2.8 Magna International
- 11.2.8.1. Overview
- 11.2.8.2. Products
- 11.2.8.3. SWOT Analysis
- 11.2.8.4. Recent Developments
- 11.2.8.5. Financials (Based on Availability)
- 11.2.9 Mando Corporation
- 11.2.9.1. Overview
- 11.2.9.2. Products
- 11.2.9.3. SWOT Analysis
- 11.2.9.4. Recent Developments
- 11.2.9.5. Financials (Based on Availability)
- 11.2.10 Hitachi Automotive Systems
- 11.2.10.1. Overview
- 11.2.10.2. Products
- 11.2.10.3. SWOT Analysis
- 11.2.10.4. Recent Developments
- 11.2.10.5. Financials (Based on Availability)
- 11.2.11 Denso Corporation
- 11.2.11.1. Overview
- 11.2.11.2. Products
- 11.2.11.3. SWOT Analysis
- 11.2.11.4. Recent Developments
- 11.2.11.5. Financials (Based on Availability)
- 11.2.12 Mitsuba Corporation
- 11.2.12.1. Overview
- 11.2.12.2. Products
- 11.2.12.3. SWOT Analysis
- 11.2.12.4. Recent Developments
- 11.2.12.5. Financials (Based on Availability)
- 11.2.13 Mahle GmbH
- 11.2.13.1. Overview
- 11.2.13.2. Products
- 11.2.13.3. SWOT Analysis
- 11.2.13.4. Recent Developments
- 11.2.13.5. Financials (Based on Availability)
- 11.2.14 Rheinmetall Automotive
- 11.2.14.1. Overview
- 11.2.14.2. Products
- 11.2.14.3. SWOT Analysis
- 11.2.14.4. Recent Developments
- 11.2.14.5. Financials (Based on Availability)
- 11.2.15 Brose Fahrzeugteile GmbH & Co. KG
- 11.2.15.1. Overview
- 11.2.15.2. Products
- 11.2.15.3. SWOT Analysis
- 11.2.15.4. Recent Developments
- 11.2.15.5. Financials (Based on Availability)
- 11.2.1 Hella
List of Figures
- Figure 1: Global EV Actuators Revenue Breakdown (million, %) by Region 2024 & 2032
- Figure 2: Global EV Actuators Volume Breakdown (K, %) by Region 2024 & 2032
- Figure 3: North America EV Actuators Revenue (million), by Application 2024 & 2032
- Figure 4: North America EV Actuators Volume (K), by Application 2024 & 2032
- Figure 5: North America EV Actuators Revenue Share (%), by Application 2024 & 2032
- Figure 6: North America EV Actuators Volume Share (%), by Application 2024 & 2032
- Figure 7: North America EV Actuators Revenue (million), by Types 2024 & 2032
- Figure 8: North America EV Actuators Volume (K), by Types 2024 & 2032
- Figure 9: North America EV Actuators Revenue Share (%), by Types 2024 & 2032
- Figure 10: North America EV Actuators Volume Share (%), by Types 2024 & 2032
- Figure 11: North America EV Actuators Revenue (million), by Country 2024 & 2032
- Figure 12: North America EV Actuators Volume (K), by Country 2024 & 2032
- Figure 13: North America EV Actuators Revenue Share (%), by Country 2024 & 2032
- Figure 14: North America EV Actuators Volume Share (%), by Country 2024 & 2032
- Figure 15: South America EV Actuators Revenue (million), by Application 2024 & 2032
- Figure 16: South America EV Actuators Volume (K), by Application 2024 & 2032
- Figure 17: South America EV Actuators Revenue Share (%), by Application 2024 & 2032
- Figure 18: South America EV Actuators Volume Share (%), by Application 2024 & 2032
- Figure 19: South America EV Actuators Revenue (million), by Types 2024 & 2032
- Figure 20: South America EV Actuators Volume (K), by Types 2024 & 2032
- Figure 21: South America EV Actuators Revenue Share (%), by Types 2024 & 2032
- Figure 22: South America EV Actuators Volume Share (%), by Types 2024 & 2032
- Figure 23: South America EV Actuators Revenue (million), by Country 2024 & 2032
- Figure 24: South America EV Actuators Volume (K), by Country 2024 & 2032
- Figure 25: South America EV Actuators Revenue Share (%), by Country 2024 & 2032
- Figure 26: South America EV Actuators Volume Share (%), by Country 2024 & 2032
- Figure 27: Europe EV Actuators Revenue (million), by Application 2024 & 2032
- Figure 28: Europe EV Actuators Volume (K), by Application 2024 & 2032
- Figure 29: Europe EV Actuators Revenue Share (%), by Application 2024 & 2032
- Figure 30: Europe EV Actuators Volume Share (%), by Application 2024 & 2032
- Figure 31: Europe EV Actuators Revenue (million), by Types 2024 & 2032
- Figure 32: Europe EV Actuators Volume (K), by Types 2024 & 2032
- Figure 33: Europe EV Actuators Revenue Share (%), by Types 2024 & 2032
- Figure 34: Europe EV Actuators Volume Share (%), by Types 2024 & 2032
- Figure 35: Europe EV Actuators Revenue (million), by Country 2024 & 2032
- Figure 36: Europe EV Actuators Volume (K), by Country 2024 & 2032
- Figure 37: Europe EV Actuators Revenue Share (%), by Country 2024 & 2032
- Figure 38: Europe EV Actuators Volume Share (%), by Country 2024 & 2032
- Figure 39: Middle East & Africa EV Actuators Revenue (million), by Application 2024 & 2032
- Figure 40: Middle East & Africa EV Actuators Volume (K), by Application 2024 & 2032
- Figure 41: Middle East & Africa EV Actuators Revenue Share (%), by Application 2024 & 2032
- Figure 42: Middle East & Africa EV Actuators Volume Share (%), by Application 2024 & 2032
- Figure 43: Middle East & Africa EV Actuators Revenue (million), by Types 2024 & 2032
- Figure 44: Middle East & Africa EV Actuators Volume (K), by Types 2024 & 2032
- Figure 45: Middle East & Africa EV Actuators Revenue Share (%), by Types 2024 & 2032
- Figure 46: Middle East & Africa EV Actuators Volume Share (%), by Types 2024 & 2032
- Figure 47: Middle East & Africa EV Actuators Revenue (million), by Country 2024 & 2032
- Figure 48: Middle East & Africa EV Actuators Volume (K), by Country 2024 & 2032
- Figure 49: Middle East & Africa EV Actuators Revenue Share (%), by Country 2024 & 2032
- Figure 50: Middle East & Africa EV Actuators Volume Share (%), by Country 2024 & 2032
- Figure 51: Asia Pacific EV Actuators Revenue (million), by Application 2024 & 2032
- Figure 52: Asia Pacific EV Actuators Volume (K), by Application 2024 & 2032
- Figure 53: Asia Pacific EV Actuators Revenue Share (%), by Application 2024 & 2032
- Figure 54: Asia Pacific EV Actuators Volume Share (%), by Application 2024 & 2032
- Figure 55: Asia Pacific EV Actuators Revenue (million), by Types 2024 & 2032
- Figure 56: Asia Pacific EV Actuators Volume (K), by Types 2024 & 2032
- Figure 57: Asia Pacific EV Actuators Revenue Share (%), by Types 2024 & 2032
- Figure 58: Asia Pacific EV Actuators Volume Share (%), by Types 2024 & 2032
- Figure 59: Asia Pacific EV Actuators Revenue (million), by Country 2024 & 2032
- Figure 60: Asia Pacific EV Actuators Volume (K), by Country 2024 & 2032
- Figure 61: Asia Pacific EV Actuators Revenue Share (%), by Country 2024 & 2032
- Figure 62: Asia Pacific EV Actuators Volume Share (%), by Country 2024 & 2032
List of Tables
- Table 1: Global EV Actuators Revenue million Forecast, by Region 2019 & 2032
- Table 2: Global EV Actuators Volume K Forecast, by Region 2019 & 2032
- Table 3: Global EV Actuators Revenue million Forecast, by Application 2019 & 2032
- Table 4: Global EV Actuators Volume K Forecast, by Application 2019 & 2032
- Table 5: Global EV Actuators Revenue million Forecast, by Types 2019 & 2032
- Table 6: Global EV Actuators Volume K Forecast, by Types 2019 & 2032
- Table 7: Global EV Actuators Revenue million Forecast, by Region 2019 & 2032
- Table 8: Global EV Actuators Volume K Forecast, by Region 2019 & 2032
- Table 9: Global EV Actuators Revenue million Forecast, by Application 2019 & 2032
- Table 10: Global EV Actuators Volume K Forecast, by Application 2019 & 2032
- Table 11: Global EV Actuators Revenue million Forecast, by Types 2019 & 2032
- Table 12: Global EV Actuators Volume K Forecast, by Types 2019 & 2032
- Table 13: Global EV Actuators Revenue million Forecast, by Country 2019 & 2032
- Table 14: Global EV Actuators Volume K Forecast, by Country 2019 & 2032
- Table 15: United States EV Actuators Revenue (million) Forecast, by Application 2019 & 2032
- Table 16: United States EV Actuators Volume (K) Forecast, by Application 2019 & 2032
- Table 17: Canada EV Actuators Revenue (million) Forecast, by Application 2019 & 2032
- Table 18: Canada EV Actuators Volume (K) Forecast, by Application 2019 & 2032
- Table 19: Mexico EV Actuators Revenue (million) Forecast, by Application 2019 & 2032
- Table 20: Mexico EV Actuators Volume (K) Forecast, by Application 2019 & 2032
- Table 21: Global EV Actuators Revenue million Forecast, by Application 2019 & 2032
- Table 22: Global EV Actuators Volume K Forecast, by Application 2019 & 2032
- Table 23: Global EV Actuators Revenue million Forecast, by Types 2019 & 2032
- Table 24: Global EV Actuators Volume K Forecast, by Types 2019 & 2032
- Table 25: Global EV Actuators Revenue million Forecast, by Country 2019 & 2032
- Table 26: Global EV Actuators Volume K Forecast, by Country 2019 & 2032
- Table 27: Brazil EV Actuators Revenue (million) Forecast, by Application 2019 & 2032
- Table 28: Brazil EV Actuators Volume (K) Forecast, by Application 2019 & 2032
- Table 29: Argentina EV Actuators Revenue (million) Forecast, by Application 2019 & 2032
- Table 30: Argentina EV Actuators Volume (K) Forecast, by Application 2019 & 2032
- Table 31: Rest of South America EV Actuators Revenue (million) Forecast, by Application 2019 & 2032
- Table 32: Rest of South America EV Actuators Volume (K) Forecast, by Application 2019 & 2032
- Table 33: Global EV Actuators Revenue million Forecast, by Application 2019 & 2032
- Table 34: Global EV Actuators Volume K Forecast, by Application 2019 & 2032
- Table 35: Global EV Actuators Revenue million Forecast, by Types 2019 & 2032
- Table 36: Global EV Actuators Volume K Forecast, by Types 2019 & 2032
- Table 37: Global EV Actuators Revenue million Forecast, by Country 2019 & 2032
- Table 38: Global EV Actuators Volume K Forecast, by Country 2019 & 2032
- Table 39: United Kingdom EV Actuators Revenue (million) Forecast, by Application 2019 & 2032
- Table 40: United Kingdom EV Actuators Volume (K) Forecast, by Application 2019 & 2032
- Table 41: Germany EV Actuators Revenue (million) Forecast, by Application 2019 & 2032
- Table 42: Germany EV Actuators Volume (K) Forecast, by Application 2019 & 2032
- Table 43: France EV Actuators Revenue (million) Forecast, by Application 2019 & 2032
- Table 44: France EV Actuators Volume (K) Forecast, by Application 2019 & 2032
- Table 45: Italy EV Actuators Revenue (million) Forecast, by Application 2019 & 2032
- Table 46: Italy EV Actuators Volume (K) Forecast, by Application 2019 & 2032
- Table 47: Spain EV Actuators Revenue (million) Forecast, by Application 2019 & 2032
- Table 48: Spain EV Actuators Volume (K) Forecast, by Application 2019 & 2032
- Table 49: Russia EV Actuators Revenue (million) Forecast, by Application 2019 & 2032
- Table 50: Russia EV Actuators Volume (K) Forecast, by Application 2019 & 2032
- Table 51: Benelux EV Actuators Revenue (million) Forecast, by Application 2019 & 2032
- Table 52: Benelux EV Actuators Volume (K) Forecast, by Application 2019 & 2032
- Table 53: Nordics EV Actuators Revenue (million) Forecast, by Application 2019 & 2032
- Table 54: Nordics EV Actuators Volume (K) Forecast, by Application 2019 & 2032
- Table 55: Rest of Europe EV Actuators Revenue (million) Forecast, by Application 2019 & 2032
- Table 56: Rest of Europe EV Actuators Volume (K) Forecast, by Application 2019 & 2032
- Table 57: Global EV Actuators Revenue million Forecast, by Application 2019 & 2032
- Table 58: Global EV Actuators Volume K Forecast, by Application 2019 & 2032
- Table 59: Global EV Actuators Revenue million Forecast, by Types 2019 & 2032
- Table 60: Global EV Actuators Volume K Forecast, by Types 2019 & 2032
- Table 61: Global EV Actuators Revenue million Forecast, by Country 2019 & 2032
- Table 62: Global EV Actuators Volume K Forecast, by Country 2019 & 2032
- Table 63: Turkey EV Actuators Revenue (million) Forecast, by Application 2019 & 2032
- Table 64: Turkey EV Actuators Volume (K) Forecast, by Application 2019 & 2032
- Table 65: Israel EV Actuators Revenue (million) Forecast, by Application 2019 & 2032
- Table 66: Israel EV Actuators Volume (K) Forecast, by Application 2019 & 2032
- Table 67: GCC EV Actuators Revenue (million) Forecast, by Application 2019 & 2032
- Table 68: GCC EV Actuators Volume (K) Forecast, by Application 2019 & 2032
- Table 69: North Africa EV Actuators Revenue (million) Forecast, by Application 2019 & 2032
- Table 70: North Africa EV Actuators Volume (K) Forecast, by Application 2019 & 2032
- Table 71: South Africa EV Actuators Revenue (million) Forecast, by Application 2019 & 2032
- Table 72: South Africa EV Actuators Volume (K) Forecast, by Application 2019 & 2032
- Table 73: Rest of Middle East & Africa EV Actuators Revenue (million) Forecast, by Application 2019 & 2032
- Table 74: Rest of Middle East & Africa EV Actuators Volume (K) Forecast, by Application 2019 & 2032
- Table 75: Global EV Actuators Revenue million Forecast, by Application 2019 & 2032
- Table 76: Global EV Actuators Volume K Forecast, by Application 2019 & 2032
- Table 77: Global EV Actuators Revenue million Forecast, by Types 2019 & 2032
- Table 78: Global EV Actuators Volume K Forecast, by Types 2019 & 2032
- Table 79: Global EV Actuators Revenue million Forecast, by Country 2019 & 2032
- Table 80: Global EV Actuators Volume K Forecast, by Country 2019 & 2032
- Table 81: China EV Actuators Revenue (million) Forecast, by Application 2019 & 2032
- Table 82: China EV Actuators Volume (K) Forecast, by Application 2019 & 2032
- Table 83: India EV Actuators Revenue (million) Forecast, by Application 2019 & 2032
- Table 84: India EV Actuators Volume (K) Forecast, by Application 2019 & 2032
- Table 85: Japan EV Actuators Revenue (million) Forecast, by Application 2019 & 2032
- Table 86: Japan EV Actuators Volume (K) Forecast, by Application 2019 & 2032
- Table 87: South Korea EV Actuators Revenue (million) Forecast, by Application 2019 & 2032
- Table 88: South Korea EV Actuators Volume (K) Forecast, by Application 2019 & 2032
- Table 89: ASEAN EV Actuators Revenue (million) Forecast, by Application 2019 & 2032
- Table 90: ASEAN EV Actuators Volume (K) Forecast, by Application 2019 & 2032
- Table 91: Oceania EV Actuators Revenue (million) Forecast, by Application 2019 & 2032
- Table 92: Oceania EV Actuators Volume (K) Forecast, by Application 2019 & 2032
- Table 93: Rest of Asia Pacific EV Actuators Revenue (million) Forecast, by Application 2019 & 2032
- Table 94: Rest of Asia Pacific EV Actuators Volume (K) Forecast, by Application 2019 & 2032
Frequently Asked Questions
1. What is the projected Compound Annual Growth Rate (CAGR) of the EV Actuators?
The projected CAGR is approximately XX%.
2. Which companies are prominent players in the EV Actuators?
Key companies in the market include Hella, Continental Automotive, Robert Bosch GmbH, Johnson Electric, Nidec Corporation, BorgWarner, Valeo, Magna International, Mando Corporation, Hitachi Automotive Systems, Denso Corporation, Mitsuba Corporation, Mahle GmbH, Rheinmetall Automotive, Brose Fahrzeugteile GmbH & Co. KG.
3. What are the main segments of the EV Actuators?
The market segments include Application, Types.
4. Can you provide details about the market size?
The market size is estimated to be USD XXX million as of 2022.
5. What are some drivers contributing to market growth?
N/A
6. What are the notable trends driving market growth?
N/A
7. Are there any restraints impacting market growth?
N/A
8. Can you provide examples of recent developments in the market?
N/A
9. What pricing options are available for accessing the report?
Pricing options include single-user, multi-user, and enterprise licenses priced at USD 3350.00, USD 5025.00, and USD 6700.00 respectively.
10. Is the market size provided in terms of value or volume?
The market size is provided in terms of value, measured in million and volume, measured in K.
11. Are there any specific market keywords associated with the report?
Yes, the market keyword associated with the report is "EV Actuators," which aids in identifying and referencing the specific market segment covered.
12. How do I determine which pricing option suits my needs best?
The pricing options vary based on user requirements and access needs. Individual users may opt for single-user licenses, while businesses requiring broader access may choose multi-user or enterprise licenses for cost-effective access to the report.
13. Are there any additional resources or data provided in the EV Actuators report?
While the report offers comprehensive insights, it's advisable to review the specific contents or supplementary materials provided to ascertain if additional resources or data are available.
14. How can I stay updated on further developments or reports in the EV Actuators?
To stay informed about further developments, trends, and reports in the EV Actuators, consider subscribing to industry newsletters, following relevant companies and organizations, or regularly checking reputable industry news sources and publications.
Methodology
Step 1 - Identification of Relevant Samples Size from Population Database


Step 2 - Approaches for Defining Global Market Size (Value, Volume* & Price*)

Note*: In applicable scenarios
Step 3 - Data Sources
Primary Research
- Web Analytics
- Survey Reports
- Research Institute
- Latest Research Reports
- Opinion Leaders
Secondary Research
- Annual Reports
- White Paper
- Latest Press Release
- Industry Association
- Paid Database
- Investor Presentations

Step 4 - Data Triangulation
Involves using different sources of information in order to increase the validity of a study
These sources are likely to be stakeholders in a program - participants, other researchers, program staff, other community members, and so on.
Then we put all data in single framework & apply various statistical tools to find out the dynamic on the market.
During the analysis stage, feedback from the stakeholder groups would be compared to determine areas of agreement as well as areas of divergence
