

Key Insights
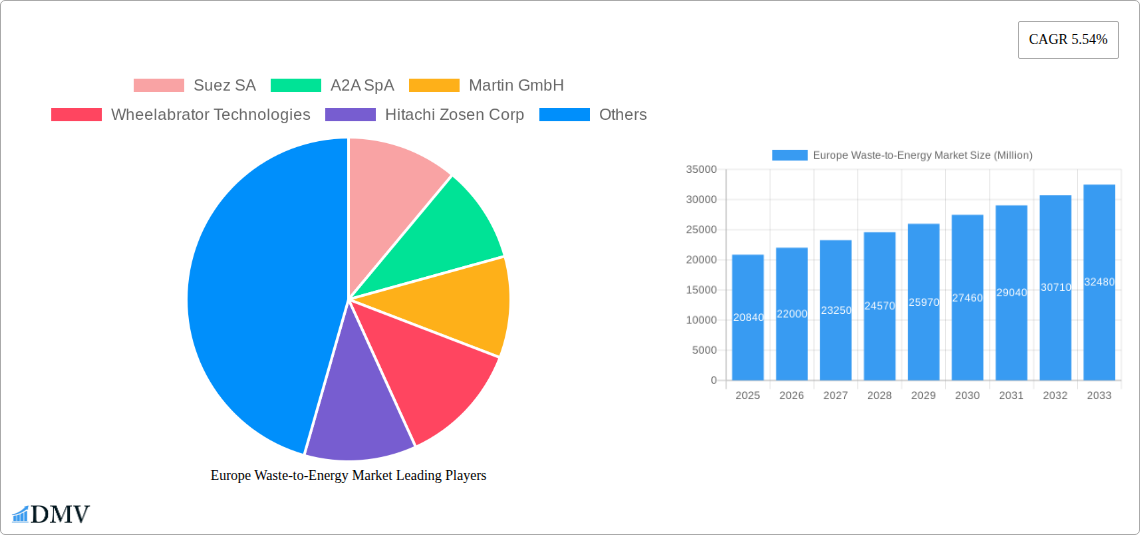
The European waste-to-energy (WtE) market is experiencing robust growth, projected to reach €20.84 billion in 2025 and maintain a Compound Annual Growth Rate (CAGR) of 5.54% from 2025 to 2033. This expansion is fueled by several key factors. Stringent environmental regulations across Europe are driving the adoption of sustainable waste management solutions, reducing landfill reliance and promoting energy recovery from waste. Growing urbanization and increasing waste generation, particularly in densely populated regions like Germany, the UK, and France, further contribute to market growth. Technological advancements in WtE technologies, leading to improved efficiency and reduced emissions, also play a significant role. Furthermore, the increasing emphasis on renewable energy sources and the need to reduce reliance on fossil fuels are bolstering the adoption of WtE as a clean energy solution. Investment in research and development, alongside supportive government policies and incentives, are further catalyzing market expansion.
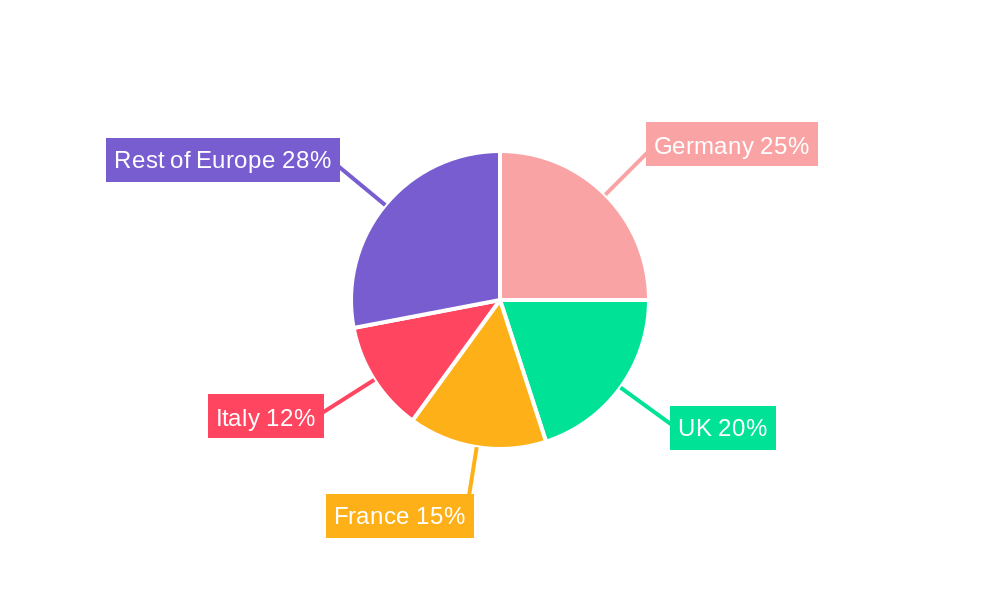
The market segmentation reveals a dynamic landscape. While specific segment breakdowns (physical vs. biological) and detailed country-specific data within Europe are limited, Germany, the UK, France, and Italy are expected to remain major contributors to the market's value, due to their established WtE infrastructure and progressive waste management policies. Nordic countries and other regions are also exhibiting significant growth potential, driven by ambitious sustainability goals. The presence of established players like Suez SA, Veolia Environnement SA, and Hitachi Zosen Corp indicates a high level of competition and continuous innovation within the sector. However, challenges remain, including the need for consistent regulatory frameworks across different European nations and public perception concerns related to potential environmental impacts. The overall outlook for the European WtE market remains positive, driven by its essential role in achieving environmental sustainability targets and securing a more secure energy future.
Europe Waste-to-Energy Market: A Comprehensive Report (2019-2033)
This insightful report provides a detailed analysis of the Europe Waste-to-Energy (WtE) market, offering a comprehensive overview of its current state, future trends, and growth opportunities. Covering the period from 2019 to 2033, with a base year of 2025 and a forecast period of 2025-2033, this report is an invaluable resource for stakeholders seeking to understand and capitalize on this dynamic market. The market is projected to reach xx Million by 2033.
Europe Waste-to-Energy Market Market Composition & Trends
The European WtE market is characterized by a moderately concentrated landscape with several key players vying for market share. Market concentration is influenced by factors such as economies of scale, technological advancements, and access to capital. The report details the market share distribution among major players like Suez SA, A2A SpA, Martin GmbH, Wheelabrator Technologies, Hitachi Zosen Corp, Veolia Environnement SA, STEAG Energy Services GmbH, and Mitsubishi Heavy Industries Ltd. Mergers and acquisitions (M&A) activities play a significant role in shaping the competitive landscape, with deal values ranging from xx Million to xx Million in recent years. Innovation in WtE technologies, driven by stricter environmental regulations and the need for sustainable waste management solutions, is a key catalyst for market growth. Substitute products, such as landfilling and anaerobic digestion, compete with WtE, yet stringent regulations are increasingly favoring WtE's environmental benefits. End-users span municipalities, industrial facilities, and energy companies, each with unique requirements and priorities.
- Market Share Distribution: Detailed breakdown of market share held by leading companies.
- M&A Activity: Analysis of recent M&A deals, including deal values and strategic implications.
- Regulatory Landscape: Examination of key regulations impacting the market, including emission standards and waste management policies.
- Substitute Products: Comparative analysis of WtE against competing waste management technologies.
- End-User Profiles: Detailed profiles of key end-users and their specific needs.
Europe Waste-to-Energy Market Industry Evolution
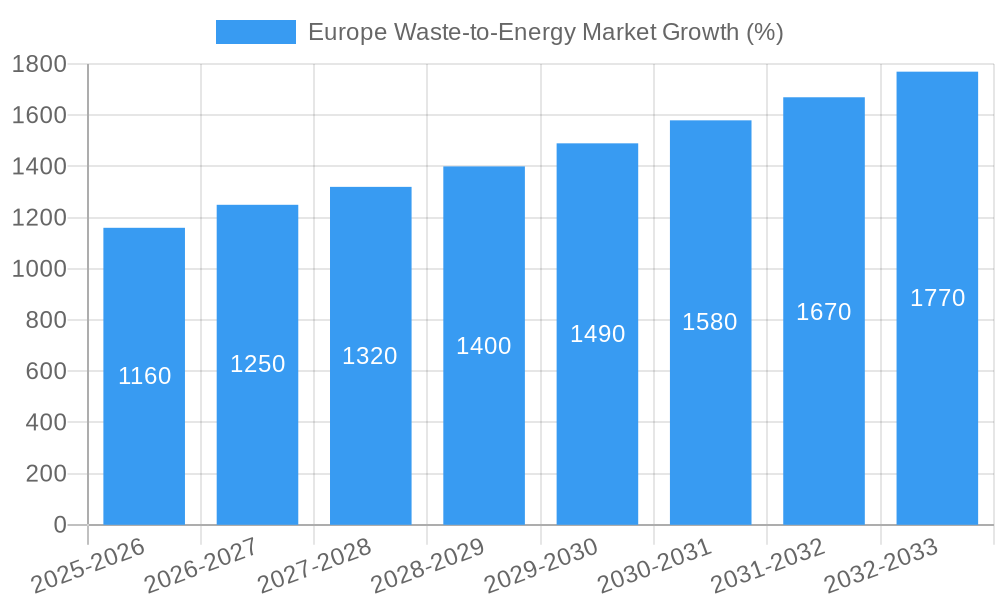
The European WtE market has witnessed significant growth during the historical period (2019-2024), driven by increasing waste generation, stringent environmental regulations, and the growing need for renewable energy sources. The market is expected to maintain a robust growth trajectory throughout the forecast period (2025-2033). Technological advancements, particularly in gasification and pyrolysis, have enhanced the efficiency and environmental performance of WtE plants. Consumer demands for sustainable waste management solutions are also boosting the adoption of WtE technologies. The report analyzes the historical and projected growth rates, adoption metrics, and technological advancements shaping the industry's evolution. Specific data points, such as compound annual growth rate (CAGR) and penetration rates, will be provided. The evolution includes shifts towards advanced technologies like gasification and the integration of carbon capture and utilization (CCU) technologies as exemplified by Fortum’s Carbon2x initiative.
Leading Regions, Countries, or Segments in Europe Waste-to-Energy Market
Germany, the United Kingdom, and other Nordic countries currently lead the European WtE market due to factors such as established regulatory frameworks, substantial investments in WtE infrastructure, and advanced technological capabilities. However, other countries like Italy and France are witnessing rapid growth, driven by increasing waste generation and government support for renewable energy.
- Germany: Strong regulatory support, high investment in WtE infrastructure, and advanced technological expertise.
- United Kingdom: Growing emphasis on renewable energy, coupled with government incentives for WtE projects.
- Nordic Countries: High levels of public awareness of environmental issues and strong commitment to sustainable waste management.
- Italy: Increasing waste generation and government initiatives to promote WtE as a solution.
- France: Significant investments in WtE facilities and a supportive regulatory environment.
- Spain, Turkey, Russia, Rest of Europe: Emerging markets with significant growth potential.
Europe Waste-to-Energy Market Product Innovations
Recent innovations in the WtE sector include advanced gasification and pyrolysis technologies, which offer higher energy efficiency and reduced greenhouse gas emissions. These technologies are enhancing the overall performance metrics of WtE plants, resulting in increased energy recovery and reduced environmental impact. Furthermore, the integration of carbon capture and utilization (CCU) systems, such as Fortum's Carbon2x concept, represents a major step toward decarbonizing the WtE industry.
Propelling Factors for Europe Waste-to-Energy Market Growth
Stringent environmental regulations aimed at reducing landfill waste and promoting renewable energy sources are major drivers of WtE market growth. Economic incentives, such as feed-in tariffs and tax benefits, further incentivize investments in WtE projects. Technological advancements, particularly in gasification and pyrolysis, have enhanced the efficiency and environmental performance of WtE plants, further boosting market growth. The growing awareness among consumers about sustainable waste management practices also fuels market expansion.
Obstacles in the Europe Waste-to-Energy Market Market
High capital costs associated with building and operating WtE plants pose a significant barrier to market entry for smaller companies. Supply chain disruptions and fluctuating raw material prices can also impact profitability. Furthermore, opposition from local communities due to environmental concerns and potential risks related to emissions remains a hurdle to overcome. Regulatory complexities and permitting processes can also delay or hinder project development.
Future Opportunities in Europe Waste-to-Energy Market
Emerging opportunities lie in the development and deployment of advanced WtE technologies, such as gasification and pyrolysis, offering enhanced efficiency and reduced environmental impact. The integration of carbon capture and utilization (CCU) systems presents a pathway to decarbonize the WtE industry. Expansion into new markets and the development of innovative business models, such as waste-to-energy-to-product models, offer promising avenues for growth.
Major Players in the Europe Waste-to-Energy Market Ecosystem
- Suez SA
- A2A SpA
- Martin GmbH
- Wheelabrator Technologies
- Hitachi Zosen Corp
- Veolia Environnement SA
- STEAG Energy Services GmbH
- Mitsubishi Heavy Industries Ltd
Key Developments in Europe Waste-to-Energy Market Industry
- September 2022: Fortum announced the expansion of its UK operations and the development of a new WtE plant in Scotland, incorporating its innovative Carbon2x concept for carbon capture and utilization.
- July 2022: The mayor of Rome announced plans to construct an incinerator within the city to handle unsorted waste, representing a significant shift in waste management strategy.
Strategic Europe Waste-to-Energy Market Market Forecast
The European WtE market is poised for significant growth over the forecast period (2025-2033), driven by increasing waste generation, stringent environmental regulations, and technological advancements. The growing adoption of advanced technologies, coupled with supportive government policies and increasing consumer demand for sustainable waste management solutions, will further accelerate market expansion. The market's potential is substantial, with opportunities for innovation and investment across the entire value chain.
Europe Waste-to-Energy Market Segmentation
- 1. Thermal
-
2. Source:
- 2.1. Physical
- 2.2. Biological
Europe Waste-to-Energy Market Segmentation By Geography
-
1. Europe
- 1.1. United Kingdom
- 1.2. Germany
- 1.3. France
- 1.4. Italy
- 1.5. Spain
- 1.6. Netherlands
- 1.7. Belgium
- 1.8. Sweden
- 1.9. Norway
- 1.10. Poland
- 1.11. Denmark
Europe Waste-to-Energy Market REPORT HIGHLIGHTS
| Aspects | Details |
|---|---|
| Study Period | 2019-2033 |
| Base Year | 2024 |
| Estimated Year | 2025 |
| Forecast Period | 2025-2033 |
| Historical Period | 2019-2024 |
| Growth Rate | CAGR of 5.54% from 2019-2033 |
| Segmentation |
|
Table of Contents
- 1. Introduction
- 1.1. Research Scope
- 1.2. Market Segmentation
- 1.3. Research Methodology
- 1.4. Definitions and Assumptions
- 2. Executive Summary
- 2.1. Introduction
- 3. Market Dynamics
- 3.1. Introduction
- 3.2. Market Drivers
- 3.2.1. 4.; Government Focus on Waste Management4.; Decline in Fossil-fuel based Electricity Generation
- 3.3. Market Restrains
- 3.3.1. 4.; High Price of Incinerators and Decline in Energy Price of Other Renewable Energy Sources
- 3.4. Market Trends
- 3.4.1. Thermal-based Waste-to-Energy Segment to Dominate the Market
- 4. Market Factor Analysis
- 4.1. Porters Five Forces
- 4.2. Supply/Value Chain
- 4.3. PESTEL analysis
- 4.4. Market Entropy
- 4.5. Patent/Trademark Analysis
- 5. Europe Waste-to-Energy Market Analysis, Insights and Forecast, 2019-2031
- 5.1. Market Analysis, Insights and Forecast - by Thermal
- 5.2. Market Analysis, Insights and Forecast - by Source:
- 5.2.1. Physical
- 5.2.2. Biological
- 5.3. Market Analysis, Insights and Forecast - by Region
- 5.3.1. Europe
- 5.1. Market Analysis, Insights and Forecast - by Thermal
- 6. Germany Europe Waste-to-Energy Market Analysis, Insights and Forecast, 2019-2031
- 7. France Europe Waste-to-Energy Market Analysis, Insights and Forecast, 2019-2031
- 8. Italy Europe Waste-to-Energy Market Analysis, Insights and Forecast, 2019-2031
- 9. United Kingdom Europe Waste-to-Energy Market Analysis, Insights and Forecast, 2019-2031
- 10. Netherlands Europe Waste-to-Energy Market Analysis, Insights and Forecast, 2019-2031
- 11. Sweden Europe Waste-to-Energy Market Analysis, Insights and Forecast, 2019-2031
- 12. Rest of Europe Europe Waste-to-Energy Market Analysis, Insights and Forecast, 2019-2031
- 13. Competitive Analysis
- 13.1. Market Share Analysis 2024
- 13.2. Company Profiles
- 13.2.1 Suez SA
- 13.2.1.1. Overview
- 13.2.1.2. Products
- 13.2.1.3. SWOT Analysis
- 13.2.1.4. Recent Developments
- 13.2.1.5. Financials (Based on Availability)
- 13.2.2 A2A SpA
- 13.2.2.1. Overview
- 13.2.2.2. Products
- 13.2.2.3. SWOT Analysis
- 13.2.2.4. Recent Developments
- 13.2.2.5. Financials (Based on Availability)
- 13.2.3 Martin GmbH
- 13.2.3.1. Overview
- 13.2.3.2. Products
- 13.2.3.3. SWOT Analysis
- 13.2.3.4. Recent Developments
- 13.2.3.5. Financials (Based on Availability)
- 13.2.4 Wheelabrator Technologies
- 13.2.4.1. Overview
- 13.2.4.2. Products
- 13.2.4.3. SWOT Analysis
- 13.2.4.4. Recent Developments
- 13.2.4.5. Financials (Based on Availability)
- 13.2.5 Hitachi Zosen Corp
- 13.2.5.1. Overview
- 13.2.5.2. Products
- 13.2.5.3. SWOT Analysis
- 13.2.5.4. Recent Developments
- 13.2.5.5. Financials (Based on Availability)
- 13.2.6 Veolia Environnement SA
- 13.2.6.1. Overview
- 13.2.6.2. Products
- 13.2.6.3. SWOT Analysis
- 13.2.6.4. Recent Developments
- 13.2.6.5. Financials (Based on Availability)
- 13.2.7 STEAG Energy Services GmbH
- 13.2.7.1. Overview
- 13.2.7.2. Products
- 13.2.7.3. SWOT Analysis
- 13.2.7.4. Recent Developments
- 13.2.7.5. Financials (Based on Availability)
- 13.2.8 Mitsubishi Heavy Industries Ltd
- 13.2.8.1. Overview
- 13.2.8.2. Products
- 13.2.8.3. SWOT Analysis
- 13.2.8.4. Recent Developments
- 13.2.8.5. Financials (Based on Availability)
- 13.2.1 Suez SA
List of Figures
- Figure 1: Europe Waste-to-Energy Market Revenue Breakdown (Million, %) by Product 2024 & 2032
- Figure 2: Europe Waste-to-Energy Market Share (%) by Company 2024
List of Tables
- Table 1: Europe Waste-to-Energy Market Revenue Million Forecast, by Region 2019 & 2032
- Table 2: Europe Waste-to-Energy Market Volume Gigawatt Forecast, by Region 2019 & 2032
- Table 3: Europe Waste-to-Energy Market Revenue Million Forecast, by Thermal 2019 & 2032
- Table 4: Europe Waste-to-Energy Market Volume Gigawatt Forecast, by Thermal 2019 & 2032
- Table 5: Europe Waste-to-Energy Market Revenue Million Forecast, by Source: 2019 & 2032
- Table 6: Europe Waste-to-Energy Market Volume Gigawatt Forecast, by Source: 2019 & 2032
- Table 7: Europe Waste-to-Energy Market Revenue Million Forecast, by Region 2019 & 2032
- Table 8: Europe Waste-to-Energy Market Volume Gigawatt Forecast, by Region 2019 & 2032
- Table 9: Europe Waste-to-Energy Market Revenue Million Forecast, by Country 2019 & 2032
- Table 10: Europe Waste-to-Energy Market Volume Gigawatt Forecast, by Country 2019 & 2032
- Table 11: Germany Europe Waste-to-Energy Market Revenue (Million) Forecast, by Application 2019 & 2032
- Table 12: Germany Europe Waste-to-Energy Market Volume (Gigawatt) Forecast, by Application 2019 & 2032
- Table 13: France Europe Waste-to-Energy Market Revenue (Million) Forecast, by Application 2019 & 2032
- Table 14: France Europe Waste-to-Energy Market Volume (Gigawatt) Forecast, by Application 2019 & 2032
- Table 15: Italy Europe Waste-to-Energy Market Revenue (Million) Forecast, by Application 2019 & 2032
- Table 16: Italy Europe Waste-to-Energy Market Volume (Gigawatt) Forecast, by Application 2019 & 2032
- Table 17: United Kingdom Europe Waste-to-Energy Market Revenue (Million) Forecast, by Application 2019 & 2032
- Table 18: United Kingdom Europe Waste-to-Energy Market Volume (Gigawatt) Forecast, by Application 2019 & 2032
- Table 19: Netherlands Europe Waste-to-Energy Market Revenue (Million) Forecast, by Application 2019 & 2032
- Table 20: Netherlands Europe Waste-to-Energy Market Volume (Gigawatt) Forecast, by Application 2019 & 2032
- Table 21: Sweden Europe Waste-to-Energy Market Revenue (Million) Forecast, by Application 2019 & 2032
- Table 22: Sweden Europe Waste-to-Energy Market Volume (Gigawatt) Forecast, by Application 2019 & 2032
- Table 23: Rest of Europe Europe Waste-to-Energy Market Revenue (Million) Forecast, by Application 2019 & 2032
- Table 24: Rest of Europe Europe Waste-to-Energy Market Volume (Gigawatt) Forecast, by Application 2019 & 2032
- Table 25: Europe Waste-to-Energy Market Revenue Million Forecast, by Thermal 2019 & 2032
- Table 26: Europe Waste-to-Energy Market Volume Gigawatt Forecast, by Thermal 2019 & 2032
- Table 27: Europe Waste-to-Energy Market Revenue Million Forecast, by Source: 2019 & 2032
- Table 28: Europe Waste-to-Energy Market Volume Gigawatt Forecast, by Source: 2019 & 2032
- Table 29: Europe Waste-to-Energy Market Revenue Million Forecast, by Country 2019 & 2032
- Table 30: Europe Waste-to-Energy Market Volume Gigawatt Forecast, by Country 2019 & 2032
- Table 31: United Kingdom Europe Waste-to-Energy Market Revenue (Million) Forecast, by Application 2019 & 2032
- Table 32: United Kingdom Europe Waste-to-Energy Market Volume (Gigawatt) Forecast, by Application 2019 & 2032
- Table 33: Germany Europe Waste-to-Energy Market Revenue (Million) Forecast, by Application 2019 & 2032
- Table 34: Germany Europe Waste-to-Energy Market Volume (Gigawatt) Forecast, by Application 2019 & 2032
- Table 35: France Europe Waste-to-Energy Market Revenue (Million) Forecast, by Application 2019 & 2032
- Table 36: France Europe Waste-to-Energy Market Volume (Gigawatt) Forecast, by Application 2019 & 2032
- Table 37: Italy Europe Waste-to-Energy Market Revenue (Million) Forecast, by Application 2019 & 2032
- Table 38: Italy Europe Waste-to-Energy Market Volume (Gigawatt) Forecast, by Application 2019 & 2032
- Table 39: Spain Europe Waste-to-Energy Market Revenue (Million) Forecast, by Application 2019 & 2032
- Table 40: Spain Europe Waste-to-Energy Market Volume (Gigawatt) Forecast, by Application 2019 & 2032
- Table 41: Netherlands Europe Waste-to-Energy Market Revenue (Million) Forecast, by Application 2019 & 2032
- Table 42: Netherlands Europe Waste-to-Energy Market Volume (Gigawatt) Forecast, by Application 2019 & 2032
- Table 43: Belgium Europe Waste-to-Energy Market Revenue (Million) Forecast, by Application 2019 & 2032
- Table 44: Belgium Europe Waste-to-Energy Market Volume (Gigawatt) Forecast, by Application 2019 & 2032
- Table 45: Sweden Europe Waste-to-Energy Market Revenue (Million) Forecast, by Application 2019 & 2032
- Table 46: Sweden Europe Waste-to-Energy Market Volume (Gigawatt) Forecast, by Application 2019 & 2032
- Table 47: Norway Europe Waste-to-Energy Market Revenue (Million) Forecast, by Application 2019 & 2032
- Table 48: Norway Europe Waste-to-Energy Market Volume (Gigawatt) Forecast, by Application 2019 & 2032
- Table 49: Poland Europe Waste-to-Energy Market Revenue (Million) Forecast, by Application 2019 & 2032
- Table 50: Poland Europe Waste-to-Energy Market Volume (Gigawatt) Forecast, by Application 2019 & 2032
- Table 51: Denmark Europe Waste-to-Energy Market Revenue (Million) Forecast, by Application 2019 & 2032
- Table 52: Denmark Europe Waste-to-Energy Market Volume (Gigawatt) Forecast, by Application 2019 & 2032
Frequently Asked Questions
1. What is the projected Compound Annual Growth Rate (CAGR) of the Europe Waste-to-Energy Market?
The projected CAGR is approximately 5.54%.
2. Which companies are prominent players in the Europe Waste-to-Energy Market?
Key companies in the market include Suez SA, A2A SpA, Martin GmbH, Wheelabrator Technologies, Hitachi Zosen Corp, Veolia Environnement SA, STEAG Energy Services GmbH, Mitsubishi Heavy Industries Ltd.
3. What are the main segments of the Europe Waste-to-Energy Market?
The market segments include Thermal, Source: .
4. Can you provide details about the market size?
The market size is estimated to be USD 20.84 Million as of 2022.
5. What are some drivers contributing to market growth?
4.; Government Focus on Waste Management4.; Decline in Fossil-fuel based Electricity Generation.
6. What are the notable trends driving market growth?
Thermal-based Waste-to-Energy Segment to Dominate the Market.
7. Are there any restraints impacting market growth?
4.; High Price of Incinerators and Decline in Energy Price of Other Renewable Energy Sources.
8. Can you provide examples of recent developments in the market?
September 2022: Fortum announced expanding its UK-based operations and is starting to develop a new WtE plant in Scotland. The market entry is a vital step forward in the company's ambition to transform the WtE sector with its novel Carbon2x concept, which already concluded the first round of pilot testing. The concept aimed to capture emissions from waste incineration and turn them into useful CO2-based, high-quality raw materials. Moreover, the Carbon2x will help reduce the dependence on fossil-based raw materials, improve Europe's self-sufficiency, and decarbonize waste incineration.
9. What pricing options are available for accessing the report?
Pricing options include single-user, multi-user, and enterprise licenses priced at USD 4750, USD 4950, and USD 6800 respectively.
10. Is the market size provided in terms of value or volume?
The market size is provided in terms of value, measured in Million and volume, measured in Gigawatt.
11. Are there any specific market keywords associated with the report?
Yes, the market keyword associated with the report is "Europe Waste-to-Energy Market," which aids in identifying and referencing the specific market segment covered.
12. How do I determine which pricing option suits my needs best?
The pricing options vary based on user requirements and access needs. Individual users may opt for single-user licenses, while businesses requiring broader access may choose multi-user or enterprise licenses for cost-effective access to the report.
13. Are there any additional resources or data provided in the Europe Waste-to-Energy Market report?
While the report offers comprehensive insights, it's advisable to review the specific contents or supplementary materials provided to ascertain if additional resources or data are available.
14. How can I stay updated on further developments or reports in the Europe Waste-to-Energy Market?
To stay informed about further developments, trends, and reports in the Europe Waste-to-Energy Market, consider subscribing to industry newsletters, following relevant companies and organizations, or regularly checking reputable industry news sources and publications.
Methodology
Step 1 - Identification of Relevant Samples Size from Population Database


Step 2 - Approaches for Defining Global Market Size (Value, Volume* & Price*)

Note*: In applicable scenarios
Step 3 - Data Sources
Primary Research
- Web Analytics
- Survey Reports
- Research Institute
- Latest Research Reports
- Opinion Leaders
Secondary Research
- Annual Reports
- White Paper
- Latest Press Release
- Industry Association
- Paid Database
- Investor Presentations

Step 4 - Data Triangulation
Involves using different sources of information in order to increase the validity of a study
These sources are likely to be stakeholders in a program - participants, other researchers, program staff, other community members, and so on.
Then we put all data in single framework & apply various statistical tools to find out the dynamic on the market.
During the analysis stage, feedback from the stakeholder groups would be compared to determine areas of agreement as well as areas of divergence
