

Key Insights
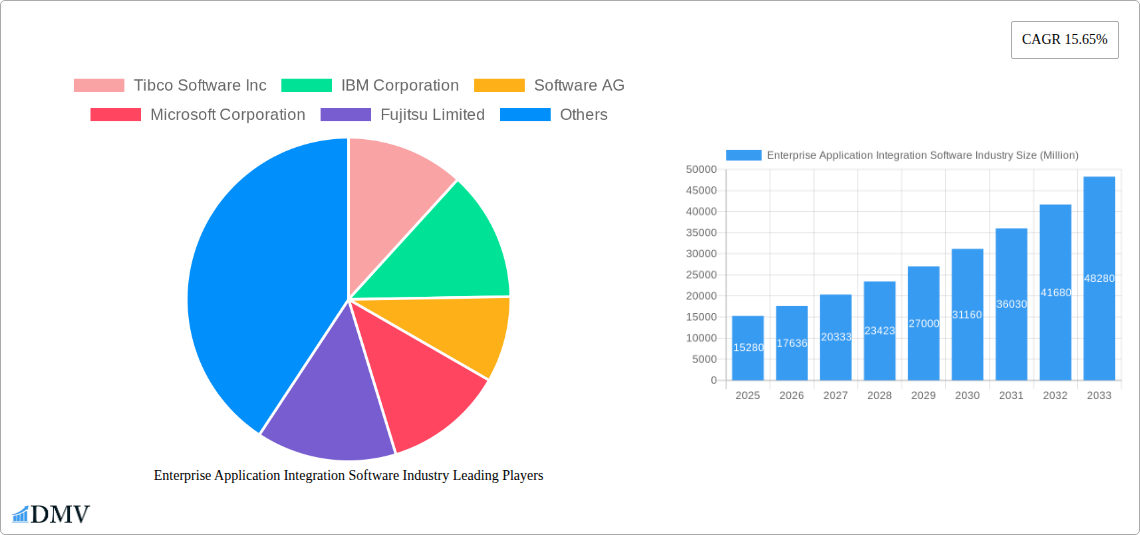
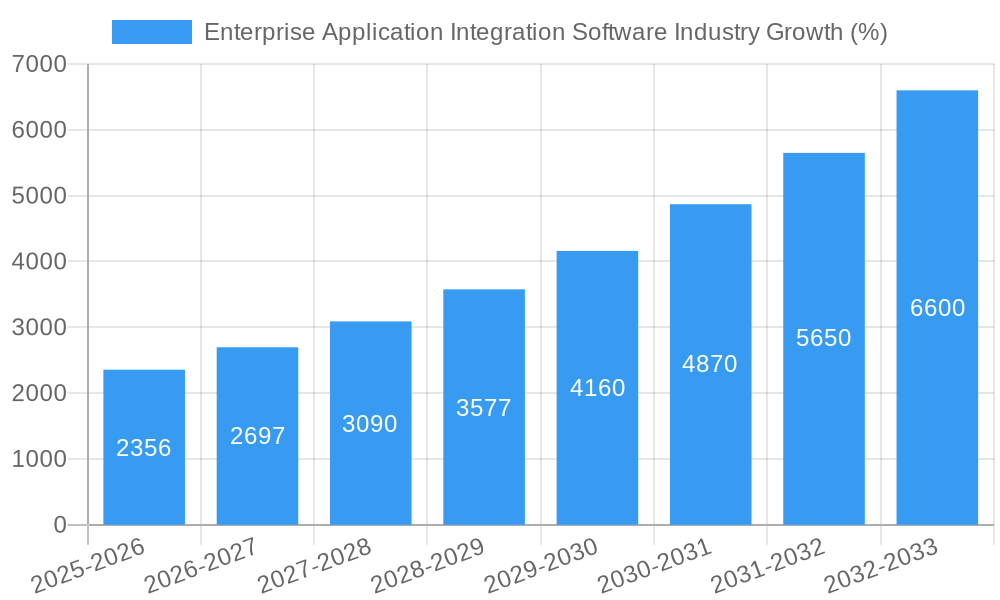
The Enterprise Application Integration (EAI) software market is experiencing robust growth, projected to reach $15.28 billion in 2025 and maintain a Compound Annual Growth Rate (CAGR) of 15.65% from 2025 to 2033. This expansion is driven by several key factors. The increasing adoption of cloud-based solutions offers scalability and cost-effectiveness, fueling market growth significantly. Furthermore, the growing need for real-time data integration across diverse business systems is a major impetus. Businesses are increasingly recognizing the strategic value of seamlessly connecting disparate applications to enhance operational efficiency, improve data visibility, and drive better decision-making. The expansion of digital transformation initiatives across various industries, including BFSI (Banking, Financial Services, and Insurance), IT and Telecom, Healthcare, and Retail, is also a crucial driver, creating significant demand for robust EAI solutions. The shift towards hybrid deployment models, combining on-premise and cloud solutions, offers flexibility and caters to specific organizational needs, further contributing to market growth. Finally, the emergence of advanced technologies such as artificial intelligence (AI) and machine learning (ML) within EAI platforms is enhancing their capabilities and driving adoption.
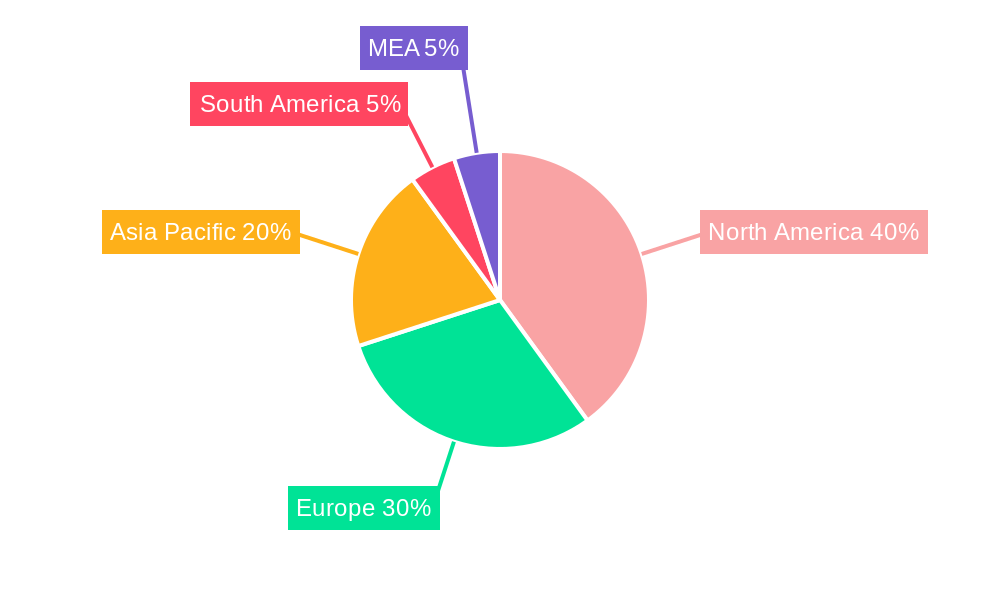
Market segmentation reveals a diverse landscape. Large enterprises represent a significant segment due to their complex IT infrastructures and need for robust integration solutions. However, the increasing digitalization of SMEs is driving growth in this segment as well. Geographically, North America currently holds a substantial market share due to early adoption and technological advancements. However, the Asia-Pacific region is expected to witness significant growth in the coming years, driven by rapid digital transformation and economic expansion in countries like India and China. Competitive forces are intense, with established players like Tibco Software, IBM, Software AG, Microsoft, and Salesforce (through MuleSoft) vying for market share alongside emerging players. The market is characterized by continuous innovation, with vendors focusing on enhancing functionalities, improving user experience, and expanding their product portfolios to meet evolving business needs. This dynamic environment will continue to shape the future of the EAI software market, promising sustained growth and innovation.
Enterprise Application Integration Software Industry Market Report: 2019-2033
This comprehensive report provides a detailed analysis of the Enterprise Application Integration (EAI) software market, offering invaluable insights for stakeholders seeking to navigate this dynamic landscape. The study period spans 2019-2033, with a base year of 2025 and a forecast period of 2025-2033. The report meticulously examines market composition, technological advancements, regional variations, and future growth prospects, providing crucial data points to inform strategic decision-making. The market is projected to reach xx Million by 2033.
Enterprise Application Integration Software Industry Market Composition & Trends
The EAI software market exhibits a moderately concentrated landscape, with key players like Tibco Software Inc, IBM Corporation, Software AG, Microsoft Corporation, Fujitsu Limited, MuleSoft LLC (Salesforce Inc), Oracle Corporation, iTransition Group, and SAP SE commanding significant market share. Market concentration is further influenced by continuous mergers and acquisitions (M&A) activities. Deal values in recent years averaged xx Million per transaction, reflecting the consolidation trend and strategic expansion efforts.
- Market Share Distribution (2024 Estimate): The top 5 players hold approximately xx% of the market share collectively, with Tibco Software Inc and IBM Corporation leading the pack.
- Innovation Catalysts: Cloud adoption, API-led connectivity, and the rise of microservices are primary drivers of innovation.
- Regulatory Landscape: Data privacy regulations (e.g., GDPR, CCPA) significantly impact product development and integration strategies.
- Substitute Products: While limited, point-to-point integrations represent a substitute, though they lack the scalability and efficiency of comprehensive EAI solutions.
- End-User Profiles: Large Enterprises dominate the market, but SME adoption is steadily increasing.
- M&A Activities: The average deal size is projected to increase in the forecast period to xx Million due to strategic acquisitions by larger players.
Enterprise Application Integration Software Industry Evolution
The EAI software market has witnessed substantial growth, fueled by digital transformation initiatives across various sectors. The historical period (2019-2024) saw a Compound Annual Growth Rate (CAGR) of xx%, primarily driven by increasing adoption of cloud-based solutions. Technological advancements, such as AI-powered integration and improved automation capabilities, have further boosted market expansion. The shift towards hybrid and multi-cloud environments also contributes to market growth, presenting opportunities for vendors offering flexible and adaptable integration solutions. Consumer demand increasingly focuses on real-time data integration and enhanced security features, prompting continuous innovation in EAI technology. Furthermore, the growing need for better interoperability across various systems within organizations further boosts adoption. We predict a CAGR of xx% for the forecast period (2025-2033). Adoption metrics show a xx% increase in cloud-based EAI solutions from 2024 to 2025.
Leading Regions, Countries, or Segments in Enterprise Application Integration Software Industry
North America currently holds the largest market share, driven by high technology adoption rates and the presence of major technology companies. However, the Asia-Pacific region is experiencing the fastest growth, fueled by rising digitalization efforts and increasing government investments in IT infrastructure.
Dominant Segments:
- Deployment Type: Cloud-based solutions are the fastest-growing segment, with a projected market share of xx% in 2025. This is fueled by scalability and cost-effectiveness.
- Organization Size: Large Enterprises comprise the majority of the market due to their significant IT budgets and complex integration needs.
- End-user Industry: BFSI and IT & Telecom sectors are leading adopters, driven by the need for secure and reliable data exchange.
Key Drivers:
- Investment Trends: Significant investments in cloud infrastructure and digital transformation initiatives are fueling market growth.
- Regulatory Support: Government policies promoting digitalization and data interoperability are creating favorable conditions for market expansion.
Enterprise Application Integration Software Industry Product Innovations
Recent innovations focus on enhancing integration speed, security, and scalability. The emergence of low-code/no-code platforms simplifies the integration process for non-technical users, while AI-powered capabilities automate data mapping and transformation tasks. Real-time data synchronization and advanced analytics are other key features driving product differentiation. Unique selling propositions (USPs) include improved user experience, enhanced security features (e.g., encryption, access control), and support for a wider range of data formats and protocols.
Propelling Factors for Enterprise Application Integration Software Industry Growth
Technological advancements, particularly in cloud computing, AI, and machine learning, are key growth drivers. Furthermore, economic factors such as increasing IT budgets and the rising demand for efficient business processes are also propelling market growth. Favorable government regulations that promote digital transformation are also contributing to this growth. For example, government incentives for cloud adoption in various regions are significantly boosting market expansion.
Obstacles in the Enterprise Application Integration Software Industry Market
High initial investment costs and the complexity of integration projects can present barriers to entry. Supply chain disruptions can impact the availability of hardware and software components. Intense competition among established players and the emergence of new entrants creates pricing pressures and necessitates continuous innovation. These factors combined can reduce the market expansion rate by a predicted xx% by 2030.
Future Opportunities in Enterprise Application Integration Software Industry
The increasing adoption of IoT devices, the expansion of 5G networks, and the growth of edge computing will create significant opportunities. The integration of blockchain technology for secure data exchange and the development of specialized EAI solutions for specific industry verticals (e.g., healthcare, manufacturing) are also promising areas for future growth. Expanding into emerging markets with increasing digitalization efforts will unlock significant potential.
Major Players in the Enterprise Application Integration Software Industry Ecosystem
- Tibco Software Inc
- IBM Corporation
- Software AG
- Microsoft Corporation
- Fujitsu Limited
- MuleSoft LLC (Salesforce Inc)
- Oracle Corporation
- iTransition Group
- SAP SE
Key Developments in Enterprise Application Integration Software Industry Industry
- July 2022: TIBCO Software Inc announced significant improvements to its TIBCO Cloud Integration product, enhancing hybrid environment capabilities.
- August 2022: Salsify launched a MuleSoft Certified Connector, simplifying integration with its product data platform.
Strategic Enterprise Application Integration Software Industry Market Forecast
The EAI software market is poised for significant growth, driven by continued digital transformation, cloud adoption, and technological advancements. The forecast period will witness robust expansion, with a projected CAGR exceeding xx%, primarily fueled by the increasing demand for seamless data integration across diverse systems and the rising adoption of cloud-based solutions. Expanding into new industry verticals and leveraging emerging technologies like AI and blockchain will further contribute to market growth.
Enterprise Application Integration Software Industry Segmentation
-
1. Deployment Type
- 1.1. On-premise
- 1.2. Cloud
- 1.3. Hybrid
-
2. Organisation Size
- 2.1. Large Enterprises
- 2.2. Small and Medium-sized Enterprises
-
3. End-user Industry
- 3.1. BFSI
- 3.2. IT and Telecom
- 3.3. Healthcare
- 3.4. Retail
- 3.5. Government
- 3.6. Manufacturing
- 3.7. Other End-user Industries
Enterprise Application Integration Software Industry Segmentation By Geography
- 1. North America
- 2. Europe
- 3. Asia Pacific
- 4. Latin America
- 5. Middle East and Africa
Enterprise Application Integration Software Industry REPORT HIGHLIGHTS
| Aspects | Details |
|---|---|
| Study Period | 2019-2033 |
| Base Year | 2024 |
| Estimated Year | 2025 |
| Forecast Period | 2025-2033 |
| Historical Period | 2019-2024 |
| Growth Rate | CAGR of 15.65% from 2019-2033 |
| Segmentation |
|
Table of Contents
- 1. Introduction
- 1.1. Research Scope
- 1.2. Market Segmentation
- 1.3. Research Methodology
- 1.4. Definitions and Assumptions
- 2. Executive Summary
- 2.1. Introduction
- 3. Market Dynamics
- 3.1. Introduction
- 3.2. Market Drivers
- 3.2.1. Increasing Digital Transformation across Industries; Increasing Demand for Real-time Data Access and Management
- 3.3. Market Restrains
- 3.3.1. Loss of Control over Data Location Hinders the Market
- 3.4. Market Trends
- 3.4.1. Increasing Digital Transformation Across Industries to Drive the Market
- 4. Market Factor Analysis
- 4.1. Porters Five Forces
- 4.2. Supply/Value Chain
- 4.3. PESTEL analysis
- 4.4. Market Entropy
- 4.5. Patent/Trademark Analysis
- 5. Global Enterprise Application Integration Software Industry Analysis, Insights and Forecast, 2019-2031
- 5.1. Market Analysis, Insights and Forecast - by Deployment Type
- 5.1.1. On-premise
- 5.1.2. Cloud
- 5.1.3. Hybrid
- 5.2. Market Analysis, Insights and Forecast - by Organisation Size
- 5.2.1. Large Enterprises
- 5.2.2. Small and Medium-sized Enterprises
- 5.3. Market Analysis, Insights and Forecast - by End-user Industry
- 5.3.1. BFSI
- 5.3.2. IT and Telecom
- 5.3.3. Healthcare
- 5.3.4. Retail
- 5.3.5. Government
- 5.3.6. Manufacturing
- 5.3.7. Other End-user Industries
- 5.4. Market Analysis, Insights and Forecast - by Region
- 5.4.1. North America
- 5.4.2. Europe
- 5.4.3. Asia Pacific
- 5.4.4. Latin America
- 5.4.5. Middle East and Africa
- 5.1. Market Analysis, Insights and Forecast - by Deployment Type
- 6. North America Enterprise Application Integration Software Industry Analysis, Insights and Forecast, 2019-2031
- 6.1. Market Analysis, Insights and Forecast - by Deployment Type
- 6.1.1. On-premise
- 6.1.2. Cloud
- 6.1.3. Hybrid
- 6.2. Market Analysis, Insights and Forecast - by Organisation Size
- 6.2.1. Large Enterprises
- 6.2.2. Small and Medium-sized Enterprises
- 6.3. Market Analysis, Insights and Forecast - by End-user Industry
- 6.3.1. BFSI
- 6.3.2. IT and Telecom
- 6.3.3. Healthcare
- 6.3.4. Retail
- 6.3.5. Government
- 6.3.6. Manufacturing
- 6.3.7. Other End-user Industries
- 6.1. Market Analysis, Insights and Forecast - by Deployment Type
- 7. Europe Enterprise Application Integration Software Industry Analysis, Insights and Forecast, 2019-2031
- 7.1. Market Analysis, Insights and Forecast - by Deployment Type
- 7.1.1. On-premise
- 7.1.2. Cloud
- 7.1.3. Hybrid
- 7.2. Market Analysis, Insights and Forecast - by Organisation Size
- 7.2.1. Large Enterprises
- 7.2.2. Small and Medium-sized Enterprises
- 7.3. Market Analysis, Insights and Forecast - by End-user Industry
- 7.3.1. BFSI
- 7.3.2. IT and Telecom
- 7.3.3. Healthcare
- 7.3.4. Retail
- 7.3.5. Government
- 7.3.6. Manufacturing
- 7.3.7. Other End-user Industries
- 7.1. Market Analysis, Insights and Forecast - by Deployment Type
- 8. Asia Pacific Enterprise Application Integration Software Industry Analysis, Insights and Forecast, 2019-2031
- 8.1. Market Analysis, Insights and Forecast - by Deployment Type
- 8.1.1. On-premise
- 8.1.2. Cloud
- 8.1.3. Hybrid
- 8.2. Market Analysis, Insights and Forecast - by Organisation Size
- 8.2.1. Large Enterprises
- 8.2.2. Small and Medium-sized Enterprises
- 8.3. Market Analysis, Insights and Forecast - by End-user Industry
- 8.3.1. BFSI
- 8.3.2. IT and Telecom
- 8.3.3. Healthcare
- 8.3.4. Retail
- 8.3.5. Government
- 8.3.6. Manufacturing
- 8.3.7. Other End-user Industries
- 8.1. Market Analysis, Insights and Forecast - by Deployment Type
- 9. Latin America Enterprise Application Integration Software Industry Analysis, Insights and Forecast, 2019-2031
- 9.1. Market Analysis, Insights and Forecast - by Deployment Type
- 9.1.1. On-premise
- 9.1.2. Cloud
- 9.1.3. Hybrid
- 9.2. Market Analysis, Insights and Forecast - by Organisation Size
- 9.2.1. Large Enterprises
- 9.2.2. Small and Medium-sized Enterprises
- 9.3. Market Analysis, Insights and Forecast - by End-user Industry
- 9.3.1. BFSI
- 9.3.2. IT and Telecom
- 9.3.3. Healthcare
- 9.3.4. Retail
- 9.3.5. Government
- 9.3.6. Manufacturing
- 9.3.7. Other End-user Industries
- 9.1. Market Analysis, Insights and Forecast - by Deployment Type
- 10. Middle East and Africa Enterprise Application Integration Software Industry Analysis, Insights and Forecast, 2019-2031
- 10.1. Market Analysis, Insights and Forecast - by Deployment Type
- 10.1.1. On-premise
- 10.1.2. Cloud
- 10.1.3. Hybrid
- 10.2. Market Analysis, Insights and Forecast - by Organisation Size
- 10.2.1. Large Enterprises
- 10.2.2. Small and Medium-sized Enterprises
- 10.3. Market Analysis, Insights and Forecast - by End-user Industry
- 10.3.1. BFSI
- 10.3.2. IT and Telecom
- 10.3.3. Healthcare
- 10.3.4. Retail
- 10.3.5. Government
- 10.3.6. Manufacturing
- 10.3.7. Other End-user Industries
- 10.1. Market Analysis, Insights and Forecast - by Deployment Type
- 11. North America Enterprise Application Integration Software Industry Analysis, Insights and Forecast, 2019-2031
- 11.1. Market Analysis, Insights and Forecast - By Country/Sub-region
- 11.1.1 United States
- 11.1.2 Canada
- 11.1.3 Mexico
- 12. Europe Enterprise Application Integration Software Industry Analysis, Insights and Forecast, 2019-2031
- 12.1. Market Analysis, Insights and Forecast - By Country/Sub-region
- 12.1.1 Germany
- 12.1.2 United Kingdom
- 12.1.3 France
- 12.1.4 Spain
- 12.1.5 Italy
- 12.1.6 Spain
- 12.1.7 Belgium
- 12.1.8 Netherland
- 12.1.9 Nordics
- 12.1.10 Rest of Europe
- 13. Asia Pacific Enterprise Application Integration Software Industry Analysis, Insights and Forecast, 2019-2031
- 13.1. Market Analysis, Insights and Forecast - By Country/Sub-region
- 13.1.1 China
- 13.1.2 Japan
- 13.1.3 India
- 13.1.4 South Korea
- 13.1.5 Southeast Asia
- 13.1.6 Australia
- 13.1.7 Indonesia
- 13.1.8 Phillipes
- 13.1.9 Singapore
- 13.1.10 Thailandc
- 13.1.11 Rest of Asia Pacific
- 14. South America Enterprise Application Integration Software Industry Analysis, Insights and Forecast, 2019-2031
- 14.1. Market Analysis, Insights and Forecast - By Country/Sub-region
- 14.1.1 Brazil
- 14.1.2 Argentina
- 14.1.3 Peru
- 14.1.4 Chile
- 14.1.5 Colombia
- 14.1.6 Ecuador
- 14.1.7 Venezuela
- 14.1.8 Rest of South America
- 15. North America Enterprise Application Integration Software Industry Analysis, Insights and Forecast, 2019-2031
- 15.1. Market Analysis, Insights and Forecast - By Country/Sub-region
- 15.1.1 United States
- 15.1.2 Canada
- 15.1.3 Mexico
- 16. MEA Enterprise Application Integration Software Industry Analysis, Insights and Forecast, 2019-2031
- 16.1. Market Analysis, Insights and Forecast - By Country/Sub-region
- 16.1.1 United Arab Emirates
- 16.1.2 Saudi Arabia
- 16.1.3 South Africa
- 16.1.4 Rest of Middle East and Africa
- 17. Competitive Analysis
- 17.1. Global Market Share Analysis 2024
- 17.2. Company Profiles
- 17.2.1 Tibco Software Inc
- 17.2.1.1. Overview
- 17.2.1.2. Products
- 17.2.1.3. SWOT Analysis
- 17.2.1.4. Recent Developments
- 17.2.1.5. Financials (Based on Availability)
- 17.2.2 IBM Corporation
- 17.2.2.1. Overview
- 17.2.2.2. Products
- 17.2.2.3. SWOT Analysis
- 17.2.2.4. Recent Developments
- 17.2.2.5. Financials (Based on Availability)
- 17.2.3 Software AG
- 17.2.3.1. Overview
- 17.2.3.2. Products
- 17.2.3.3. SWOT Analysis
- 17.2.3.4. Recent Developments
- 17.2.3.5. Financials (Based on Availability)
- 17.2.4 Microsoft Corporation
- 17.2.4.1. Overview
- 17.2.4.2. Products
- 17.2.4.3. SWOT Analysis
- 17.2.4.4. Recent Developments
- 17.2.4.5. Financials (Based on Availability)
- 17.2.5 Fujitsu Limited
- 17.2.5.1. Overview
- 17.2.5.2. Products
- 17.2.5.3. SWOT Analysis
- 17.2.5.4. Recent Developments
- 17.2.5.5. Financials (Based on Availability)
- 17.2.6 MuleSoft LLC (Salesforce Inc )
- 17.2.6.1. Overview
- 17.2.6.2. Products
- 17.2.6.3. SWOT Analysis
- 17.2.6.4. Recent Developments
- 17.2.6.5. Financials (Based on Availability)
- 17.2.7 Oracle Corporation
- 17.2.7.1. Overview
- 17.2.7.2. Products
- 17.2.7.3. SWOT Analysis
- 17.2.7.4. Recent Developments
- 17.2.7.5. Financials (Based on Availability)
- 17.2.8 iTransition Group*List Not Exhaustive
- 17.2.8.1. Overview
- 17.2.8.2. Products
- 17.2.8.3. SWOT Analysis
- 17.2.8.4. Recent Developments
- 17.2.8.5. Financials (Based on Availability)
- 17.2.9 SAP SE
- 17.2.9.1. Overview
- 17.2.9.2. Products
- 17.2.9.3. SWOT Analysis
- 17.2.9.4. Recent Developments
- 17.2.9.5. Financials (Based on Availability)
- 17.2.1 Tibco Software Inc
List of Figures
- Figure 1: Global Enterprise Application Integration Software Industry Revenue Breakdown (Million, %) by Region 2024 & 2032
- Figure 2: North America Enterprise Application Integration Software Industry Revenue (Million), by Country 2024 & 2032
- Figure 3: North America Enterprise Application Integration Software Industry Revenue Share (%), by Country 2024 & 2032
- Figure 4: Europe Enterprise Application Integration Software Industry Revenue (Million), by Country 2024 & 2032
- Figure 5: Europe Enterprise Application Integration Software Industry Revenue Share (%), by Country 2024 & 2032
- Figure 6: Asia Pacific Enterprise Application Integration Software Industry Revenue (Million), by Country 2024 & 2032
- Figure 7: Asia Pacific Enterprise Application Integration Software Industry Revenue Share (%), by Country 2024 & 2032
- Figure 8: South America Enterprise Application Integration Software Industry Revenue (Million), by Country 2024 & 2032
- Figure 9: South America Enterprise Application Integration Software Industry Revenue Share (%), by Country 2024 & 2032
- Figure 10: North America Enterprise Application Integration Software Industry Revenue (Million), by Country 2024 & 2032
- Figure 11: North America Enterprise Application Integration Software Industry Revenue Share (%), by Country 2024 & 2032
- Figure 12: MEA Enterprise Application Integration Software Industry Revenue (Million), by Country 2024 & 2032
- Figure 13: MEA Enterprise Application Integration Software Industry Revenue Share (%), by Country 2024 & 2032
- Figure 14: North America Enterprise Application Integration Software Industry Revenue (Million), by Deployment Type 2024 & 2032
- Figure 15: North America Enterprise Application Integration Software Industry Revenue Share (%), by Deployment Type 2024 & 2032
- Figure 16: North America Enterprise Application Integration Software Industry Revenue (Million), by Organisation Size 2024 & 2032
- Figure 17: North America Enterprise Application Integration Software Industry Revenue Share (%), by Organisation Size 2024 & 2032
- Figure 18: North America Enterprise Application Integration Software Industry Revenue (Million), by End-user Industry 2024 & 2032
- Figure 19: North America Enterprise Application Integration Software Industry Revenue Share (%), by End-user Industry 2024 & 2032
- Figure 20: North America Enterprise Application Integration Software Industry Revenue (Million), by Country 2024 & 2032
- Figure 21: North America Enterprise Application Integration Software Industry Revenue Share (%), by Country 2024 & 2032
- Figure 22: Europe Enterprise Application Integration Software Industry Revenue (Million), by Deployment Type 2024 & 2032
- Figure 23: Europe Enterprise Application Integration Software Industry Revenue Share (%), by Deployment Type 2024 & 2032
- Figure 24: Europe Enterprise Application Integration Software Industry Revenue (Million), by Organisation Size 2024 & 2032
- Figure 25: Europe Enterprise Application Integration Software Industry Revenue Share (%), by Organisation Size 2024 & 2032
- Figure 26: Europe Enterprise Application Integration Software Industry Revenue (Million), by End-user Industry 2024 & 2032
- Figure 27: Europe Enterprise Application Integration Software Industry Revenue Share (%), by End-user Industry 2024 & 2032
- Figure 28: Europe Enterprise Application Integration Software Industry Revenue (Million), by Country 2024 & 2032
- Figure 29: Europe Enterprise Application Integration Software Industry Revenue Share (%), by Country 2024 & 2032
- Figure 30: Asia Pacific Enterprise Application Integration Software Industry Revenue (Million), by Deployment Type 2024 & 2032
- Figure 31: Asia Pacific Enterprise Application Integration Software Industry Revenue Share (%), by Deployment Type 2024 & 2032
- Figure 32: Asia Pacific Enterprise Application Integration Software Industry Revenue (Million), by Organisation Size 2024 & 2032
- Figure 33: Asia Pacific Enterprise Application Integration Software Industry Revenue Share (%), by Organisation Size 2024 & 2032
- Figure 34: Asia Pacific Enterprise Application Integration Software Industry Revenue (Million), by End-user Industry 2024 & 2032
- Figure 35: Asia Pacific Enterprise Application Integration Software Industry Revenue Share (%), by End-user Industry 2024 & 2032
- Figure 36: Asia Pacific Enterprise Application Integration Software Industry Revenue (Million), by Country 2024 & 2032
- Figure 37: Asia Pacific Enterprise Application Integration Software Industry Revenue Share (%), by Country 2024 & 2032
- Figure 38: Latin America Enterprise Application Integration Software Industry Revenue (Million), by Deployment Type 2024 & 2032
- Figure 39: Latin America Enterprise Application Integration Software Industry Revenue Share (%), by Deployment Type 2024 & 2032
- Figure 40: Latin America Enterprise Application Integration Software Industry Revenue (Million), by Organisation Size 2024 & 2032
- Figure 41: Latin America Enterprise Application Integration Software Industry Revenue Share (%), by Organisation Size 2024 & 2032
- Figure 42: Latin America Enterprise Application Integration Software Industry Revenue (Million), by End-user Industry 2024 & 2032
- Figure 43: Latin America Enterprise Application Integration Software Industry Revenue Share (%), by End-user Industry 2024 & 2032
- Figure 44: Latin America Enterprise Application Integration Software Industry Revenue (Million), by Country 2024 & 2032
- Figure 45: Latin America Enterprise Application Integration Software Industry Revenue Share (%), by Country 2024 & 2032
- Figure 46: Middle East and Africa Enterprise Application Integration Software Industry Revenue (Million), by Deployment Type 2024 & 2032
- Figure 47: Middle East and Africa Enterprise Application Integration Software Industry Revenue Share (%), by Deployment Type 2024 & 2032
- Figure 48: Middle East and Africa Enterprise Application Integration Software Industry Revenue (Million), by Organisation Size 2024 & 2032
- Figure 49: Middle East and Africa Enterprise Application Integration Software Industry Revenue Share (%), by Organisation Size 2024 & 2032
- Figure 50: Middle East and Africa Enterprise Application Integration Software Industry Revenue (Million), by End-user Industry 2024 & 2032
- Figure 51: Middle East and Africa Enterprise Application Integration Software Industry Revenue Share (%), by End-user Industry 2024 & 2032
- Figure 52: Middle East and Africa Enterprise Application Integration Software Industry Revenue (Million), by Country 2024 & 2032
- Figure 53: Middle East and Africa Enterprise Application Integration Software Industry Revenue Share (%), by Country 2024 & 2032
List of Tables
- Table 1: Global Enterprise Application Integration Software Industry Revenue Million Forecast, by Region 2019 & 2032
- Table 2: Global Enterprise Application Integration Software Industry Revenue Million Forecast, by Deployment Type 2019 & 2032
- Table 3: Global Enterprise Application Integration Software Industry Revenue Million Forecast, by Organisation Size 2019 & 2032
- Table 4: Global Enterprise Application Integration Software Industry Revenue Million Forecast, by End-user Industry 2019 & 2032
- Table 5: Global Enterprise Application Integration Software Industry Revenue Million Forecast, by Region 2019 & 2032
- Table 6: Global Enterprise Application Integration Software Industry Revenue Million Forecast, by Country 2019 & 2032
- Table 7: United States Enterprise Application Integration Software Industry Revenue (Million) Forecast, by Application 2019 & 2032
- Table 8: Canada Enterprise Application Integration Software Industry Revenue (Million) Forecast, by Application 2019 & 2032
- Table 9: Mexico Enterprise Application Integration Software Industry Revenue (Million) Forecast, by Application 2019 & 2032
- Table 10: Global Enterprise Application Integration Software Industry Revenue Million Forecast, by Country 2019 & 2032
- Table 11: Germany Enterprise Application Integration Software Industry Revenue (Million) Forecast, by Application 2019 & 2032
- Table 12: United Kingdom Enterprise Application Integration Software Industry Revenue (Million) Forecast, by Application 2019 & 2032
- Table 13: France Enterprise Application Integration Software Industry Revenue (Million) Forecast, by Application 2019 & 2032
- Table 14: Spain Enterprise Application Integration Software Industry Revenue (Million) Forecast, by Application 2019 & 2032
- Table 15: Italy Enterprise Application Integration Software Industry Revenue (Million) Forecast, by Application 2019 & 2032
- Table 16: Spain Enterprise Application Integration Software Industry Revenue (Million) Forecast, by Application 2019 & 2032
- Table 17: Belgium Enterprise Application Integration Software Industry Revenue (Million) Forecast, by Application 2019 & 2032
- Table 18: Netherland Enterprise Application Integration Software Industry Revenue (Million) Forecast, by Application 2019 & 2032
- Table 19: Nordics Enterprise Application Integration Software Industry Revenue (Million) Forecast, by Application 2019 & 2032
- Table 20: Rest of Europe Enterprise Application Integration Software Industry Revenue (Million) Forecast, by Application 2019 & 2032
- Table 21: Global Enterprise Application Integration Software Industry Revenue Million Forecast, by Country 2019 & 2032
- Table 22: China Enterprise Application Integration Software Industry Revenue (Million) Forecast, by Application 2019 & 2032
- Table 23: Japan Enterprise Application Integration Software Industry Revenue (Million) Forecast, by Application 2019 & 2032
- Table 24: India Enterprise Application Integration Software Industry Revenue (Million) Forecast, by Application 2019 & 2032
- Table 25: South Korea Enterprise Application Integration Software Industry Revenue (Million) Forecast, by Application 2019 & 2032
- Table 26: Southeast Asia Enterprise Application Integration Software Industry Revenue (Million) Forecast, by Application 2019 & 2032
- Table 27: Australia Enterprise Application Integration Software Industry Revenue (Million) Forecast, by Application 2019 & 2032
- Table 28: Indonesia Enterprise Application Integration Software Industry Revenue (Million) Forecast, by Application 2019 & 2032
- Table 29: Phillipes Enterprise Application Integration Software Industry Revenue (Million) Forecast, by Application 2019 & 2032
- Table 30: Singapore Enterprise Application Integration Software Industry Revenue (Million) Forecast, by Application 2019 & 2032
- Table 31: Thailandc Enterprise Application Integration Software Industry Revenue (Million) Forecast, by Application 2019 & 2032
- Table 32: Rest of Asia Pacific Enterprise Application Integration Software Industry Revenue (Million) Forecast, by Application 2019 & 2032
- Table 33: Global Enterprise Application Integration Software Industry Revenue Million Forecast, by Country 2019 & 2032
- Table 34: Brazil Enterprise Application Integration Software Industry Revenue (Million) Forecast, by Application 2019 & 2032
- Table 35: Argentina Enterprise Application Integration Software Industry Revenue (Million) Forecast, by Application 2019 & 2032
- Table 36: Peru Enterprise Application Integration Software Industry Revenue (Million) Forecast, by Application 2019 & 2032
- Table 37: Chile Enterprise Application Integration Software Industry Revenue (Million) Forecast, by Application 2019 & 2032
- Table 38: Colombia Enterprise Application Integration Software Industry Revenue (Million) Forecast, by Application 2019 & 2032
- Table 39: Ecuador Enterprise Application Integration Software Industry Revenue (Million) Forecast, by Application 2019 & 2032
- Table 40: Venezuela Enterprise Application Integration Software Industry Revenue (Million) Forecast, by Application 2019 & 2032
- Table 41: Rest of South America Enterprise Application Integration Software Industry Revenue (Million) Forecast, by Application 2019 & 2032
- Table 42: Global Enterprise Application Integration Software Industry Revenue Million Forecast, by Country 2019 & 2032
- Table 43: United States Enterprise Application Integration Software Industry Revenue (Million) Forecast, by Application 2019 & 2032
- Table 44: Canada Enterprise Application Integration Software Industry Revenue (Million) Forecast, by Application 2019 & 2032
- Table 45: Mexico Enterprise Application Integration Software Industry Revenue (Million) Forecast, by Application 2019 & 2032
- Table 46: Global Enterprise Application Integration Software Industry Revenue Million Forecast, by Country 2019 & 2032
- Table 47: United Arab Emirates Enterprise Application Integration Software Industry Revenue (Million) Forecast, by Application 2019 & 2032
- Table 48: Saudi Arabia Enterprise Application Integration Software Industry Revenue (Million) Forecast, by Application 2019 & 2032
- Table 49: South Africa Enterprise Application Integration Software Industry Revenue (Million) Forecast, by Application 2019 & 2032
- Table 50: Rest of Middle East and Africa Enterprise Application Integration Software Industry Revenue (Million) Forecast, by Application 2019 & 2032
- Table 51: Global Enterprise Application Integration Software Industry Revenue Million Forecast, by Deployment Type 2019 & 2032
- Table 52: Global Enterprise Application Integration Software Industry Revenue Million Forecast, by Organisation Size 2019 & 2032
- Table 53: Global Enterprise Application Integration Software Industry Revenue Million Forecast, by End-user Industry 2019 & 2032
- Table 54: Global Enterprise Application Integration Software Industry Revenue Million Forecast, by Country 2019 & 2032
- Table 55: Global Enterprise Application Integration Software Industry Revenue Million Forecast, by Deployment Type 2019 & 2032
- Table 56: Global Enterprise Application Integration Software Industry Revenue Million Forecast, by Organisation Size 2019 & 2032
- Table 57: Global Enterprise Application Integration Software Industry Revenue Million Forecast, by End-user Industry 2019 & 2032
- Table 58: Global Enterprise Application Integration Software Industry Revenue Million Forecast, by Country 2019 & 2032
- Table 59: Global Enterprise Application Integration Software Industry Revenue Million Forecast, by Deployment Type 2019 & 2032
- Table 60: Global Enterprise Application Integration Software Industry Revenue Million Forecast, by Organisation Size 2019 & 2032
- Table 61: Global Enterprise Application Integration Software Industry Revenue Million Forecast, by End-user Industry 2019 & 2032
- Table 62: Global Enterprise Application Integration Software Industry Revenue Million Forecast, by Country 2019 & 2032
- Table 63: Global Enterprise Application Integration Software Industry Revenue Million Forecast, by Deployment Type 2019 & 2032
- Table 64: Global Enterprise Application Integration Software Industry Revenue Million Forecast, by Organisation Size 2019 & 2032
- Table 65: Global Enterprise Application Integration Software Industry Revenue Million Forecast, by End-user Industry 2019 & 2032
- Table 66: Global Enterprise Application Integration Software Industry Revenue Million Forecast, by Country 2019 & 2032
- Table 67: Global Enterprise Application Integration Software Industry Revenue Million Forecast, by Deployment Type 2019 & 2032
- Table 68: Global Enterprise Application Integration Software Industry Revenue Million Forecast, by Organisation Size 2019 & 2032
- Table 69: Global Enterprise Application Integration Software Industry Revenue Million Forecast, by End-user Industry 2019 & 2032
- Table 70: Global Enterprise Application Integration Software Industry Revenue Million Forecast, by Country 2019 & 2032
Frequently Asked Questions
1. What is the projected Compound Annual Growth Rate (CAGR) of the Enterprise Application Integration Software Industry?
The projected CAGR is approximately 15.65%.
2. Which companies are prominent players in the Enterprise Application Integration Software Industry?
Key companies in the market include Tibco Software Inc, IBM Corporation, Software AG, Microsoft Corporation, Fujitsu Limited, MuleSoft LLC (Salesforce Inc ), Oracle Corporation, iTransition Group*List Not Exhaustive, SAP SE.
3. What are the main segments of the Enterprise Application Integration Software Industry?
The market segments include Deployment Type, Organisation Size, End-user Industry.
4. Can you provide details about the market size?
The market size is estimated to be USD 15.28 Million as of 2022.
5. What are some drivers contributing to market growth?
Increasing Digital Transformation across Industries; Increasing Demand for Real-time Data Access and Management.
6. What are the notable trends driving market growth?
Increasing Digital Transformation Across Industries to Drive the Market.
7. Are there any restraints impacting market growth?
Loss of Control over Data Location Hinders the Market.
8. Can you provide examples of recent developments in the market?
August 2022- Salsify has announced its membership in the MuleSoft Technology Partner Program and its contribution to the partner ecosystem by launching a MuleSoft Certified Connector for Salsify. Companies could use the Salsify connector, accessible in Anypoint Exchange, to simplify the secure integration from upstream ecosystems to Salsify. Due to this, business teams might reliably work with the latest, verified product data. Users may simplify troubleshooting, maintenance, and enhancements to their Salsify integration by centralizing the business logic and data flow design in MuleSoft.
9. What pricing options are available for accessing the report?
Pricing options include single-user, multi-user, and enterprise licenses priced at USD 4750, USD 5250, and USD 8750 respectively.
10. Is the market size provided in terms of value or volume?
The market size is provided in terms of value, measured in Million.
11. Are there any specific market keywords associated with the report?
Yes, the market keyword associated with the report is "Enterprise Application Integration Software Industry," which aids in identifying and referencing the specific market segment covered.
12. How do I determine which pricing option suits my needs best?
The pricing options vary based on user requirements and access needs. Individual users may opt for single-user licenses, while businesses requiring broader access may choose multi-user or enterprise licenses for cost-effective access to the report.
13. Are there any additional resources or data provided in the Enterprise Application Integration Software Industry report?
While the report offers comprehensive insights, it's advisable to review the specific contents or supplementary materials provided to ascertain if additional resources or data are available.
14. How can I stay updated on further developments or reports in the Enterprise Application Integration Software Industry?
To stay informed about further developments, trends, and reports in the Enterprise Application Integration Software Industry, consider subscribing to industry newsletters, following relevant companies and organizations, or regularly checking reputable industry news sources and publications.
Methodology
Step 1 - Identification of Relevant Samples Size from Population Database


Step 2 - Approaches for Defining Global Market Size (Value, Volume* & Price*)

Note*: In applicable scenarios
Step 3 - Data Sources
Primary Research
- Web Analytics
- Survey Reports
- Research Institute
- Latest Research Reports
- Opinion Leaders
Secondary Research
- Annual Reports
- White Paper
- Latest Press Release
- Industry Association
- Paid Database
- Investor Presentations

Step 4 - Data Triangulation
Involves using different sources of information in order to increase the validity of a study
These sources are likely to be stakeholders in a program - participants, other researchers, program staff, other community members, and so on.
Then we put all data in single framework & apply various statistical tools to find out the dynamic on the market.
During the analysis stage, feedback from the stakeholder groups would be compared to determine areas of agreement as well as areas of divergence
