

Key Insights
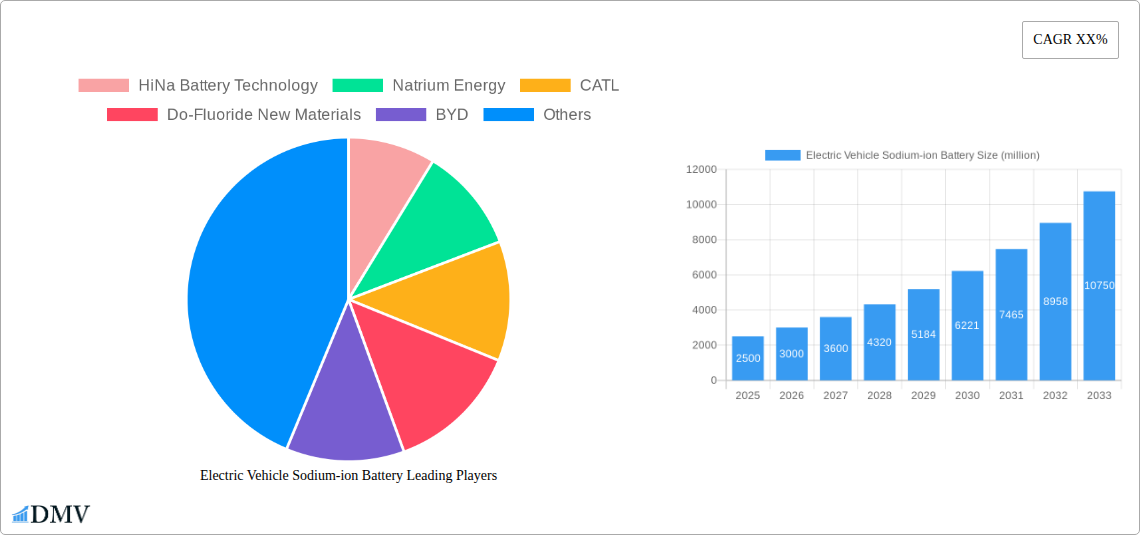
The electric vehicle (EV) sodium-ion battery market is poised for significant growth, driven by the increasing demand for affordable and sustainable energy storage solutions. While lithium-ion batteries currently dominate the EV battery market, the rising cost and supply chain vulnerabilities associated with lithium are fueling exploration of alternative technologies. Sodium-ion batteries offer a compelling solution, boasting abundant and readily available sodium resources, resulting in lower production costs and a reduced environmental footprint. This inherent cost advantage makes sodium-ion batteries particularly attractive for large-scale EV adoption, especially in emerging markets. The market is expected to witness substantial expansion over the next decade, propelled by continuous advancements in battery technology, improving energy density and cycle life, and supportive government policies promoting the adoption of EVs and alternative battery chemistries. Key players like CATL, BYD, and others are actively investing in research and development, driving innovation and accelerating market penetration. While challenges remain in optimizing energy density to compete with lithium-ion batteries in high-performance applications, the advantages of cost-effectiveness and sustainability are positioning sodium-ion batteries as a disruptive force in the long-term EV battery landscape.
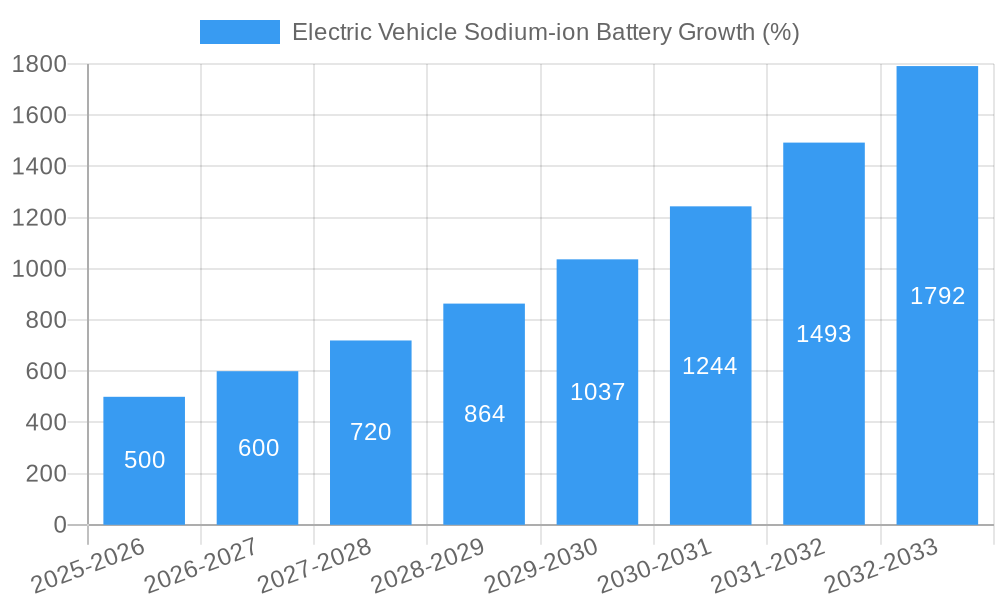
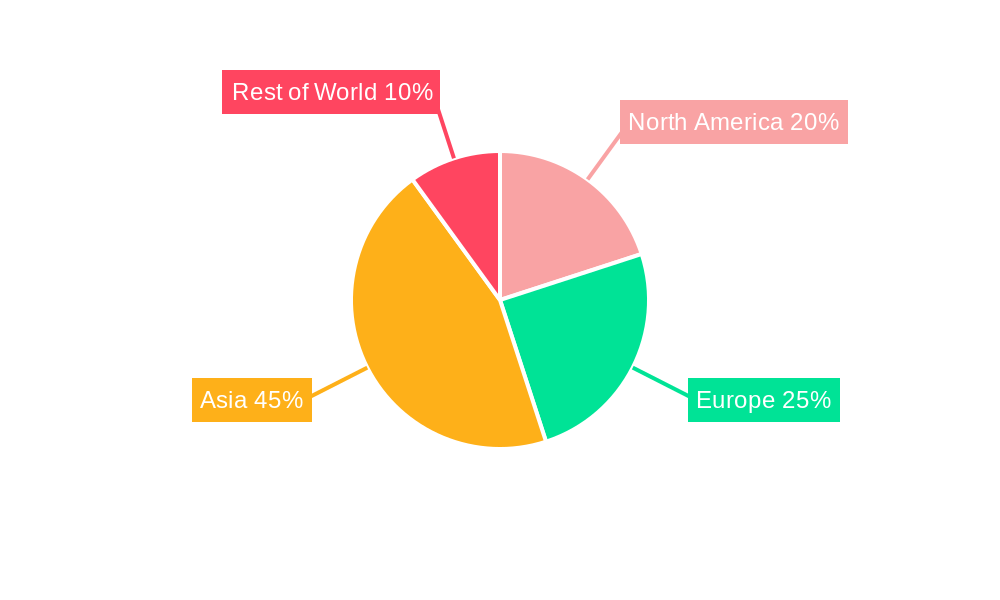
Further market expansion will depend on the successful scaling of production capacity to meet rising demand and overcoming technological hurdles to match the performance of established lithium-ion technologies. Despite this, the market is projected to experience strong CAGR growth, primarily due to the increasing affordability and environmental benefits of sodium-ion batteries. The geographical distribution of the market is likely to reflect existing EV adoption rates, with regions like China and Europe leading the way, followed by North America and other developing economies. The segmentation of the market will reflect varying battery chemistries, capacities, and applications. The competitive landscape is dynamic, with both established battery manufacturers and new entrants vying for market share, accelerating innovation and further pushing down costs.
Electric Vehicle Sodium-ion Battery Market Report: 2019-2033
This comprehensive report provides an in-depth analysis of the burgeoning Electric Vehicle (EV) Sodium-ion Battery market, projecting a market value exceeding $XX million by 2033. The study covers the period 2019-2033, with a focus on the forecast period 2025-2033 and a base year of 2025. Key players like CATL, BYD, and Natrium Energy are profiled, alongside emerging innovators, offering a crucial understanding of this rapidly evolving sector. This report is invaluable for investors, manufacturers, and stakeholders seeking to navigate this exciting technological landscape.
Electric Vehicle Sodium-ion Battery Market Composition & Trends
This section delves into the current market structure, analyzing market concentration, innovation drivers, and regulatory influences shaping the EV sodium-ion battery landscape. We examine the competitive dynamics, including market share distribution among key players such as CATL, BYD, and Natrium Energy. The report also explores the impact of M&A activities, quantifying deal values in millions of dollars over the historical period (2019-2024) and projecting future trends. Substitute products and their competitive pressures are assessed, along with end-user profiles and their evolving needs.
- Market Concentration: The market is currently characterized by [Describe concentration – e.g., fragmented/consolidated, with a breakdown of market share].
- Innovation Catalysts: Advancements in [mention specific technologies e.g., cathode materials, electrolytes] are driving innovation.
- Regulatory Landscape: Government policies and incentives are significantly impacting market growth in [mention key regions].
- M&A Activity: [Describe the number and value (in millions) of M&A deals in the historical period and project future activity]. For example, XX million dollars worth of deals were observed from 2019 to 2024 with an anticipated increase in the coming years.
Electric Vehicle Sodium-ion Battery Industry Evolution
This section meticulously analyzes the historical (2019-2024) and projected (2025-2033) growth trajectory of the EV sodium-ion battery market. It explores technological advancements, pinpointing key milestones and breakthroughs that have propelled market expansion. We examine shifting consumer demands, including preferences for specific battery chemistries, performance metrics, and cost considerations. Growth rates (CAGR) are presented for both the historical and forecast periods, alongside adoption metrics such as the number of EV’s utilizing sodium-ion batteries. This section delves into the factors behind the observed growth, illustrating the market's evolution through quantitative data and qualitative analysis.
Leading Regions, Countries, or Segments in Electric Vehicle Sodium-ion Battery
This section identifies the leading regions, countries, or segments driving the growth of the EV sodium-ion battery market. We analyze dominance factors, including investment trends, regulatory support, and infrastructure development. Key drivers are presented using bullet points, while paragraphs offer deeper insights.
- Dominant Region/Country: [Identify the leading region/country and provide detailed reasoning for its dominance.]
- Key Drivers:
- Investment Trends: [Discuss investments in R&D, manufacturing, and infrastructure]. For example, China's investment in the sector reached XX million in 2024.
- Regulatory Support: [Analyze government policies, subsidies, and tax incentives]. For example, subsidies of XX million dollars are projected to be made available.
- Infrastructure Development: [Analyze charging infrastructure and battery recycling infrastructure].
Electric Vehicle Sodium-ion Battery Product Innovations
This section details recent product innovations, applications, and performance metrics for EV sodium-ion batteries. We highlight unique selling propositions, focusing on advancements in energy density, cycle life, and safety features. Technological improvements, such as advancements in material science and cell design, are discussed, along with their impact on battery performance and cost-effectiveness. The section will also evaluate the applicability of these innovations in different EV segments and their implications for market growth and competition.
Propelling Factors for Electric Vehicle Sodium-ion Battery Growth
Several factors contribute to the robust growth of the EV sodium-ion battery market. Technological advancements, such as improved energy density and cycle life, are driving market expansion. Cost advantages over lithium-ion batteries also contribute to their increasing adoption. Supportive government policies and increasing environmental concerns further accelerate growth.
Obstacles in the Electric Vehicle Sodium-ion Battery Market
Despite its potential, the EV sodium-ion battery market faces several challenges. Regulatory hurdles, particularly concerning safety standards and supply chain management, pose significant obstacles. Competition from established lithium-ion battery technologies presents a challenge. Supply chain vulnerabilities and the availability of raw materials could also constrain market growth. For instance, disruptions in raw material sourcing could potentially reduce production by XX% affecting market revenue by XX million.
Future Opportunities in Electric Vehicle Sodium-ion Battery
The EV sodium-ion battery market presents promising opportunities. New market segments, such as energy storage systems for grid applications, will drive significant growth. Technological innovations focused on improving energy density and lowering costs will create new avenues for market penetration. Growing environmental concerns and the push for sustainable transportation will propel market expansion.
Major Players in the Electric Vehicle Sodium-ion Battery Ecosystem
- HiNa Battery Technology
- Natrium Energy (Natrium Energy)
- CATL (CATL)
- Do-Fluoride New Materials
- BYD (BYD)
- Ningbo Ronbay New Energy Technology
- Shan Xi Hua Yang Group New Energy
- Jiangsu Transimage Technology
- Shanghai HANXING Technology
- Faradion
- Tiamat
- Natron Energy
- Altris
Key Developments in Electric Vehicle Sodium-ion Battery Industry
- [List key developments with year/month, emphasizing their impact on market dynamics. For example: "June 2024: CATL announces mass production of its new sodium-ion battery, boosting market competition."]
Strategic Electric Vehicle Sodium-ion Battery Market Forecast
The EV sodium-ion battery market exhibits strong growth potential, driven by technological advancements and supportive government policies. Cost competitiveness compared to lithium-ion batteries and the increasing demand for sustainable energy storage solutions will propel market expansion. The market is poised for significant growth in the forecast period (2025-2033), exceeding $XX million. Continued investment in R&D, along with improvements in battery performance and supply chain efficiency, will further fuel market expansion.
Electric Vehicle Sodium-ion Battery Segmentation
-
1. Application
- 1.1. BEV
- 1.2. PHEV
-
2. Types
- 2.1. Layered Oxide Type
- 2.2. Polyanionic Compound Type
- 2.3. Prussian Blue Analogs Type
Electric Vehicle Sodium-ion Battery Segmentation By Geography
-
1. North America
- 1.1. United States
- 1.2. Canada
- 1.3. Mexico
-
2. South America
- 2.1. Brazil
- 2.2. Argentina
- 2.3. Rest of South America
-
3. Europe
- 3.1. United Kingdom
- 3.2. Germany
- 3.3. France
- 3.4. Italy
- 3.5. Spain
- 3.6. Russia
- 3.7. Benelux
- 3.8. Nordics
- 3.9. Rest of Europe
-
4. Middle East & Africa
- 4.1. Turkey
- 4.2. Israel
- 4.3. GCC
- 4.4. North Africa
- 4.5. South Africa
- 4.6. Rest of Middle East & Africa
-
5. Asia Pacific
- 5.1. China
- 5.2. India
- 5.3. Japan
- 5.4. South Korea
- 5.5. ASEAN
- 5.6. Oceania
- 5.7. Rest of Asia Pacific
Electric Vehicle Sodium-ion Battery REPORT HIGHLIGHTS
| Aspects | Details |
|---|---|
| Study Period | 2019-2033 |
| Base Year | 2024 |
| Estimated Year | 2025 |
| Forecast Period | 2025-2033 |
| Historical Period | 2019-2024 |
| Growth Rate | CAGR of XX% from 2019-2033 |
| Segmentation |
|
Table of Contents
- 1. Introduction
- 1.1. Research Scope
- 1.2. Market Segmentation
- 1.3. Research Methodology
- 1.4. Definitions and Assumptions
- 2. Executive Summary
- 2.1. Introduction
- 3. Market Dynamics
- 3.1. Introduction
- 3.2. Market Drivers
- 3.3. Market Restrains
- 3.4. Market Trends
- 4. Market Factor Analysis
- 4.1. Porters Five Forces
- 4.2. Supply/Value Chain
- 4.3. PESTEL analysis
- 4.4. Market Entropy
- 4.5. Patent/Trademark Analysis
- 5. Global Electric Vehicle Sodium-ion Battery Analysis, Insights and Forecast, 2019-2031
- 5.1. Market Analysis, Insights and Forecast - by Application
- 5.1.1. BEV
- 5.1.2. PHEV
- 5.2. Market Analysis, Insights and Forecast - by Types
- 5.2.1. Layered Oxide Type
- 5.2.2. Polyanionic Compound Type
- 5.2.3. Prussian Blue Analogs Type
- 5.3. Market Analysis, Insights and Forecast - by Region
- 5.3.1. North America
- 5.3.2. South America
- 5.3.3. Europe
- 5.3.4. Middle East & Africa
- 5.3.5. Asia Pacific
- 5.1. Market Analysis, Insights and Forecast - by Application
- 6. North America Electric Vehicle Sodium-ion Battery Analysis, Insights and Forecast, 2019-2031
- 6.1. Market Analysis, Insights and Forecast - by Application
- 6.1.1. BEV
- 6.1.2. PHEV
- 6.2. Market Analysis, Insights and Forecast - by Types
- 6.2.1. Layered Oxide Type
- 6.2.2. Polyanionic Compound Type
- 6.2.3. Prussian Blue Analogs Type
- 6.1. Market Analysis, Insights and Forecast - by Application
- 7. South America Electric Vehicle Sodium-ion Battery Analysis, Insights and Forecast, 2019-2031
- 7.1. Market Analysis, Insights and Forecast - by Application
- 7.1.1. BEV
- 7.1.2. PHEV
- 7.2. Market Analysis, Insights and Forecast - by Types
- 7.2.1. Layered Oxide Type
- 7.2.2. Polyanionic Compound Type
- 7.2.3. Prussian Blue Analogs Type
- 7.1. Market Analysis, Insights and Forecast - by Application
- 8. Europe Electric Vehicle Sodium-ion Battery Analysis, Insights and Forecast, 2019-2031
- 8.1. Market Analysis, Insights and Forecast - by Application
- 8.1.1. BEV
- 8.1.2. PHEV
- 8.2. Market Analysis, Insights and Forecast - by Types
- 8.2.1. Layered Oxide Type
- 8.2.2. Polyanionic Compound Type
- 8.2.3. Prussian Blue Analogs Type
- 8.1. Market Analysis, Insights and Forecast - by Application
- 9. Middle East & Africa Electric Vehicle Sodium-ion Battery Analysis, Insights and Forecast, 2019-2031
- 9.1. Market Analysis, Insights and Forecast - by Application
- 9.1.1. BEV
- 9.1.2. PHEV
- 9.2. Market Analysis, Insights and Forecast - by Types
- 9.2.1. Layered Oxide Type
- 9.2.2. Polyanionic Compound Type
- 9.2.3. Prussian Blue Analogs Type
- 9.1. Market Analysis, Insights and Forecast - by Application
- 10. Asia Pacific Electric Vehicle Sodium-ion Battery Analysis, Insights and Forecast, 2019-2031
- 10.1. Market Analysis, Insights and Forecast - by Application
- 10.1.1. BEV
- 10.1.2. PHEV
- 10.2. Market Analysis, Insights and Forecast - by Types
- 10.2.1. Layered Oxide Type
- 10.2.2. Polyanionic Compound Type
- 10.2.3. Prussian Blue Analogs Type
- 10.1. Market Analysis, Insights and Forecast - by Application
- 11. Competitive Analysis
- 11.1. Global Market Share Analysis 2024
- 11.2. Company Profiles
- 11.2.1 HiNa Battery Technology
- 11.2.1.1. Overview
- 11.2.1.2. Products
- 11.2.1.3. SWOT Analysis
- 11.2.1.4. Recent Developments
- 11.2.1.5. Financials (Based on Availability)
- 11.2.2 Natrium Energy
- 11.2.2.1. Overview
- 11.2.2.2. Products
- 11.2.2.3. SWOT Analysis
- 11.2.2.4. Recent Developments
- 11.2.2.5. Financials (Based on Availability)
- 11.2.3 CATL
- 11.2.3.1. Overview
- 11.2.3.2. Products
- 11.2.3.3. SWOT Analysis
- 11.2.3.4. Recent Developments
- 11.2.3.5. Financials (Based on Availability)
- 11.2.4 Do-Fluoride New Materials
- 11.2.4.1. Overview
- 11.2.4.2. Products
- 11.2.4.3. SWOT Analysis
- 11.2.4.4. Recent Developments
- 11.2.4.5. Financials (Based on Availability)
- 11.2.5 BYD
- 11.2.5.1. Overview
- 11.2.5.2. Products
- 11.2.5.3. SWOT Analysis
- 11.2.5.4. Recent Developments
- 11.2.5.5. Financials (Based on Availability)
- 11.2.6 Ningbo Ronbay New Energy Technology
- 11.2.6.1. Overview
- 11.2.6.2. Products
- 11.2.6.3. SWOT Analysis
- 11.2.6.4. Recent Developments
- 11.2.6.5. Financials (Based on Availability)
- 11.2.7 Shan Xi Hua Yang Group New Energy
- 11.2.7.1. Overview
- 11.2.7.2. Products
- 11.2.7.3. SWOT Analysis
- 11.2.7.4. Recent Developments
- 11.2.7.5. Financials (Based on Availability)
- 11.2.8 Jiangsu Transimage Technology
- 11.2.8.1. Overview
- 11.2.8.2. Products
- 11.2.8.3. SWOT Analysis
- 11.2.8.4. Recent Developments
- 11.2.8.5. Financials (Based on Availability)
- 11.2.9 Shanghai HANXING Technology
- 11.2.9.1. Overview
- 11.2.9.2. Products
- 11.2.9.3. SWOT Analysis
- 11.2.9.4. Recent Developments
- 11.2.9.5. Financials (Based on Availability)
- 11.2.10 Faradion
- 11.2.10.1. Overview
- 11.2.10.2. Products
- 11.2.10.3. SWOT Analysis
- 11.2.10.4. Recent Developments
- 11.2.10.5. Financials (Based on Availability)
- 11.2.11 Tiamat
- 11.2.11.1. Overview
- 11.2.11.2. Products
- 11.2.11.3. SWOT Analysis
- 11.2.11.4. Recent Developments
- 11.2.11.5. Financials (Based on Availability)
- 11.2.12 Natron Energy
- 11.2.12.1. Overview
- 11.2.12.2. Products
- 11.2.12.3. SWOT Analysis
- 11.2.12.4. Recent Developments
- 11.2.12.5. Financials (Based on Availability)
- 11.2.13 Altris
- 11.2.13.1. Overview
- 11.2.13.2. Products
- 11.2.13.3. SWOT Analysis
- 11.2.13.4. Recent Developments
- 11.2.13.5. Financials (Based on Availability)
- 11.2.1 HiNa Battery Technology
List of Figures
- Figure 1: Global Electric Vehicle Sodium-ion Battery Revenue Breakdown (million, %) by Region 2024 & 2032
- Figure 2: Global Electric Vehicle Sodium-ion Battery Volume Breakdown (K, %) by Region 2024 & 2032
- Figure 3: North America Electric Vehicle Sodium-ion Battery Revenue (million), by Application 2024 & 2032
- Figure 4: North America Electric Vehicle Sodium-ion Battery Volume (K), by Application 2024 & 2032
- Figure 5: North America Electric Vehicle Sodium-ion Battery Revenue Share (%), by Application 2024 & 2032
- Figure 6: North America Electric Vehicle Sodium-ion Battery Volume Share (%), by Application 2024 & 2032
- Figure 7: North America Electric Vehicle Sodium-ion Battery Revenue (million), by Types 2024 & 2032
- Figure 8: North America Electric Vehicle Sodium-ion Battery Volume (K), by Types 2024 & 2032
- Figure 9: North America Electric Vehicle Sodium-ion Battery Revenue Share (%), by Types 2024 & 2032
- Figure 10: North America Electric Vehicle Sodium-ion Battery Volume Share (%), by Types 2024 & 2032
- Figure 11: North America Electric Vehicle Sodium-ion Battery Revenue (million), by Country 2024 & 2032
- Figure 12: North America Electric Vehicle Sodium-ion Battery Volume (K), by Country 2024 & 2032
- Figure 13: North America Electric Vehicle Sodium-ion Battery Revenue Share (%), by Country 2024 & 2032
- Figure 14: North America Electric Vehicle Sodium-ion Battery Volume Share (%), by Country 2024 & 2032
- Figure 15: South America Electric Vehicle Sodium-ion Battery Revenue (million), by Application 2024 & 2032
- Figure 16: South America Electric Vehicle Sodium-ion Battery Volume (K), by Application 2024 & 2032
- Figure 17: South America Electric Vehicle Sodium-ion Battery Revenue Share (%), by Application 2024 & 2032
- Figure 18: South America Electric Vehicle Sodium-ion Battery Volume Share (%), by Application 2024 & 2032
- Figure 19: South America Electric Vehicle Sodium-ion Battery Revenue (million), by Types 2024 & 2032
- Figure 20: South America Electric Vehicle Sodium-ion Battery Volume (K), by Types 2024 & 2032
- Figure 21: South America Electric Vehicle Sodium-ion Battery Revenue Share (%), by Types 2024 & 2032
- Figure 22: South America Electric Vehicle Sodium-ion Battery Volume Share (%), by Types 2024 & 2032
- Figure 23: South America Electric Vehicle Sodium-ion Battery Revenue (million), by Country 2024 & 2032
- Figure 24: South America Electric Vehicle Sodium-ion Battery Volume (K), by Country 2024 & 2032
- Figure 25: South America Electric Vehicle Sodium-ion Battery Revenue Share (%), by Country 2024 & 2032
- Figure 26: South America Electric Vehicle Sodium-ion Battery Volume Share (%), by Country 2024 & 2032
- Figure 27: Europe Electric Vehicle Sodium-ion Battery Revenue (million), by Application 2024 & 2032
- Figure 28: Europe Electric Vehicle Sodium-ion Battery Volume (K), by Application 2024 & 2032
- Figure 29: Europe Electric Vehicle Sodium-ion Battery Revenue Share (%), by Application 2024 & 2032
- Figure 30: Europe Electric Vehicle Sodium-ion Battery Volume Share (%), by Application 2024 & 2032
- Figure 31: Europe Electric Vehicle Sodium-ion Battery Revenue (million), by Types 2024 & 2032
- Figure 32: Europe Electric Vehicle Sodium-ion Battery Volume (K), by Types 2024 & 2032
- Figure 33: Europe Electric Vehicle Sodium-ion Battery Revenue Share (%), by Types 2024 & 2032
- Figure 34: Europe Electric Vehicle Sodium-ion Battery Volume Share (%), by Types 2024 & 2032
- Figure 35: Europe Electric Vehicle Sodium-ion Battery Revenue (million), by Country 2024 & 2032
- Figure 36: Europe Electric Vehicle Sodium-ion Battery Volume (K), by Country 2024 & 2032
- Figure 37: Europe Electric Vehicle Sodium-ion Battery Revenue Share (%), by Country 2024 & 2032
- Figure 38: Europe Electric Vehicle Sodium-ion Battery Volume Share (%), by Country 2024 & 2032
- Figure 39: Middle East & Africa Electric Vehicle Sodium-ion Battery Revenue (million), by Application 2024 & 2032
- Figure 40: Middle East & Africa Electric Vehicle Sodium-ion Battery Volume (K), by Application 2024 & 2032
- Figure 41: Middle East & Africa Electric Vehicle Sodium-ion Battery Revenue Share (%), by Application 2024 & 2032
- Figure 42: Middle East & Africa Electric Vehicle Sodium-ion Battery Volume Share (%), by Application 2024 & 2032
- Figure 43: Middle East & Africa Electric Vehicle Sodium-ion Battery Revenue (million), by Types 2024 & 2032
- Figure 44: Middle East & Africa Electric Vehicle Sodium-ion Battery Volume (K), by Types 2024 & 2032
- Figure 45: Middle East & Africa Electric Vehicle Sodium-ion Battery Revenue Share (%), by Types 2024 & 2032
- Figure 46: Middle East & Africa Electric Vehicle Sodium-ion Battery Volume Share (%), by Types 2024 & 2032
- Figure 47: Middle East & Africa Electric Vehicle Sodium-ion Battery Revenue (million), by Country 2024 & 2032
- Figure 48: Middle East & Africa Electric Vehicle Sodium-ion Battery Volume (K), by Country 2024 & 2032
- Figure 49: Middle East & Africa Electric Vehicle Sodium-ion Battery Revenue Share (%), by Country 2024 & 2032
- Figure 50: Middle East & Africa Electric Vehicle Sodium-ion Battery Volume Share (%), by Country 2024 & 2032
- Figure 51: Asia Pacific Electric Vehicle Sodium-ion Battery Revenue (million), by Application 2024 & 2032
- Figure 52: Asia Pacific Electric Vehicle Sodium-ion Battery Volume (K), by Application 2024 & 2032
- Figure 53: Asia Pacific Electric Vehicle Sodium-ion Battery Revenue Share (%), by Application 2024 & 2032
- Figure 54: Asia Pacific Electric Vehicle Sodium-ion Battery Volume Share (%), by Application 2024 & 2032
- Figure 55: Asia Pacific Electric Vehicle Sodium-ion Battery Revenue (million), by Types 2024 & 2032
- Figure 56: Asia Pacific Electric Vehicle Sodium-ion Battery Volume (K), by Types 2024 & 2032
- Figure 57: Asia Pacific Electric Vehicle Sodium-ion Battery Revenue Share (%), by Types 2024 & 2032
- Figure 58: Asia Pacific Electric Vehicle Sodium-ion Battery Volume Share (%), by Types 2024 & 2032
- Figure 59: Asia Pacific Electric Vehicle Sodium-ion Battery Revenue (million), by Country 2024 & 2032
- Figure 60: Asia Pacific Electric Vehicle Sodium-ion Battery Volume (K), by Country 2024 & 2032
- Figure 61: Asia Pacific Electric Vehicle Sodium-ion Battery Revenue Share (%), by Country 2024 & 2032
- Figure 62: Asia Pacific Electric Vehicle Sodium-ion Battery Volume Share (%), by Country 2024 & 2032
List of Tables
- Table 1: Global Electric Vehicle Sodium-ion Battery Revenue million Forecast, by Region 2019 & 2032
- Table 2: Global Electric Vehicle Sodium-ion Battery Volume K Forecast, by Region 2019 & 2032
- Table 3: Global Electric Vehicle Sodium-ion Battery Revenue million Forecast, by Application 2019 & 2032
- Table 4: Global Electric Vehicle Sodium-ion Battery Volume K Forecast, by Application 2019 & 2032
- Table 5: Global Electric Vehicle Sodium-ion Battery Revenue million Forecast, by Types 2019 & 2032
- Table 6: Global Electric Vehicle Sodium-ion Battery Volume K Forecast, by Types 2019 & 2032
- Table 7: Global Electric Vehicle Sodium-ion Battery Revenue million Forecast, by Region 2019 & 2032
- Table 8: Global Electric Vehicle Sodium-ion Battery Volume K Forecast, by Region 2019 & 2032
- Table 9: Global Electric Vehicle Sodium-ion Battery Revenue million Forecast, by Application 2019 & 2032
- Table 10: Global Electric Vehicle Sodium-ion Battery Volume K Forecast, by Application 2019 & 2032
- Table 11: Global Electric Vehicle Sodium-ion Battery Revenue million Forecast, by Types 2019 & 2032
- Table 12: Global Electric Vehicle Sodium-ion Battery Volume K Forecast, by Types 2019 & 2032
- Table 13: Global Electric Vehicle Sodium-ion Battery Revenue million Forecast, by Country 2019 & 2032
- Table 14: Global Electric Vehicle Sodium-ion Battery Volume K Forecast, by Country 2019 & 2032
- Table 15: United States Electric Vehicle Sodium-ion Battery Revenue (million) Forecast, by Application 2019 & 2032
- Table 16: United States Electric Vehicle Sodium-ion Battery Volume (K) Forecast, by Application 2019 & 2032
- Table 17: Canada Electric Vehicle Sodium-ion Battery Revenue (million) Forecast, by Application 2019 & 2032
- Table 18: Canada Electric Vehicle Sodium-ion Battery Volume (K) Forecast, by Application 2019 & 2032
- Table 19: Mexico Electric Vehicle Sodium-ion Battery Revenue (million) Forecast, by Application 2019 & 2032
- Table 20: Mexico Electric Vehicle Sodium-ion Battery Volume (K) Forecast, by Application 2019 & 2032
- Table 21: Global Electric Vehicle Sodium-ion Battery Revenue million Forecast, by Application 2019 & 2032
- Table 22: Global Electric Vehicle Sodium-ion Battery Volume K Forecast, by Application 2019 & 2032
- Table 23: Global Electric Vehicle Sodium-ion Battery Revenue million Forecast, by Types 2019 & 2032
- Table 24: Global Electric Vehicle Sodium-ion Battery Volume K Forecast, by Types 2019 & 2032
- Table 25: Global Electric Vehicle Sodium-ion Battery Revenue million Forecast, by Country 2019 & 2032
- Table 26: Global Electric Vehicle Sodium-ion Battery Volume K Forecast, by Country 2019 & 2032
- Table 27: Brazil Electric Vehicle Sodium-ion Battery Revenue (million) Forecast, by Application 2019 & 2032
- Table 28: Brazil Electric Vehicle Sodium-ion Battery Volume (K) Forecast, by Application 2019 & 2032
- Table 29: Argentina Electric Vehicle Sodium-ion Battery Revenue (million) Forecast, by Application 2019 & 2032
- Table 30: Argentina Electric Vehicle Sodium-ion Battery Volume (K) Forecast, by Application 2019 & 2032
- Table 31: Rest of South America Electric Vehicle Sodium-ion Battery Revenue (million) Forecast, by Application 2019 & 2032
- Table 32: Rest of South America Electric Vehicle Sodium-ion Battery Volume (K) Forecast, by Application 2019 & 2032
- Table 33: Global Electric Vehicle Sodium-ion Battery Revenue million Forecast, by Application 2019 & 2032
- Table 34: Global Electric Vehicle Sodium-ion Battery Volume K Forecast, by Application 2019 & 2032
- Table 35: Global Electric Vehicle Sodium-ion Battery Revenue million Forecast, by Types 2019 & 2032
- Table 36: Global Electric Vehicle Sodium-ion Battery Volume K Forecast, by Types 2019 & 2032
- Table 37: Global Electric Vehicle Sodium-ion Battery Revenue million Forecast, by Country 2019 & 2032
- Table 38: Global Electric Vehicle Sodium-ion Battery Volume K Forecast, by Country 2019 & 2032
- Table 39: United Kingdom Electric Vehicle Sodium-ion Battery Revenue (million) Forecast, by Application 2019 & 2032
- Table 40: United Kingdom Electric Vehicle Sodium-ion Battery Volume (K) Forecast, by Application 2019 & 2032
- Table 41: Germany Electric Vehicle Sodium-ion Battery Revenue (million) Forecast, by Application 2019 & 2032
- Table 42: Germany Electric Vehicle Sodium-ion Battery Volume (K) Forecast, by Application 2019 & 2032
- Table 43: France Electric Vehicle Sodium-ion Battery Revenue (million) Forecast, by Application 2019 & 2032
- Table 44: France Electric Vehicle Sodium-ion Battery Volume (K) Forecast, by Application 2019 & 2032
- Table 45: Italy Electric Vehicle Sodium-ion Battery Revenue (million) Forecast, by Application 2019 & 2032
- Table 46: Italy Electric Vehicle Sodium-ion Battery Volume (K) Forecast, by Application 2019 & 2032
- Table 47: Spain Electric Vehicle Sodium-ion Battery Revenue (million) Forecast, by Application 2019 & 2032
- Table 48: Spain Electric Vehicle Sodium-ion Battery Volume (K) Forecast, by Application 2019 & 2032
- Table 49: Russia Electric Vehicle Sodium-ion Battery Revenue (million) Forecast, by Application 2019 & 2032
- Table 50: Russia Electric Vehicle Sodium-ion Battery Volume (K) Forecast, by Application 2019 & 2032
- Table 51: Benelux Electric Vehicle Sodium-ion Battery Revenue (million) Forecast, by Application 2019 & 2032
- Table 52: Benelux Electric Vehicle Sodium-ion Battery Volume (K) Forecast, by Application 2019 & 2032
- Table 53: Nordics Electric Vehicle Sodium-ion Battery Revenue (million) Forecast, by Application 2019 & 2032
- Table 54: Nordics Electric Vehicle Sodium-ion Battery Volume (K) Forecast, by Application 2019 & 2032
- Table 55: Rest of Europe Electric Vehicle Sodium-ion Battery Revenue (million) Forecast, by Application 2019 & 2032
- Table 56: Rest of Europe Electric Vehicle Sodium-ion Battery Volume (K) Forecast, by Application 2019 & 2032
- Table 57: Global Electric Vehicle Sodium-ion Battery Revenue million Forecast, by Application 2019 & 2032
- Table 58: Global Electric Vehicle Sodium-ion Battery Volume K Forecast, by Application 2019 & 2032
- Table 59: Global Electric Vehicle Sodium-ion Battery Revenue million Forecast, by Types 2019 & 2032
- Table 60: Global Electric Vehicle Sodium-ion Battery Volume K Forecast, by Types 2019 & 2032
- Table 61: Global Electric Vehicle Sodium-ion Battery Revenue million Forecast, by Country 2019 & 2032
- Table 62: Global Electric Vehicle Sodium-ion Battery Volume K Forecast, by Country 2019 & 2032
- Table 63: Turkey Electric Vehicle Sodium-ion Battery Revenue (million) Forecast, by Application 2019 & 2032
- Table 64: Turkey Electric Vehicle Sodium-ion Battery Volume (K) Forecast, by Application 2019 & 2032
- Table 65: Israel Electric Vehicle Sodium-ion Battery Revenue (million) Forecast, by Application 2019 & 2032
- Table 66: Israel Electric Vehicle Sodium-ion Battery Volume (K) Forecast, by Application 2019 & 2032
- Table 67: GCC Electric Vehicle Sodium-ion Battery Revenue (million) Forecast, by Application 2019 & 2032
- Table 68: GCC Electric Vehicle Sodium-ion Battery Volume (K) Forecast, by Application 2019 & 2032
- Table 69: North Africa Electric Vehicle Sodium-ion Battery Revenue (million) Forecast, by Application 2019 & 2032
- Table 70: North Africa Electric Vehicle Sodium-ion Battery Volume (K) Forecast, by Application 2019 & 2032
- Table 71: South Africa Electric Vehicle Sodium-ion Battery Revenue (million) Forecast, by Application 2019 & 2032
- Table 72: South Africa Electric Vehicle Sodium-ion Battery Volume (K) Forecast, by Application 2019 & 2032
- Table 73: Rest of Middle East & Africa Electric Vehicle Sodium-ion Battery Revenue (million) Forecast, by Application 2019 & 2032
- Table 74: Rest of Middle East & Africa Electric Vehicle Sodium-ion Battery Volume (K) Forecast, by Application 2019 & 2032
- Table 75: Global Electric Vehicle Sodium-ion Battery Revenue million Forecast, by Application 2019 & 2032
- Table 76: Global Electric Vehicle Sodium-ion Battery Volume K Forecast, by Application 2019 & 2032
- Table 77: Global Electric Vehicle Sodium-ion Battery Revenue million Forecast, by Types 2019 & 2032
- Table 78: Global Electric Vehicle Sodium-ion Battery Volume K Forecast, by Types 2019 & 2032
- Table 79: Global Electric Vehicle Sodium-ion Battery Revenue million Forecast, by Country 2019 & 2032
- Table 80: Global Electric Vehicle Sodium-ion Battery Volume K Forecast, by Country 2019 & 2032
- Table 81: China Electric Vehicle Sodium-ion Battery Revenue (million) Forecast, by Application 2019 & 2032
- Table 82: China Electric Vehicle Sodium-ion Battery Volume (K) Forecast, by Application 2019 & 2032
- Table 83: India Electric Vehicle Sodium-ion Battery Revenue (million) Forecast, by Application 2019 & 2032
- Table 84: India Electric Vehicle Sodium-ion Battery Volume (K) Forecast, by Application 2019 & 2032
- Table 85: Japan Electric Vehicle Sodium-ion Battery Revenue (million) Forecast, by Application 2019 & 2032
- Table 86: Japan Electric Vehicle Sodium-ion Battery Volume (K) Forecast, by Application 2019 & 2032
- Table 87: South Korea Electric Vehicle Sodium-ion Battery Revenue (million) Forecast, by Application 2019 & 2032
- Table 88: South Korea Electric Vehicle Sodium-ion Battery Volume (K) Forecast, by Application 2019 & 2032
- Table 89: ASEAN Electric Vehicle Sodium-ion Battery Revenue (million) Forecast, by Application 2019 & 2032
- Table 90: ASEAN Electric Vehicle Sodium-ion Battery Volume (K) Forecast, by Application 2019 & 2032
- Table 91: Oceania Electric Vehicle Sodium-ion Battery Revenue (million) Forecast, by Application 2019 & 2032
- Table 92: Oceania Electric Vehicle Sodium-ion Battery Volume (K) Forecast, by Application 2019 & 2032
- Table 93: Rest of Asia Pacific Electric Vehicle Sodium-ion Battery Revenue (million) Forecast, by Application 2019 & 2032
- Table 94: Rest of Asia Pacific Electric Vehicle Sodium-ion Battery Volume (K) Forecast, by Application 2019 & 2032
Frequently Asked Questions
1. What is the projected Compound Annual Growth Rate (CAGR) of the Electric Vehicle Sodium-ion Battery?
The projected CAGR is approximately XX%.
2. Which companies are prominent players in the Electric Vehicle Sodium-ion Battery?
Key companies in the market include HiNa Battery Technology, Natrium Energy, CATL, Do-Fluoride New Materials, BYD, Ningbo Ronbay New Energy Technology, Shan Xi Hua Yang Group New Energy, Jiangsu Transimage Technology, Shanghai HANXING Technology, Faradion, Tiamat, Natron Energy, Altris.
3. What are the main segments of the Electric Vehicle Sodium-ion Battery?
The market segments include Application, Types.
4. Can you provide details about the market size?
The market size is estimated to be USD XXX million as of 2022.
5. What are some drivers contributing to market growth?
N/A
6. What are the notable trends driving market growth?
N/A
7. Are there any restraints impacting market growth?
N/A
8. Can you provide examples of recent developments in the market?
N/A
9. What pricing options are available for accessing the report?
Pricing options include single-user, multi-user, and enterprise licenses priced at USD 3950.00, USD 5925.00, and USD 7900.00 respectively.
10. Is the market size provided in terms of value or volume?
The market size is provided in terms of value, measured in million and volume, measured in K.
11. Are there any specific market keywords associated with the report?
Yes, the market keyword associated with the report is "Electric Vehicle Sodium-ion Battery," which aids in identifying and referencing the specific market segment covered.
12. How do I determine which pricing option suits my needs best?
The pricing options vary based on user requirements and access needs. Individual users may opt for single-user licenses, while businesses requiring broader access may choose multi-user or enterprise licenses for cost-effective access to the report.
13. Are there any additional resources or data provided in the Electric Vehicle Sodium-ion Battery report?
While the report offers comprehensive insights, it's advisable to review the specific contents or supplementary materials provided to ascertain if additional resources or data are available.
14. How can I stay updated on further developments or reports in the Electric Vehicle Sodium-ion Battery?
To stay informed about further developments, trends, and reports in the Electric Vehicle Sodium-ion Battery, consider subscribing to industry newsletters, following relevant companies and organizations, or regularly checking reputable industry news sources and publications.
Methodology
Step 1 - Identification of Relevant Samples Size from Population Database


Step 2 - Approaches for Defining Global Market Size (Value, Volume* & Price*)

Note*: In applicable scenarios
Step 3 - Data Sources
Primary Research
- Web Analytics
- Survey Reports
- Research Institute
- Latest Research Reports
- Opinion Leaders
Secondary Research
- Annual Reports
- White Paper
- Latest Press Release
- Industry Association
- Paid Database
- Investor Presentations

Step 4 - Data Triangulation
Involves using different sources of information in order to increase the validity of a study
These sources are likely to be stakeholders in a program - participants, other researchers, program staff, other community members, and so on.
Then we put all data in single framework & apply various statistical tools to find out the dynamic on the market.
During the analysis stage, feedback from the stakeholder groups would be compared to determine areas of agreement as well as areas of divergence
