

Key Insights
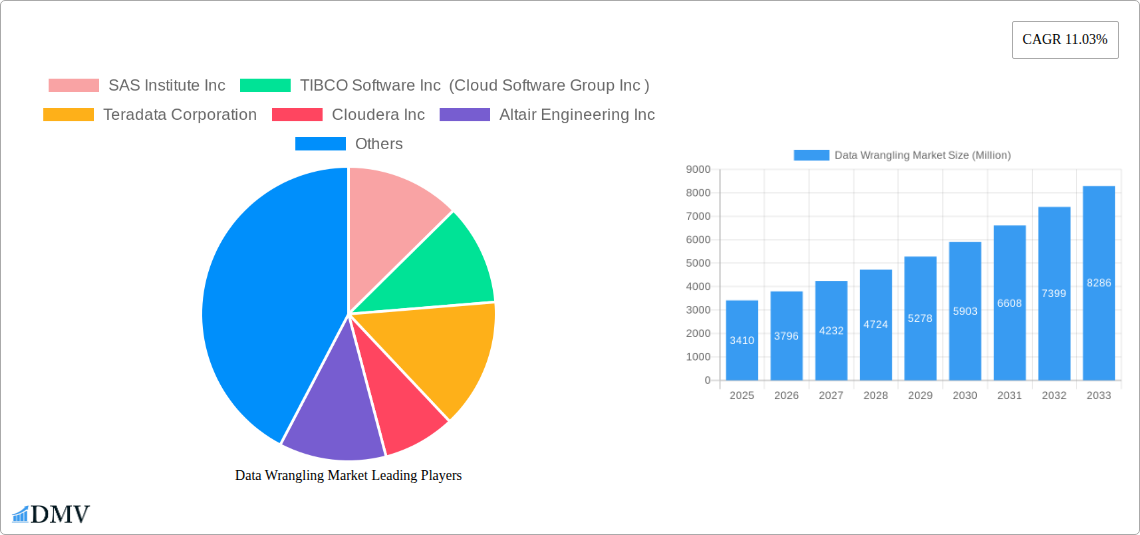
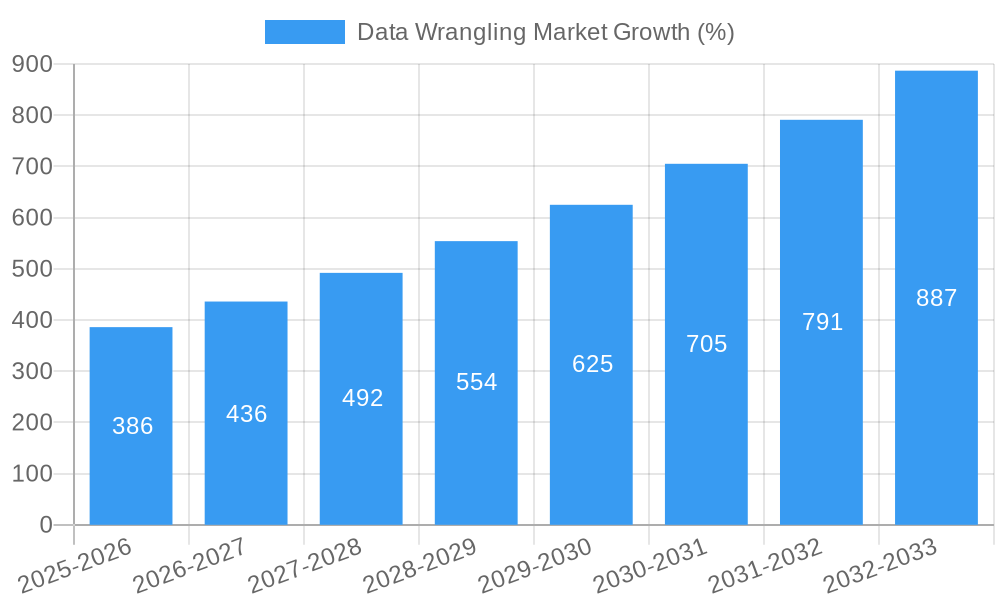
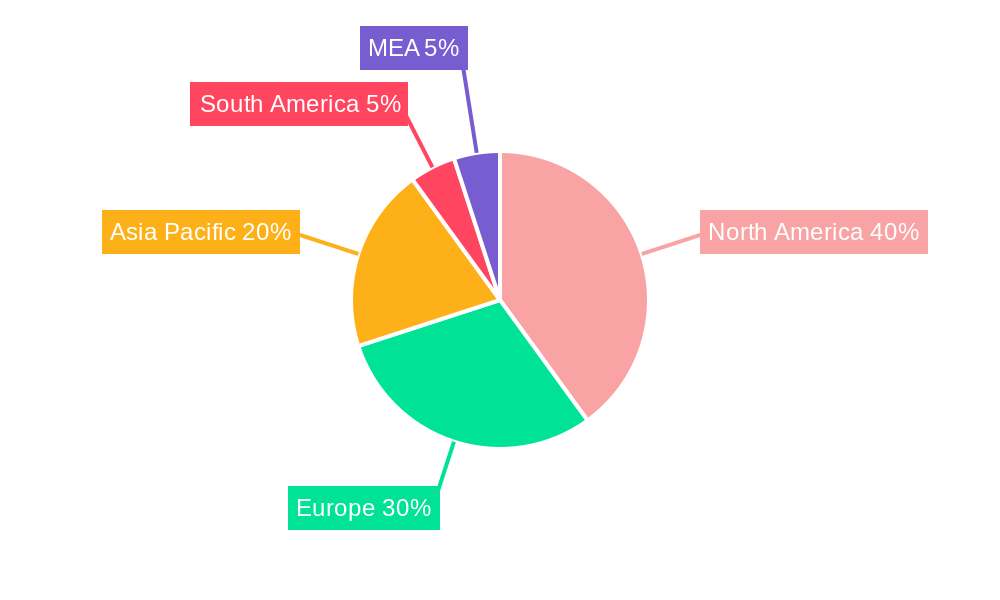
The data wrangling market, valued at $3.41 billion in 2025, is experiencing robust growth, projected to expand at a Compound Annual Growth Rate (CAGR) of 11.03% from 2025 to 2033. This growth is fueled by the exponential increase in data volume and velocity across various industries, coupled with a rising need for accurate, clean data for effective business intelligence and decision-making. Key drivers include the increasing adoption of cloud-based data warehousing and analytics solutions, the growing demand for advanced data visualization tools, and the expanding use of big data analytics across diverse sectors like healthcare, BFSI (Banking, Financial Services, and Insurance), and retail. The market is segmented by component (tools and services), deployment (cloud-based and on-premises), enterprise type (small and medium-sized enterprises (SMEs) and large enterprises), and end-user industry (IT and telecommunications, retail, government, BFSI, healthcare, and others). The cloud-based segment is anticipated to dominate due to its scalability, cost-effectiveness, and accessibility. Large enterprises are expected to contribute significantly to market revenue, given their greater data management needs and resources. North America currently holds a substantial market share, but the Asia-Pacific region is poised for significant growth driven by increasing digitalization and technological advancements. Competitive pressures are evident, with several established players and emerging startups vying for market share. Strategic partnerships, mergers and acquisitions, and the development of innovative data wrangling technologies will likely shape the competitive landscape in the coming years.
The competitive landscape is marked by the presence of both established players like SAS Institute Inc., TIBCO Software Inc., and Teradata Corporation, and emerging innovative companies like DataRobot Inc. and Alteryx Inc. The market's future growth trajectory is intricately linked to advancements in artificial intelligence (AI) and machine learning (ML), which are increasingly integrated into data wrangling tools to automate tasks and enhance efficiency. Furthermore, the growing focus on data governance and regulatory compliance will drive demand for robust and secure data wrangling solutions. The ongoing evolution of data formats and structures presents both challenges and opportunities, necessitating continuous innovation in data wrangling technologies to ensure compatibility and seamless integration with diverse data sources. The market's continued expansion is therefore highly probable, driven by the overarching trend of data-driven decision making across all sectors.
Data Wrangling Market: A Comprehensive Report (2019-2033)
This insightful report provides a detailed analysis of the Data Wrangling Market, projecting a robust growth trajectory from 2025 to 2033. It delves into market segmentation, competitive landscape, technological advancements, and future opportunities, offering invaluable insights for stakeholders across the data management ecosystem. The study period spans 2019-2033, with 2025 as the base and estimated year. The forecast period covers 2025-2033, and the historical period is 2019-2024. The market is valued at xx Million in 2025 and is projected to reach xx Million by 2033.
Data Wrangling Market Composition & Trends
This section evaluates the market's competitive intensity, innovative drivers, regulatory environment, substitute solutions, user profiles, and merger & acquisition (M&A) activity. The market is characterized by a moderately concentrated landscape, with key players such as SAS Institute Inc, TIBCO Software Inc, and Teradata Corporation holding significant market share. However, the emergence of innovative cloud-based solutions and agile data wrangling tools is fostering increased competition.
- Market Share Distribution: The top 5 players collectively hold approximately xx% of the market share in 2025, with SAS Institute Inc leading at xx%.
- M&A Activity: Significant M&A activity has been observed, with deal values exceeding xx Million in the past five years. Recent acquisitions reflect a trend towards consolidation and expansion of capabilities within the data management space. This consolidation has led to an increased focus on cloud-based solutions.
- Innovation Catalysts: The increasing volume and complexity of data, coupled with the demand for real-time insights, are major drivers of innovation in data wrangling techniques and technologies.
- Regulatory Landscape: Data privacy regulations, such as GDPR and CCPA, are influencing data handling practices and creating a need for robust data wrangling solutions that ensure compliance.
- Substitute Products: While dedicated data wrangling tools are preferred, alternative solutions include general-purpose programming languages and spreadsheet software, although these often lack efficiency and scalability for large datasets.
- End-User Profiles: Key end-user industries include IT and Telecommunication, BFSI, Healthcare, and Retail, with significant adoption driven by the need for data-driven decision making.
Data Wrangling Market Industry Evolution
This section explores the market's growth trajectory, technological advancements, and evolving consumer demands. The Data Wrangling Market has witnessed significant growth over the past few years, driven by the proliferation of big data and the increasing need for data-driven decision-making across various industries. The market is expected to maintain a healthy Compound Annual Growth Rate (CAGR) of xx% during the forecast period (2025-2033). Technological advancements, such as the rise of artificial intelligence (AI) and machine learning (ML) in data wrangling, are further accelerating market growth. Consumers are increasingly demanding efficient, scalable, and user-friendly solutions that can handle diverse data types and integrate seamlessly with existing data management ecosystems. The shift towards cloud-based deployments has also played a significant role, offering flexibility, scalability, and cost-effectiveness. Data quality and governance initiatives are increasing the need for robust data wrangling. Specific adoption metrics show a xx% increase in cloud-based solutions from 2024 to 2025.
Leading Regions, Countries, or Segments in Data Wrangling Market
This section analyzes the leading regions, countries, and market segments (By Component, Deployment, Enterprise Type, and End-user Industry). North America currently dominates the market, followed by Europe and Asia Pacific. The dominance of North America is driven by the presence of major technology companies, high adoption of advanced technologies, and robust regulatory frameworks related to data privacy and compliance.
Key Drivers:
- North America: High technology adoption, substantial investments in R&D, and strong presence of major players.
- Europe: Stringent data privacy regulations (GDPR) driving the demand for robust data wrangling solutions.
- Asia Pacific: Rapid digitalization, increasing data volume from emerging economies, and government initiatives promoting digital transformation.
Segment Dominance:
- By Component: Tools segment holds a significant market share due to the widespread adoption of various data wrangling tools.
- By Deployment: Cloud-based deployment is gaining traction due to its scalability, flexibility, and cost-effectiveness.
- By Enterprise Type: Large enterprises dominate the market owing to their higher budgets and complex data requirements.
- By End-user Industry: The BFSI and Healthcare sectors are major consumers of data wrangling solutions, driven by regulatory compliance and the need for effective data analysis.
Data Wrangling Market Product Innovations
Recent innovations include the incorporation of AI and ML for automated data cleaning and transformation, improved user interfaces for easier data manipulation, and the integration of data wrangling tools with other data management platforms. These advancements enhance efficiency, reduce manual effort, and improve data quality. Unique selling propositions include streamlined workflows, advanced data profiling capabilities, and support for diverse data formats. The market also sees increasing focus on solutions catering to specific industry needs.
Propelling Factors for Data Wrangling Market Growth
Several factors are driving the growth of the data wrangling market. Firstly, the exponential growth of data volume and variety necessitates efficient data preparation techniques. Secondly, the increasing focus on data-driven decision-making in various industries fuels demand for tools that ensure data quality and consistency. Thirdly, advancements in cloud computing and big data technologies are paving the way for innovative data wrangling solutions. Finally, government regulations promoting data privacy are indirectly increasing the need for data wrangling to ensure compliance.
Obstacles in the Data Wrangling Market Market
Challenges hindering market growth include the complexity of data wrangling processes, the high cost of implementation and maintenance, and the need for skilled professionals proficient in data wrangling techniques. The lack of standardization in data formats and the integration challenges with diverse data sources also present obstacles. Supply chain disruptions related to software and hardware can also affect the market's overall growth.
Future Opportunities in Data Wrangling Market
Future opportunities lie in the development of more sophisticated AI-powered data wrangling solutions, enhanced data visualization capabilities, and the integration of data wrangling with other data analytics platforms. The expansion into new industries like IoT and Edge computing offers significant growth potential. Focus on specific industry verticals with tailored solutions presents another lucrative opportunity.
Major Players in the Data Wrangling Market Ecosystem
- SAS Institute Inc
- TIBCO Software Inc (Cloud Software Group Inc)
- Teradata Corporation
- Cloudera Inc
- Altair Engineering Inc
- Cambridge Semantics Inc
- Alteryx Inc
- Oracle Corporation
- DataRobot Inc
- Datameer Inc
Key Developments in Data Wrangling Market Industry
- May 2023: Adroit DI launched SDF Pro, a cloud-based application for efficient data wrangling of large datasets.
- May 2023: Qlik acquired Talend, significantly expanding its data wrangling capabilities and market reach.
Strategic Data Wrangling Market Market Forecast
The Data Wrangling Market is poised for continued growth, driven by the increasing demand for data-driven decision-making, technological advancements in AI and cloud computing, and the growing focus on data quality and governance. The market is expected to witness significant expansion in emerging economies and new industry verticals. Further consolidation through M&A activity is anticipated, leading to a more competitive yet concentrated landscape.
Data Wrangling Market Segmentation
-
1. Component
- 1.1. Tools
- 1.2. Service
-
2. Deployment
- 2.1. Cloud-Based
- 2.2. On-premises
-
3. Enterprise Type
- 3.1. Small and Medium Sized
- 3.2. Large
-
4. End-user Industry
- 4.1. IT and Telecommunication
- 4.2. Retail
- 4.3. Government
- 4.4. BFSI
- 4.5. Healthcare
- 4.6. Other End-user Industries
Data Wrangling Market Segmentation By Geography
-
1. North America
- 1.1. United States
- 1.2. Canada
-
2. Europe
- 2.1. United Kingdom
- 2.2. Germany
- 2.3. France
- 2.4. Rest of Europe
-
3. Asia Pacific
- 3.1. China
- 3.2. Japan
- 3.3. Singapore
- 3.4. Rest of Asia Pacific
-
4. Latin America
- 4.1. Mexico
- 4.2. Brazil
- 4.3. Rest of Latin America
-
5. Middle East and Africa
- 5.1. United Arab Emirates
- 5.2. Saudi Arabia
- 5.3. Rest of Middle East
Data Wrangling Market REPORT HIGHLIGHTS
| Aspects | Details |
|---|---|
| Study Period | 2019-2033 |
| Base Year | 2024 |
| Estimated Year | 2025 |
| Forecast Period | 2025-2033 |
| Historical Period | 2019-2024 |
| Growth Rate | CAGR of 11.03% from 2019-2033 |
| Segmentation |
|
Table of Contents
- 1. Introduction
- 1.1. Research Scope
- 1.2. Market Segmentation
- 1.3. Research Methodology
- 1.4. Definitions and Assumptions
- 2. Executive Summary
- 2.1. Introduction
- 3. Market Dynamics
- 3.1. Introduction
- 3.2. Market Drivers
- 3.2.1. Growing Volumes of Data; Advancement in AI And Big Data Technologies; Growing Concern about Data Veracity
- 3.3. Market Restrains
- 3.3.1. Lack Of Awareness Of Data Wrangling Tools Among Enterprises; Explicit Data Access Permission
- 3.4. Market Trends
- 3.4.1. Large Enterprises are Analyzed to Hold Significant Market Share
- 4. Market Factor Analysis
- 4.1. Porters Five Forces
- 4.2. Supply/Value Chain
- 4.3. PESTEL analysis
- 4.4. Market Entropy
- 4.5. Patent/Trademark Analysis
- 5. Global Data Wrangling Market Analysis, Insights and Forecast, 2019-2031
- 5.1. Market Analysis, Insights and Forecast - by Component
- 5.1.1. Tools
- 5.1.2. Service
- 5.2. Market Analysis, Insights and Forecast - by Deployment
- 5.2.1. Cloud-Based
- 5.2.2. On-premises
- 5.3. Market Analysis, Insights and Forecast - by Enterprise Type
- 5.3.1. Small and Medium Sized
- 5.3.2. Large
- 5.4. Market Analysis, Insights and Forecast - by End-user Industry
- 5.4.1. IT and Telecommunication
- 5.4.2. Retail
- 5.4.3. Government
- 5.4.4. BFSI
- 5.4.5. Healthcare
- 5.4.6. Other End-user Industries
- 5.5. Market Analysis, Insights and Forecast - by Region
- 5.5.1. North America
- 5.5.2. Europe
- 5.5.3. Asia Pacific
- 5.5.4. Latin America
- 5.5.5. Middle East and Africa
- 5.1. Market Analysis, Insights and Forecast - by Component
- 6. North America Data Wrangling Market Analysis, Insights and Forecast, 2019-2031
- 6.1. Market Analysis, Insights and Forecast - by Component
- 6.1.1. Tools
- 6.1.2. Service
- 6.2. Market Analysis, Insights and Forecast - by Deployment
- 6.2.1. Cloud-Based
- 6.2.2. On-premises
- 6.3. Market Analysis, Insights and Forecast - by Enterprise Type
- 6.3.1. Small and Medium Sized
- 6.3.2. Large
- 6.4. Market Analysis, Insights and Forecast - by End-user Industry
- 6.4.1. IT and Telecommunication
- 6.4.2. Retail
- 6.4.3. Government
- 6.4.4. BFSI
- 6.4.5. Healthcare
- 6.4.6. Other End-user Industries
- 6.1. Market Analysis, Insights and Forecast - by Component
- 7. Europe Data Wrangling Market Analysis, Insights and Forecast, 2019-2031
- 7.1. Market Analysis, Insights and Forecast - by Component
- 7.1.1. Tools
- 7.1.2. Service
- 7.2. Market Analysis, Insights and Forecast - by Deployment
- 7.2.1. Cloud-Based
- 7.2.2. On-premises
- 7.3. Market Analysis, Insights and Forecast - by Enterprise Type
- 7.3.1. Small and Medium Sized
- 7.3.2. Large
- 7.4. Market Analysis, Insights and Forecast - by End-user Industry
- 7.4.1. IT and Telecommunication
- 7.4.2. Retail
- 7.4.3. Government
- 7.4.4. BFSI
- 7.4.5. Healthcare
- 7.4.6. Other End-user Industries
- 7.1. Market Analysis, Insights and Forecast - by Component
- 8. Asia Pacific Data Wrangling Market Analysis, Insights and Forecast, 2019-2031
- 8.1. Market Analysis, Insights and Forecast - by Component
- 8.1.1. Tools
- 8.1.2. Service
- 8.2. Market Analysis, Insights and Forecast - by Deployment
- 8.2.1. Cloud-Based
- 8.2.2. On-premises
- 8.3. Market Analysis, Insights and Forecast - by Enterprise Type
- 8.3.1. Small and Medium Sized
- 8.3.2. Large
- 8.4. Market Analysis, Insights and Forecast - by End-user Industry
- 8.4.1. IT and Telecommunication
- 8.4.2. Retail
- 8.4.3. Government
- 8.4.4. BFSI
- 8.4.5. Healthcare
- 8.4.6. Other End-user Industries
- 8.1. Market Analysis, Insights and Forecast - by Component
- 9. Latin America Data Wrangling Market Analysis, Insights and Forecast, 2019-2031
- 9.1. Market Analysis, Insights and Forecast - by Component
- 9.1.1. Tools
- 9.1.2. Service
- 9.2. Market Analysis, Insights and Forecast - by Deployment
- 9.2.1. Cloud-Based
- 9.2.2. On-premises
- 9.3. Market Analysis, Insights and Forecast - by Enterprise Type
- 9.3.1. Small and Medium Sized
- 9.3.2. Large
- 9.4. Market Analysis, Insights and Forecast - by End-user Industry
- 9.4.1. IT and Telecommunication
- 9.4.2. Retail
- 9.4.3. Government
- 9.4.4. BFSI
- 9.4.5. Healthcare
- 9.4.6. Other End-user Industries
- 9.1. Market Analysis, Insights and Forecast - by Component
- 10. Middle East and Africa Data Wrangling Market Analysis, Insights and Forecast, 2019-2031
- 10.1. Market Analysis, Insights and Forecast - by Component
- 10.1.1. Tools
- 10.1.2. Service
- 10.2. Market Analysis, Insights and Forecast - by Deployment
- 10.2.1. Cloud-Based
- 10.2.2. On-premises
- 10.3. Market Analysis, Insights and Forecast - by Enterprise Type
- 10.3.1. Small and Medium Sized
- 10.3.2. Large
- 10.4. Market Analysis, Insights and Forecast - by End-user Industry
- 10.4.1. IT and Telecommunication
- 10.4.2. Retail
- 10.4.3. Government
- 10.4.4. BFSI
- 10.4.5. Healthcare
- 10.4.6. Other End-user Industries
- 10.1. Market Analysis, Insights and Forecast - by Component
- 11. North America Data Wrangling Market Analysis, Insights and Forecast, 2019-2031
- 11.1. Market Analysis, Insights and Forecast - By Country/Sub-region
- 11.1.1 United States
- 11.1.2 Canada
- 11.1.3 Mexico
- 12. Europe Data Wrangling Market Analysis, Insights and Forecast, 2019-2031
- 12.1. Market Analysis, Insights and Forecast - By Country/Sub-region
- 12.1.1 Germany
- 12.1.2 United Kingdom
- 12.1.3 France
- 12.1.4 Spain
- 12.1.5 Italy
- 12.1.6 Spain
- 12.1.7 Belgium
- 12.1.8 Netherland
- 12.1.9 Nordics
- 12.1.10 Rest of Europe
- 13. Asia Pacific Data Wrangling Market Analysis, Insights and Forecast, 2019-2031
- 13.1. Market Analysis, Insights and Forecast - By Country/Sub-region
- 13.1.1 China
- 13.1.2 Japan
- 13.1.3 India
- 13.1.4 South Korea
- 13.1.5 Southeast Asia
- 13.1.6 Australia
- 13.1.7 Indonesia
- 13.1.8 Phillipes
- 13.1.9 Singapore
- 13.1.10 Thailandc
- 13.1.11 Rest of Asia Pacific
- 14. South America Data Wrangling Market Analysis, Insights and Forecast, 2019-2031
- 14.1. Market Analysis, Insights and Forecast - By Country/Sub-region
- 14.1.1 Brazil
- 14.1.2 Argentina
- 14.1.3 Peru
- 14.1.4 Chile
- 14.1.5 Colombia
- 14.1.6 Ecuador
- 14.1.7 Venezuela
- 14.1.8 Rest of South America
- 15. North America Data Wrangling Market Analysis, Insights and Forecast, 2019-2031
- 15.1. Market Analysis, Insights and Forecast - By Country/Sub-region
- 15.1.1 United States
- 15.1.2 Canada
- 15.1.3 Mexico
- 16. MEA Data Wrangling Market Analysis, Insights and Forecast, 2019-2031
- 16.1. Market Analysis, Insights and Forecast - By Country/Sub-region
- 16.1.1 United Arab Emirates
- 16.1.2 Saudi Arabia
- 16.1.3 South Africa
- 16.1.4 Rest of Middle East and Africa
- 17. Competitive Analysis
- 17.1. Global Market Share Analysis 2024
- 17.2. Company Profiles
- 17.2.1 SAS Institute Inc
- 17.2.1.1. Overview
- 17.2.1.2. Products
- 17.2.1.3. SWOT Analysis
- 17.2.1.4. Recent Developments
- 17.2.1.5. Financials (Based on Availability)
- 17.2.2 TIBCO Software Inc (Cloud Software Group Inc )
- 17.2.2.1. Overview
- 17.2.2.2. Products
- 17.2.2.3. SWOT Analysis
- 17.2.2.4. Recent Developments
- 17.2.2.5. Financials (Based on Availability)
- 17.2.3 Teradata Corporation
- 17.2.3.1. Overview
- 17.2.3.2. Products
- 17.2.3.3. SWOT Analysis
- 17.2.3.4. Recent Developments
- 17.2.3.5. Financials (Based on Availability)
- 17.2.4 Cloudera Inc
- 17.2.4.1. Overview
- 17.2.4.2. Products
- 17.2.4.3. SWOT Analysis
- 17.2.4.4. Recent Developments
- 17.2.4.5. Financials (Based on Availability)
- 17.2.5 Altair Engineering Inc
- 17.2.5.1. Overview
- 17.2.5.2. Products
- 17.2.5.3. SWOT Analysis
- 17.2.5.4. Recent Developments
- 17.2.5.5. Financials (Based on Availability)
- 17.2.6 Cambridge Semantics Inc
- 17.2.6.1. Overview
- 17.2.6.2. Products
- 17.2.6.3. SWOT Analysis
- 17.2.6.4. Recent Developments
- 17.2.6.5. Financials (Based on Availability)
- 17.2.7 Alteryx Inc
- 17.2.7.1. Overview
- 17.2.7.2. Products
- 17.2.7.3. SWOT Analysis
- 17.2.7.4. Recent Developments
- 17.2.7.5. Financials (Based on Availability)
- 17.2.8 Oracle Corporation
- 17.2.8.1. Overview
- 17.2.8.2. Products
- 17.2.8.3. SWOT Analysis
- 17.2.8.4. Recent Developments
- 17.2.8.5. Financials (Based on Availability)
- 17.2.9 DataRobot Inc
- 17.2.9.1. Overview
- 17.2.9.2. Products
- 17.2.9.3. SWOT Analysis
- 17.2.9.4. Recent Developments
- 17.2.9.5. Financials (Based on Availability)
- 17.2.10 Datameer Inc
- 17.2.10.1. Overview
- 17.2.10.2. Products
- 17.2.10.3. SWOT Analysis
- 17.2.10.4. Recent Developments
- 17.2.10.5. Financials (Based on Availability)
- 17.2.1 SAS Institute Inc
List of Figures
- Figure 1: Global Data Wrangling Market Revenue Breakdown (Million, %) by Region 2024 & 2032
- Figure 2: Global Data Wrangling Market Volume Breakdown (K Unit, %) by Region 2024 & 2032
- Figure 3: North America Data Wrangling Market Revenue (Million), by Country 2024 & 2032
- Figure 4: North America Data Wrangling Market Volume (K Unit), by Country 2024 & 2032
- Figure 5: North America Data Wrangling Market Revenue Share (%), by Country 2024 & 2032
- Figure 6: North America Data Wrangling Market Volume Share (%), by Country 2024 & 2032
- Figure 7: Europe Data Wrangling Market Revenue (Million), by Country 2024 & 2032
- Figure 8: Europe Data Wrangling Market Volume (K Unit), by Country 2024 & 2032
- Figure 9: Europe Data Wrangling Market Revenue Share (%), by Country 2024 & 2032
- Figure 10: Europe Data Wrangling Market Volume Share (%), by Country 2024 & 2032
- Figure 11: Asia Pacific Data Wrangling Market Revenue (Million), by Country 2024 & 2032
- Figure 12: Asia Pacific Data Wrangling Market Volume (K Unit), by Country 2024 & 2032
- Figure 13: Asia Pacific Data Wrangling Market Revenue Share (%), by Country 2024 & 2032
- Figure 14: Asia Pacific Data Wrangling Market Volume Share (%), by Country 2024 & 2032
- Figure 15: South America Data Wrangling Market Revenue (Million), by Country 2024 & 2032
- Figure 16: South America Data Wrangling Market Volume (K Unit), by Country 2024 & 2032
- Figure 17: South America Data Wrangling Market Revenue Share (%), by Country 2024 & 2032
- Figure 18: South America Data Wrangling Market Volume Share (%), by Country 2024 & 2032
- Figure 19: North America Data Wrangling Market Revenue (Million), by Country 2024 & 2032
- Figure 20: North America Data Wrangling Market Volume (K Unit), by Country 2024 & 2032
- Figure 21: North America Data Wrangling Market Revenue Share (%), by Country 2024 & 2032
- Figure 22: North America Data Wrangling Market Volume Share (%), by Country 2024 & 2032
- Figure 23: MEA Data Wrangling Market Revenue (Million), by Country 2024 & 2032
- Figure 24: MEA Data Wrangling Market Volume (K Unit), by Country 2024 & 2032
- Figure 25: MEA Data Wrangling Market Revenue Share (%), by Country 2024 & 2032
- Figure 26: MEA Data Wrangling Market Volume Share (%), by Country 2024 & 2032
- Figure 27: North America Data Wrangling Market Revenue (Million), by Component 2024 & 2032
- Figure 28: North America Data Wrangling Market Volume (K Unit), by Component 2024 & 2032
- Figure 29: North America Data Wrangling Market Revenue Share (%), by Component 2024 & 2032
- Figure 30: North America Data Wrangling Market Volume Share (%), by Component 2024 & 2032
- Figure 31: North America Data Wrangling Market Revenue (Million), by Deployment 2024 & 2032
- Figure 32: North America Data Wrangling Market Volume (K Unit), by Deployment 2024 & 2032
- Figure 33: North America Data Wrangling Market Revenue Share (%), by Deployment 2024 & 2032
- Figure 34: North America Data Wrangling Market Volume Share (%), by Deployment 2024 & 2032
- Figure 35: North America Data Wrangling Market Revenue (Million), by Enterprise Type 2024 & 2032
- Figure 36: North America Data Wrangling Market Volume (K Unit), by Enterprise Type 2024 & 2032
- Figure 37: North America Data Wrangling Market Revenue Share (%), by Enterprise Type 2024 & 2032
- Figure 38: North America Data Wrangling Market Volume Share (%), by Enterprise Type 2024 & 2032
- Figure 39: North America Data Wrangling Market Revenue (Million), by End-user Industry 2024 & 2032
- Figure 40: North America Data Wrangling Market Volume (K Unit), by End-user Industry 2024 & 2032
- Figure 41: North America Data Wrangling Market Revenue Share (%), by End-user Industry 2024 & 2032
- Figure 42: North America Data Wrangling Market Volume Share (%), by End-user Industry 2024 & 2032
- Figure 43: North America Data Wrangling Market Revenue (Million), by Country 2024 & 2032
- Figure 44: North America Data Wrangling Market Volume (K Unit), by Country 2024 & 2032
- Figure 45: North America Data Wrangling Market Revenue Share (%), by Country 2024 & 2032
- Figure 46: North America Data Wrangling Market Volume Share (%), by Country 2024 & 2032
- Figure 47: Europe Data Wrangling Market Revenue (Million), by Component 2024 & 2032
- Figure 48: Europe Data Wrangling Market Volume (K Unit), by Component 2024 & 2032
- Figure 49: Europe Data Wrangling Market Revenue Share (%), by Component 2024 & 2032
- Figure 50: Europe Data Wrangling Market Volume Share (%), by Component 2024 & 2032
- Figure 51: Europe Data Wrangling Market Revenue (Million), by Deployment 2024 & 2032
- Figure 52: Europe Data Wrangling Market Volume (K Unit), by Deployment 2024 & 2032
- Figure 53: Europe Data Wrangling Market Revenue Share (%), by Deployment 2024 & 2032
- Figure 54: Europe Data Wrangling Market Volume Share (%), by Deployment 2024 & 2032
- Figure 55: Europe Data Wrangling Market Revenue (Million), by Enterprise Type 2024 & 2032
- Figure 56: Europe Data Wrangling Market Volume (K Unit), by Enterprise Type 2024 & 2032
- Figure 57: Europe Data Wrangling Market Revenue Share (%), by Enterprise Type 2024 & 2032
- Figure 58: Europe Data Wrangling Market Volume Share (%), by Enterprise Type 2024 & 2032
- Figure 59: Europe Data Wrangling Market Revenue (Million), by End-user Industry 2024 & 2032
- Figure 60: Europe Data Wrangling Market Volume (K Unit), by End-user Industry 2024 & 2032
- Figure 61: Europe Data Wrangling Market Revenue Share (%), by End-user Industry 2024 & 2032
- Figure 62: Europe Data Wrangling Market Volume Share (%), by End-user Industry 2024 & 2032
- Figure 63: Europe Data Wrangling Market Revenue (Million), by Country 2024 & 2032
- Figure 64: Europe Data Wrangling Market Volume (K Unit), by Country 2024 & 2032
- Figure 65: Europe Data Wrangling Market Revenue Share (%), by Country 2024 & 2032
- Figure 66: Europe Data Wrangling Market Volume Share (%), by Country 2024 & 2032
- Figure 67: Asia Pacific Data Wrangling Market Revenue (Million), by Component 2024 & 2032
- Figure 68: Asia Pacific Data Wrangling Market Volume (K Unit), by Component 2024 & 2032
- Figure 69: Asia Pacific Data Wrangling Market Revenue Share (%), by Component 2024 & 2032
- Figure 70: Asia Pacific Data Wrangling Market Volume Share (%), by Component 2024 & 2032
- Figure 71: Asia Pacific Data Wrangling Market Revenue (Million), by Deployment 2024 & 2032
- Figure 72: Asia Pacific Data Wrangling Market Volume (K Unit), by Deployment 2024 & 2032
- Figure 73: Asia Pacific Data Wrangling Market Revenue Share (%), by Deployment 2024 & 2032
- Figure 74: Asia Pacific Data Wrangling Market Volume Share (%), by Deployment 2024 & 2032
- Figure 75: Asia Pacific Data Wrangling Market Revenue (Million), by Enterprise Type 2024 & 2032
- Figure 76: Asia Pacific Data Wrangling Market Volume (K Unit), by Enterprise Type 2024 & 2032
- Figure 77: Asia Pacific Data Wrangling Market Revenue Share (%), by Enterprise Type 2024 & 2032
- Figure 78: Asia Pacific Data Wrangling Market Volume Share (%), by Enterprise Type 2024 & 2032
- Figure 79: Asia Pacific Data Wrangling Market Revenue (Million), by End-user Industry 2024 & 2032
- Figure 80: Asia Pacific Data Wrangling Market Volume (K Unit), by End-user Industry 2024 & 2032
- Figure 81: Asia Pacific Data Wrangling Market Revenue Share (%), by End-user Industry 2024 & 2032
- Figure 82: Asia Pacific Data Wrangling Market Volume Share (%), by End-user Industry 2024 & 2032
- Figure 83: Asia Pacific Data Wrangling Market Revenue (Million), by Country 2024 & 2032
- Figure 84: Asia Pacific Data Wrangling Market Volume (K Unit), by Country 2024 & 2032
- Figure 85: Asia Pacific Data Wrangling Market Revenue Share (%), by Country 2024 & 2032
- Figure 86: Asia Pacific Data Wrangling Market Volume Share (%), by Country 2024 & 2032
- Figure 87: Latin America Data Wrangling Market Revenue (Million), by Component 2024 & 2032
- Figure 88: Latin America Data Wrangling Market Volume (K Unit), by Component 2024 & 2032
- Figure 89: Latin America Data Wrangling Market Revenue Share (%), by Component 2024 & 2032
- Figure 90: Latin America Data Wrangling Market Volume Share (%), by Component 2024 & 2032
- Figure 91: Latin America Data Wrangling Market Revenue (Million), by Deployment 2024 & 2032
- Figure 92: Latin America Data Wrangling Market Volume (K Unit), by Deployment 2024 & 2032
- Figure 93: Latin America Data Wrangling Market Revenue Share (%), by Deployment 2024 & 2032
- Figure 94: Latin America Data Wrangling Market Volume Share (%), by Deployment 2024 & 2032
- Figure 95: Latin America Data Wrangling Market Revenue (Million), by Enterprise Type 2024 & 2032
- Figure 96: Latin America Data Wrangling Market Volume (K Unit), by Enterprise Type 2024 & 2032
- Figure 97: Latin America Data Wrangling Market Revenue Share (%), by Enterprise Type 2024 & 2032
- Figure 98: Latin America Data Wrangling Market Volume Share (%), by Enterprise Type 2024 & 2032
- Figure 99: Latin America Data Wrangling Market Revenue (Million), by End-user Industry 2024 & 2032
- Figure 100: Latin America Data Wrangling Market Volume (K Unit), by End-user Industry 2024 & 2032
- Figure 101: Latin America Data Wrangling Market Revenue Share (%), by End-user Industry 2024 & 2032
- Figure 102: Latin America Data Wrangling Market Volume Share (%), by End-user Industry 2024 & 2032
- Figure 103: Latin America Data Wrangling Market Revenue (Million), by Country 2024 & 2032
- Figure 104: Latin America Data Wrangling Market Volume (K Unit), by Country 2024 & 2032
- Figure 105: Latin America Data Wrangling Market Revenue Share (%), by Country 2024 & 2032
- Figure 106: Latin America Data Wrangling Market Volume Share (%), by Country 2024 & 2032
- Figure 107: Middle East and Africa Data Wrangling Market Revenue (Million), by Component 2024 & 2032
- Figure 108: Middle East and Africa Data Wrangling Market Volume (K Unit), by Component 2024 & 2032
- Figure 109: Middle East and Africa Data Wrangling Market Revenue Share (%), by Component 2024 & 2032
- Figure 110: Middle East and Africa Data Wrangling Market Volume Share (%), by Component 2024 & 2032
- Figure 111: Middle East and Africa Data Wrangling Market Revenue (Million), by Deployment 2024 & 2032
- Figure 112: Middle East and Africa Data Wrangling Market Volume (K Unit), by Deployment 2024 & 2032
- Figure 113: Middle East and Africa Data Wrangling Market Revenue Share (%), by Deployment 2024 & 2032
- Figure 114: Middle East and Africa Data Wrangling Market Volume Share (%), by Deployment 2024 & 2032
- Figure 115: Middle East and Africa Data Wrangling Market Revenue (Million), by Enterprise Type 2024 & 2032
- Figure 116: Middle East and Africa Data Wrangling Market Volume (K Unit), by Enterprise Type 2024 & 2032
- Figure 117: Middle East and Africa Data Wrangling Market Revenue Share (%), by Enterprise Type 2024 & 2032
- Figure 118: Middle East and Africa Data Wrangling Market Volume Share (%), by Enterprise Type 2024 & 2032
- Figure 119: Middle East and Africa Data Wrangling Market Revenue (Million), by End-user Industry 2024 & 2032
- Figure 120: Middle East and Africa Data Wrangling Market Volume (K Unit), by End-user Industry 2024 & 2032
- Figure 121: Middle East and Africa Data Wrangling Market Revenue Share (%), by End-user Industry 2024 & 2032
- Figure 122: Middle East and Africa Data Wrangling Market Volume Share (%), by End-user Industry 2024 & 2032
- Figure 123: Middle East and Africa Data Wrangling Market Revenue (Million), by Country 2024 & 2032
- Figure 124: Middle East and Africa Data Wrangling Market Volume (K Unit), by Country 2024 & 2032
- Figure 125: Middle East and Africa Data Wrangling Market Revenue Share (%), by Country 2024 & 2032
- Figure 126: Middle East and Africa Data Wrangling Market Volume Share (%), by Country 2024 & 2032
List of Tables
- Table 1: Global Data Wrangling Market Revenue Million Forecast, by Region 2019 & 2032
- Table 2: Global Data Wrangling Market Volume K Unit Forecast, by Region 2019 & 2032
- Table 3: Global Data Wrangling Market Revenue Million Forecast, by Component 2019 & 2032
- Table 4: Global Data Wrangling Market Volume K Unit Forecast, by Component 2019 & 2032
- Table 5: Global Data Wrangling Market Revenue Million Forecast, by Deployment 2019 & 2032
- Table 6: Global Data Wrangling Market Volume K Unit Forecast, by Deployment 2019 & 2032
- Table 7: Global Data Wrangling Market Revenue Million Forecast, by Enterprise Type 2019 & 2032
- Table 8: Global Data Wrangling Market Volume K Unit Forecast, by Enterprise Type 2019 & 2032
- Table 9: Global Data Wrangling Market Revenue Million Forecast, by End-user Industry 2019 & 2032
- Table 10: Global Data Wrangling Market Volume K Unit Forecast, by End-user Industry 2019 & 2032
- Table 11: Global Data Wrangling Market Revenue Million Forecast, by Region 2019 & 2032
- Table 12: Global Data Wrangling Market Volume K Unit Forecast, by Region 2019 & 2032
- Table 13: Global Data Wrangling Market Revenue Million Forecast, by Country 2019 & 2032
- Table 14: Global Data Wrangling Market Volume K Unit Forecast, by Country 2019 & 2032
- Table 15: United States Data Wrangling Market Revenue (Million) Forecast, by Application 2019 & 2032
- Table 16: United States Data Wrangling Market Volume (K Unit) Forecast, by Application 2019 & 2032
- Table 17: Canada Data Wrangling Market Revenue (Million) Forecast, by Application 2019 & 2032
- Table 18: Canada Data Wrangling Market Volume (K Unit) Forecast, by Application 2019 & 2032
- Table 19: Mexico Data Wrangling Market Revenue (Million) Forecast, by Application 2019 & 2032
- Table 20: Mexico Data Wrangling Market Volume (K Unit) Forecast, by Application 2019 & 2032
- Table 21: Global Data Wrangling Market Revenue Million Forecast, by Country 2019 & 2032
- Table 22: Global Data Wrangling Market Volume K Unit Forecast, by Country 2019 & 2032
- Table 23: Germany Data Wrangling Market Revenue (Million) Forecast, by Application 2019 & 2032
- Table 24: Germany Data Wrangling Market Volume (K Unit) Forecast, by Application 2019 & 2032
- Table 25: United Kingdom Data Wrangling Market Revenue (Million) Forecast, by Application 2019 & 2032
- Table 26: United Kingdom Data Wrangling Market Volume (K Unit) Forecast, by Application 2019 & 2032
- Table 27: France Data Wrangling Market Revenue (Million) Forecast, by Application 2019 & 2032
- Table 28: France Data Wrangling Market Volume (K Unit) Forecast, by Application 2019 & 2032
- Table 29: Spain Data Wrangling Market Revenue (Million) Forecast, by Application 2019 & 2032
- Table 30: Spain Data Wrangling Market Volume (K Unit) Forecast, by Application 2019 & 2032
- Table 31: Italy Data Wrangling Market Revenue (Million) Forecast, by Application 2019 & 2032
- Table 32: Italy Data Wrangling Market Volume (K Unit) Forecast, by Application 2019 & 2032
- Table 33: Spain Data Wrangling Market Revenue (Million) Forecast, by Application 2019 & 2032
- Table 34: Spain Data Wrangling Market Volume (K Unit) Forecast, by Application 2019 & 2032
- Table 35: Belgium Data Wrangling Market Revenue (Million) Forecast, by Application 2019 & 2032
- Table 36: Belgium Data Wrangling Market Volume (K Unit) Forecast, by Application 2019 & 2032
- Table 37: Netherland Data Wrangling Market Revenue (Million) Forecast, by Application 2019 & 2032
- Table 38: Netherland Data Wrangling Market Volume (K Unit) Forecast, by Application 2019 & 2032
- Table 39: Nordics Data Wrangling Market Revenue (Million) Forecast, by Application 2019 & 2032
- Table 40: Nordics Data Wrangling Market Volume (K Unit) Forecast, by Application 2019 & 2032
- Table 41: Rest of Europe Data Wrangling Market Revenue (Million) Forecast, by Application 2019 & 2032
- Table 42: Rest of Europe Data Wrangling Market Volume (K Unit) Forecast, by Application 2019 & 2032
- Table 43: Global Data Wrangling Market Revenue Million Forecast, by Country 2019 & 2032
- Table 44: Global Data Wrangling Market Volume K Unit Forecast, by Country 2019 & 2032
- Table 45: China Data Wrangling Market Revenue (Million) Forecast, by Application 2019 & 2032
- Table 46: China Data Wrangling Market Volume (K Unit) Forecast, by Application 2019 & 2032
- Table 47: Japan Data Wrangling Market Revenue (Million) Forecast, by Application 2019 & 2032
- Table 48: Japan Data Wrangling Market Volume (K Unit) Forecast, by Application 2019 & 2032
- Table 49: India Data Wrangling Market Revenue (Million) Forecast, by Application 2019 & 2032
- Table 50: India Data Wrangling Market Volume (K Unit) Forecast, by Application 2019 & 2032
- Table 51: South Korea Data Wrangling Market Revenue (Million) Forecast, by Application 2019 & 2032
- Table 52: South Korea Data Wrangling Market Volume (K Unit) Forecast, by Application 2019 & 2032
- Table 53: Southeast Asia Data Wrangling Market Revenue (Million) Forecast, by Application 2019 & 2032
- Table 54: Southeast Asia Data Wrangling Market Volume (K Unit) Forecast, by Application 2019 & 2032
- Table 55: Australia Data Wrangling Market Revenue (Million) Forecast, by Application 2019 & 2032
- Table 56: Australia Data Wrangling Market Volume (K Unit) Forecast, by Application 2019 & 2032
- Table 57: Indonesia Data Wrangling Market Revenue (Million) Forecast, by Application 2019 & 2032
- Table 58: Indonesia Data Wrangling Market Volume (K Unit) Forecast, by Application 2019 & 2032
- Table 59: Phillipes Data Wrangling Market Revenue (Million) Forecast, by Application 2019 & 2032
- Table 60: Phillipes Data Wrangling Market Volume (K Unit) Forecast, by Application 2019 & 2032
- Table 61: Singapore Data Wrangling Market Revenue (Million) Forecast, by Application 2019 & 2032
- Table 62: Singapore Data Wrangling Market Volume (K Unit) Forecast, by Application 2019 & 2032
- Table 63: Thailandc Data Wrangling Market Revenue (Million) Forecast, by Application 2019 & 2032
- Table 64: Thailandc Data Wrangling Market Volume (K Unit) Forecast, by Application 2019 & 2032
- Table 65: Rest of Asia Pacific Data Wrangling Market Revenue (Million) Forecast, by Application 2019 & 2032
- Table 66: Rest of Asia Pacific Data Wrangling Market Volume (K Unit) Forecast, by Application 2019 & 2032
- Table 67: Global Data Wrangling Market Revenue Million Forecast, by Country 2019 & 2032
- Table 68: Global Data Wrangling Market Volume K Unit Forecast, by Country 2019 & 2032
- Table 69: Brazil Data Wrangling Market Revenue (Million) Forecast, by Application 2019 & 2032
- Table 70: Brazil Data Wrangling Market Volume (K Unit) Forecast, by Application 2019 & 2032
- Table 71: Argentina Data Wrangling Market Revenue (Million) Forecast, by Application 2019 & 2032
- Table 72: Argentina Data Wrangling Market Volume (K Unit) Forecast, by Application 2019 & 2032
- Table 73: Peru Data Wrangling Market Revenue (Million) Forecast, by Application 2019 & 2032
- Table 74: Peru Data Wrangling Market Volume (K Unit) Forecast, by Application 2019 & 2032
- Table 75: Chile Data Wrangling Market Revenue (Million) Forecast, by Application 2019 & 2032
- Table 76: Chile Data Wrangling Market Volume (K Unit) Forecast, by Application 2019 & 2032
- Table 77: Colombia Data Wrangling Market Revenue (Million) Forecast, by Application 2019 & 2032
- Table 78: Colombia Data Wrangling Market Volume (K Unit) Forecast, by Application 2019 & 2032
- Table 79: Ecuador Data Wrangling Market Revenue (Million) Forecast, by Application 2019 & 2032
- Table 80: Ecuador Data Wrangling Market Volume (K Unit) Forecast, by Application 2019 & 2032
- Table 81: Venezuela Data Wrangling Market Revenue (Million) Forecast, by Application 2019 & 2032
- Table 82: Venezuela Data Wrangling Market Volume (K Unit) Forecast, by Application 2019 & 2032
- Table 83: Rest of South America Data Wrangling Market Revenue (Million) Forecast, by Application 2019 & 2032
- Table 84: Rest of South America Data Wrangling Market Volume (K Unit) Forecast, by Application 2019 & 2032
- Table 85: Global Data Wrangling Market Revenue Million Forecast, by Country 2019 & 2032
- Table 86: Global Data Wrangling Market Volume K Unit Forecast, by Country 2019 & 2032
- Table 87: United States Data Wrangling Market Revenue (Million) Forecast, by Application 2019 & 2032
- Table 88: United States Data Wrangling Market Volume (K Unit) Forecast, by Application 2019 & 2032
- Table 89: Canada Data Wrangling Market Revenue (Million) Forecast, by Application 2019 & 2032
- Table 90: Canada Data Wrangling Market Volume (K Unit) Forecast, by Application 2019 & 2032
- Table 91: Mexico Data Wrangling Market Revenue (Million) Forecast, by Application 2019 & 2032
- Table 92: Mexico Data Wrangling Market Volume (K Unit) Forecast, by Application 2019 & 2032
- Table 93: Global Data Wrangling Market Revenue Million Forecast, by Country 2019 & 2032
- Table 94: Global Data Wrangling Market Volume K Unit Forecast, by Country 2019 & 2032
- Table 95: United Arab Emirates Data Wrangling Market Revenue (Million) Forecast, by Application 2019 & 2032
- Table 96: United Arab Emirates Data Wrangling Market Volume (K Unit) Forecast, by Application 2019 & 2032
- Table 97: Saudi Arabia Data Wrangling Market Revenue (Million) Forecast, by Application 2019 & 2032
- Table 98: Saudi Arabia Data Wrangling Market Volume (K Unit) Forecast, by Application 2019 & 2032
- Table 99: South Africa Data Wrangling Market Revenue (Million) Forecast, by Application 2019 & 2032
- Table 100: South Africa Data Wrangling Market Volume (K Unit) Forecast, by Application 2019 & 2032
- Table 101: Rest of Middle East and Africa Data Wrangling Market Revenue (Million) Forecast, by Application 2019 & 2032
- Table 102: Rest of Middle East and Africa Data Wrangling Market Volume (K Unit) Forecast, by Application 2019 & 2032
- Table 103: Global Data Wrangling Market Revenue Million Forecast, by Component 2019 & 2032
- Table 104: Global Data Wrangling Market Volume K Unit Forecast, by Component 2019 & 2032
- Table 105: Global Data Wrangling Market Revenue Million Forecast, by Deployment 2019 & 2032
- Table 106: Global Data Wrangling Market Volume K Unit Forecast, by Deployment 2019 & 2032
- Table 107: Global Data Wrangling Market Revenue Million Forecast, by Enterprise Type 2019 & 2032
- Table 108: Global Data Wrangling Market Volume K Unit Forecast, by Enterprise Type 2019 & 2032
- Table 109: Global Data Wrangling Market Revenue Million Forecast, by End-user Industry 2019 & 2032
- Table 110: Global Data Wrangling Market Volume K Unit Forecast, by End-user Industry 2019 & 2032
- Table 111: Global Data Wrangling Market Revenue Million Forecast, by Country 2019 & 2032
- Table 112: Global Data Wrangling Market Volume K Unit Forecast, by Country 2019 & 2032
- Table 113: United States Data Wrangling Market Revenue (Million) Forecast, by Application 2019 & 2032
- Table 114: United States Data Wrangling Market Volume (K Unit) Forecast, by Application 2019 & 2032
- Table 115: Canada Data Wrangling Market Revenue (Million) Forecast, by Application 2019 & 2032
- Table 116: Canada Data Wrangling Market Volume (K Unit) Forecast, by Application 2019 & 2032
- Table 117: Global Data Wrangling Market Revenue Million Forecast, by Component 2019 & 2032
- Table 118: Global Data Wrangling Market Volume K Unit Forecast, by Component 2019 & 2032
- Table 119: Global Data Wrangling Market Revenue Million Forecast, by Deployment 2019 & 2032
- Table 120: Global Data Wrangling Market Volume K Unit Forecast, by Deployment 2019 & 2032
- Table 121: Global Data Wrangling Market Revenue Million Forecast, by Enterprise Type 2019 & 2032
- Table 122: Global Data Wrangling Market Volume K Unit Forecast, by Enterprise Type 2019 & 2032
- Table 123: Global Data Wrangling Market Revenue Million Forecast, by End-user Industry 2019 & 2032
- Table 124: Global Data Wrangling Market Volume K Unit Forecast, by End-user Industry 2019 & 2032
- Table 125: Global Data Wrangling Market Revenue Million Forecast, by Country 2019 & 2032
- Table 126: Global Data Wrangling Market Volume K Unit Forecast, by Country 2019 & 2032
- Table 127: United Kingdom Data Wrangling Market Revenue (Million) Forecast, by Application 2019 & 2032
- Table 128: United Kingdom Data Wrangling Market Volume (K Unit) Forecast, by Application 2019 & 2032
- Table 129: Germany Data Wrangling Market Revenue (Million) Forecast, by Application 2019 & 2032
- Table 130: Germany Data Wrangling Market Volume (K Unit) Forecast, by Application 2019 & 2032
- Table 131: France Data Wrangling Market Revenue (Million) Forecast, by Application 2019 & 2032
- Table 132: France Data Wrangling Market Volume (K Unit) Forecast, by Application 2019 & 2032
- Table 133: Rest of Europe Data Wrangling Market Revenue (Million) Forecast, by Application 2019 & 2032
- Table 134: Rest of Europe Data Wrangling Market Volume (K Unit) Forecast, by Application 2019 & 2032
- Table 135: Global Data Wrangling Market Revenue Million Forecast, by Component 2019 & 2032
- Table 136: Global Data Wrangling Market Volume K Unit Forecast, by Component 2019 & 2032
- Table 137: Global Data Wrangling Market Revenue Million Forecast, by Deployment 2019 & 2032
- Table 138: Global Data Wrangling Market Volume K Unit Forecast, by Deployment 2019 & 2032
- Table 139: Global Data Wrangling Market Revenue Million Forecast, by Enterprise Type 2019 & 2032
- Table 140: Global Data Wrangling Market Volume K Unit Forecast, by Enterprise Type 2019 & 2032
- Table 141: Global Data Wrangling Market Revenue Million Forecast, by End-user Industry 2019 & 2032
- Table 142: Global Data Wrangling Market Volume K Unit Forecast, by End-user Industry 2019 & 2032
- Table 143: Global Data Wrangling Market Revenue Million Forecast, by Country 2019 & 2032
- Table 144: Global Data Wrangling Market Volume K Unit Forecast, by Country 2019 & 2032
- Table 145: China Data Wrangling Market Revenue (Million) Forecast, by Application 2019 & 2032
- Table 146: China Data Wrangling Market Volume (K Unit) Forecast, by Application 2019 & 2032
- Table 147: Japan Data Wrangling Market Revenue (Million) Forecast, by Application 2019 & 2032
- Table 148: Japan Data Wrangling Market Volume (K Unit) Forecast, by Application 2019 & 2032
- Table 149: Singapore Data Wrangling Market Revenue (Million) Forecast, by Application 2019 & 2032
- Table 150: Singapore Data Wrangling Market Volume (K Unit) Forecast, by Application 2019 & 2032
- Table 151: Rest of Asia Pacific Data Wrangling Market Revenue (Million) Forecast, by Application 2019 & 2032
- Table 152: Rest of Asia Pacific Data Wrangling Market Volume (K Unit) Forecast, by Application 2019 & 2032
- Table 153: Global Data Wrangling Market Revenue Million Forecast, by Component 2019 & 2032
- Table 154: Global Data Wrangling Market Volume K Unit Forecast, by Component 2019 & 2032
- Table 155: Global Data Wrangling Market Revenue Million Forecast, by Deployment 2019 & 2032
- Table 156: Global Data Wrangling Market Volume K Unit Forecast, by Deployment 2019 & 2032
- Table 157: Global Data Wrangling Market Revenue Million Forecast, by Enterprise Type 2019 & 2032
- Table 158: Global Data Wrangling Market Volume K Unit Forecast, by Enterprise Type 2019 & 2032
- Table 159: Global Data Wrangling Market Revenue Million Forecast, by End-user Industry 2019 & 2032
- Table 160: Global Data Wrangling Market Volume K Unit Forecast, by End-user Industry 2019 & 2032
- Table 161: Global Data Wrangling Market Revenue Million Forecast, by Country 2019 & 2032
- Table 162: Global Data Wrangling Market Volume K Unit Forecast, by Country 2019 & 2032
- Table 163: Mexico Data Wrangling Market Revenue (Million) Forecast, by Application 2019 & 2032
- Table 164: Mexico Data Wrangling Market Volume (K Unit) Forecast, by Application 2019 & 2032
- Table 165: Brazil Data Wrangling Market Revenue (Million) Forecast, by Application 2019 & 2032
- Table 166: Brazil Data Wrangling Market Volume (K Unit) Forecast, by Application 2019 & 2032
- Table 167: Rest of Latin America Data Wrangling Market Revenue (Million) Forecast, by Application 2019 & 2032
- Table 168: Rest of Latin America Data Wrangling Market Volume (K Unit) Forecast, by Application 2019 & 2032
- Table 169: Global Data Wrangling Market Revenue Million Forecast, by Component 2019 & 2032
- Table 170: Global Data Wrangling Market Volume K Unit Forecast, by Component 2019 & 2032
- Table 171: Global Data Wrangling Market Revenue Million Forecast, by Deployment 2019 & 2032
- Table 172: Global Data Wrangling Market Volume K Unit Forecast, by Deployment 2019 & 2032
- Table 173: Global Data Wrangling Market Revenue Million Forecast, by Enterprise Type 2019 & 2032
- Table 174: Global Data Wrangling Market Volume K Unit Forecast, by Enterprise Type 2019 & 2032
- Table 175: Global Data Wrangling Market Revenue Million Forecast, by End-user Industry 2019 & 2032
- Table 176: Global Data Wrangling Market Volume K Unit Forecast, by End-user Industry 2019 & 2032
- Table 177: Global Data Wrangling Market Revenue Million Forecast, by Country 2019 & 2032
- Table 178: Global Data Wrangling Market Volume K Unit Forecast, by Country 2019 & 2032
- Table 179: United Arab Emirates Data Wrangling Market Revenue (Million) Forecast, by Application 2019 & 2032
- Table 180: United Arab Emirates Data Wrangling Market Volume (K Unit) Forecast, by Application 2019 & 2032
- Table 181: Saudi Arabia Data Wrangling Market Revenue (Million) Forecast, by Application 2019 & 2032
- Table 182: Saudi Arabia Data Wrangling Market Volume (K Unit) Forecast, by Application 2019 & 2032
- Table 183: Rest of Middle East Data Wrangling Market Revenue (Million) Forecast, by Application 2019 & 2032
- Table 184: Rest of Middle East Data Wrangling Market Volume (K Unit) Forecast, by Application 2019 & 2032
Frequently Asked Questions
1. What is the projected Compound Annual Growth Rate (CAGR) of the Data Wrangling Market?
The projected CAGR is approximately 11.03%.
2. Which companies are prominent players in the Data Wrangling Market?
Key companies in the market include SAS Institute Inc, TIBCO Software Inc (Cloud Software Group Inc ), Teradata Corporation, Cloudera Inc, Altair Engineering Inc, Cambridge Semantics Inc , Alteryx Inc, Oracle Corporation, DataRobot Inc, Datameer Inc.
3. What are the main segments of the Data Wrangling Market?
The market segments include Component, Deployment, Enterprise Type, End-user Industry.
4. Can you provide details about the market size?
The market size is estimated to be USD 3.41 Million as of 2022.
5. What are some drivers contributing to market growth?
Growing Volumes of Data; Advancement in AI And Big Data Technologies; Growing Concern about Data Veracity.
6. What are the notable trends driving market growth?
Large Enterprises are Analyzed to Hold Significant Market Share.
7. Are there any restraints impacting market growth?
Lack Of Awareness Of Data Wrangling Tools Among Enterprises; Explicit Data Access Permission.
8. Can you provide examples of recent developments in the market?
May 2023 - Adroit DI launched SDF Pro, a cloud-based application that provides a cost-effective solution for storing, sorting, and Wrangling 10 million molecules within seconds. SDF Pro offers a user-configurable interface accessible from login, enabling users to organize, structure, and store large data sets.
9. What pricing options are available for accessing the report?
Pricing options include single-user, multi-user, and enterprise licenses priced at USD 4750, USD 5250, and USD 8750 respectively.
10. Is the market size provided in terms of value or volume?
The market size is provided in terms of value, measured in Million and volume, measured in K Unit.
11. Are there any specific market keywords associated with the report?
Yes, the market keyword associated with the report is "Data Wrangling Market," which aids in identifying and referencing the specific market segment covered.
12. How do I determine which pricing option suits my needs best?
The pricing options vary based on user requirements and access needs. Individual users may opt for single-user licenses, while businesses requiring broader access may choose multi-user or enterprise licenses for cost-effective access to the report.
13. Are there any additional resources or data provided in the Data Wrangling Market report?
While the report offers comprehensive insights, it's advisable to review the specific contents or supplementary materials provided to ascertain if additional resources or data are available.
14. How can I stay updated on further developments or reports in the Data Wrangling Market?
To stay informed about further developments, trends, and reports in the Data Wrangling Market, consider subscribing to industry newsletters, following relevant companies and organizations, or regularly checking reputable industry news sources and publications.
Methodology
Step 1 - Identification of Relevant Samples Size from Population Database


Step 2 - Approaches for Defining Global Market Size (Value, Volume* & Price*)

Note*: In applicable scenarios
Step 3 - Data Sources
Primary Research
- Web Analytics
- Survey Reports
- Research Institute
- Latest Research Reports
- Opinion Leaders
Secondary Research
- Annual Reports
- White Paper
- Latest Press Release
- Industry Association
- Paid Database
- Investor Presentations

Step 4 - Data Triangulation
Involves using different sources of information in order to increase the validity of a study
These sources are likely to be stakeholders in a program - participants, other researchers, program staff, other community members, and so on.
Then we put all data in single framework & apply various statistical tools to find out the dynamic on the market.
During the analysis stage, feedback from the stakeholder groups would be compared to determine areas of agreement as well as areas of divergence
