

Key Insights
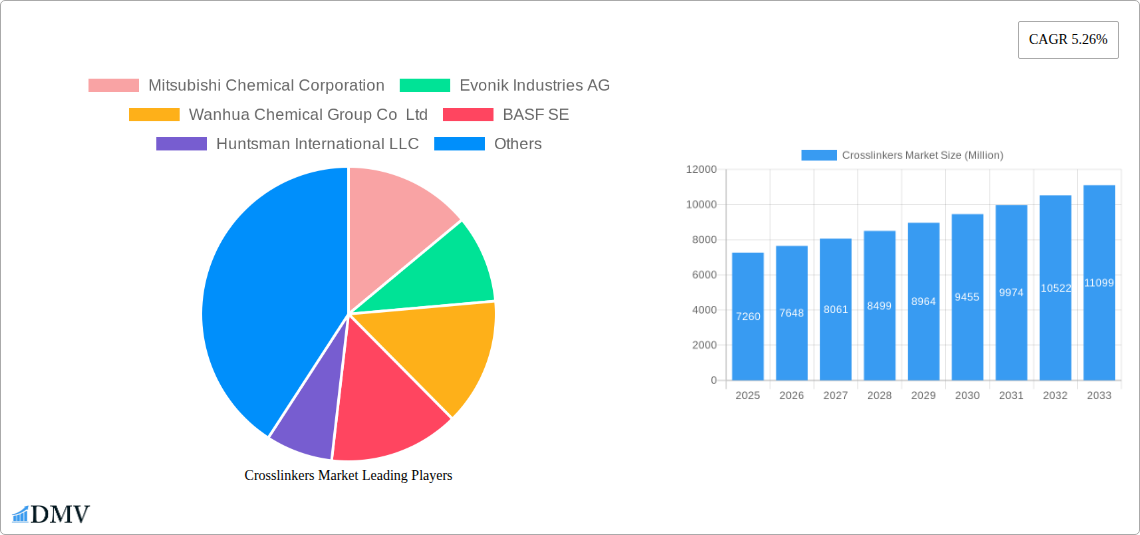
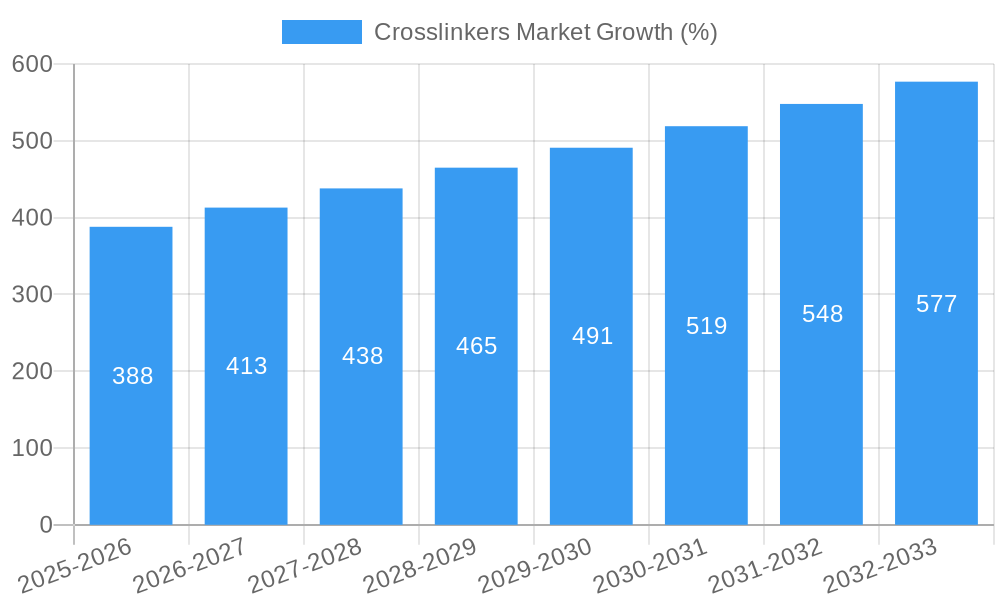
The global crosslinkers market, valued at $7.26 billion in 2025, is projected to experience robust growth, driven by a Compound Annual Growth Rate (CAGR) of 5.26% from 2025 to 2033. This expansion is fueled by several key factors. The automotive industry's increasing demand for high-performance coatings, characterized by enhanced durability and scratch resistance, significantly contributes to market growth. Similarly, the construction and decorative coatings sectors are witnessing a surge in demand for crosslinkers due to their ability to improve the longevity and aesthetic appeal of paints and coatings. Expanding packaging applications, particularly in food and beverage industries requiring enhanced barrier properties, further propel market expansion. Technological advancements leading to the development of more sustainable and environmentally friendly crosslinkers are also shaping market dynamics, attracting environmentally conscious consumers and businesses. The dominant market segments are Automotive Coatings and Amide-type crosslinkers, reflecting the substantial demand from these specific applications and chemical types. However, challenges persist, including fluctuating raw material prices and stringent environmental regulations that necessitate innovation in crosslinker chemistry.
Geographical analysis reveals a strong presence of the crosslinkers market in Asia Pacific, particularly China and India, driven by rapid industrialization and increasing consumer spending. North America and Europe also hold significant market share due to established automotive and industrial sectors. However, emerging economies in South America, the Middle East, and Africa are presenting promising growth opportunities for crosslinker manufacturers as these regions witness increasing infrastructural development and industrial expansion. The competitive landscape is characterized by a blend of large multinational corporations and regional players. Intense competition drives innovation and price optimization, ultimately impacting market accessibility and growth trajectories. The future of the crosslinkers market is bright, with sustained growth fueled by continuous innovation in materials science and expanding global demand across diverse applications.
Crosslinkers Market: A Comprehensive Report (2019-2033)
This insightful report provides a detailed analysis of the Crosslinkers Market, offering a comprehensive overview of market trends, leading players, and future growth prospects. Covering the period from 2019 to 2033, with a focus on 2025, this report is an essential resource for stakeholders seeking to understand and capitalize on opportunities within this dynamic industry. The study period is 2019–2033, with 2025 serving as the base and estimated year, and 2025–2033 as the forecast period. The historical period covered is 2019–2024.
Crosslinkers Market Composition & Trends
This section delves into the intricate dynamics of the Crosslinkers Market, evaluating market concentration, innovation drivers, regulatory landscapes, substitute products, end-user profiles, and mergers & acquisitions (M&A) activities. We analyze market share distribution among key players like Mitsubishi Chemical Corporation, Evonik Industries AG, Wanhua Chemical Group Co Ltd, BASF SE, Huntsman International LLC, Dow, Aditya Birla Chemicals, KUMHO P&B CHEMICALS INC, Allnex GMBH, Hexion, NIPPON SHOKUBAI CO LTD, Covestro AG, and Nisshinbo Chemical Inc. (list not exhaustive). The report examines the impact of significant M&A activities, such as the USD 1.2 Billion sale of Hexion's epoxy businesses in February 2022, and the USD 4.25 Billion acquisition of Allnex by PTT Global Chemical in December 2021. These transactions significantly reshape the competitive landscape and influence market concentration. The report quantifies market share distribution (xx%) and provides a detailed analysis of these and other M&A activities, their impact on market dynamics, and the resulting market concentration levels. Further, we analyze the influence of regulatory landscapes (xx% compliance rate), substitution products (xx% market share), and end-user profiles (xx% industrial sector penetration) to paint a complete picture of the current market structure and future trajectories.
Crosslinkers Market Industry Evolution
This section meticulously examines the evolution of the Crosslinkers Market, tracing its growth trajectory, technological advancements, and the shifting preferences of consumers. We analyze the compound annual growth rate (CAGR) of the market during the historical period (2019-2024) at xx% and project the CAGR for the forecast period (2025-2033) at xx%. This analysis incorporates detailed assessments of technological advancements, such as the introduction of novel crosslinking agents, improvements in application methods, and the increasing adoption of sustainable crosslinking technologies. The impact of these advancements on market growth is quantified, providing specific data points on adoption rates and their influence on overall market expansion. Furthermore, we analyze changing consumer demands, focusing on their influence on the preference for specific crosslinker types and applications.
Leading Regions, Countries, or Segments in Crosslinkers Market
This section identifies the dominant regions, countries, and segments within the Crosslinkers Market, considering both application (Automotive Coatings, Decorative Coatings, Industrial Coatings, Packaging Coatings, Other Applications) and type (Amide, Amine, Amino, Carbodiimide, Isocyanate, Other Types).
Key Drivers:
- Significant investments in automotive and construction industries (xx Million USD).
- Stringent environmental regulations driving demand for eco-friendly crosslinkers (xx% increase in demand).
- Growing demand for high-performance coatings in various sectors.
Dominance Factors: The report will detail the factors contributing to the dominance of specific regions (e.g., Asia-Pacific's growth driven by automotive and construction expansion) and segments (e.g., Isocyanate’s high market share due to superior performance in certain applications). Specific examples and data will be provided to support these findings.
Crosslinkers Market Product Innovations
This section highlights recent product innovations, their applications, and corresponding performance metrics. We will showcase unique selling propositions (USPs) and technological advancements, emphasizing improvements in durability, sustainability, and ease of application. Examples of innovative crosslinkers with enhanced properties and their market penetration (xx%) will be presented.
Propelling Factors for Crosslinkers Market Growth
Several factors drive the growth of the Crosslinkers Market. Technological advancements, particularly in the development of high-performance and sustainable crosslinkers, are crucial. Economic factors, such as increasing industrial production and infrastructure development, significantly contribute to market expansion. Favorable regulatory environments, supporting sustainable practices and promoting the use of high-performance materials, further stimulate market growth.
Obstacles in the Crosslinkers Market
The Crosslinkers Market faces challenges including stringent environmental regulations (resulting in xx% increase in compliance costs), supply chain disruptions leading to price fluctuations (xx% price volatility), and intense competition among major players (resulting in a xx% reduction in average profit margins). These obstacles influence market growth and necessitate careful strategic planning for businesses operating in this sector.
Future Opportunities in Crosslinkers Market
Future opportunities lie in expanding into emerging markets, particularly in developing economies with significant infrastructure development. The development and adoption of new technologies, such as bio-based crosslinkers and advanced curing techniques, represent substantial opportunities. Emerging consumer trends, focusing on sustainability and enhanced performance, present further avenues for market growth.
Major Players in the Crosslinkers Market Ecosystem
- Mitsubishi Chemical Corporation
- Evonik Industries AG
- Wanhua Chemical Group Co Ltd
- BASF SE
- Huntsman International LLC
- Dow
- Aditya Birla Chemicals
- KUMHO P&B CHEMICALS INC
- Allnex GMBH
- Hexion
- NIPPON SHOKUBAI CO LTD
- Covestro AG
- Nisshinbo Chemical Inc
Key Developments in Crosslinkers Market Industry
- December 2021: Allnex acquired by PTT Global Chemical for ~USD 4.25 Billion, significantly altering market dynamics.
- February 2022: Hexion sold its epoxy-based businesses for USD 1.2 Billion to Westlake Chemical Corporation, impacting the competitive landscape.
Strategic Crosslinkers Market Forecast
The Crosslinkers Market is poised for substantial growth, driven by technological advancements, increasing demand across various applications, and supportive regulatory environments. The market's future trajectory hinges on continued innovation, expansion into new geographical markets, and successful adaptation to evolving consumer preferences, promising significant opportunities for market players. Our forecasts predict a robust market expansion in the coming years, reaching xx Million USD by 2033.
Crosslinkers Market Segmentation
-
1. Type
- 1.1. Amide
- 1.2. Amine
- 1.3. Amino
- 1.4. Carbodiimide
- 1.5. Isocyanate
- 1.6. Other Types
-
2. Application
- 2.1. Automotive Coatings
- 2.2. Decorative Coatings
- 2.3. Industrial Coatings
- 2.4. Packaging Coatings
- 2.5. Other Applications
Crosslinkers Market Segmentation By Geography
-
1. Asia Pacific
- 1.1. China
- 1.2. India
- 1.3. Japan
- 1.4. South Korea
- 1.5. Rest of Asia Pacific
-
2. North America
- 2.1. United States
- 2.2. Canada
- 2.3. Mexico
-
3. Europe
- 3.1. Germany
- 3.2. United Kingdom
- 3.3. France
- 3.4. Italy
- 3.5. Rest of Europe
-
4. South America
- 4.1. Brazil
- 4.2. Argentina
- 4.3. Rest of South America
-
5. Middle East and Africa
- 5.1. Saudi Arabia
- 5.2. South Africa
- 5.3. Rest of Middle East and Africa

Crosslinkers Market REPORT HIGHLIGHTS
| Aspects | Details |
|---|---|
| Study Period | 2019-2033 |
| Base Year | 2024 |
| Estimated Year | 2025 |
| Forecast Period | 2025-2033 |
| Historical Period | 2019-2024 |
| Growth Rate | CAGR of 5.26% from 2019-2033 |
| Segmentation |
|
Table of Contents
- 1. Introduction
- 1.1. Research Scope
- 1.2. Market Segmentation
- 1.3. Research Methodology
- 1.4. Definitions and Assumptions
- 2. Executive Summary
- 2.1. Introduction
- 3. Market Dynamics
- 3.1. Introduction
- 3.2. Market Drivers
- 3.2.1. Increasing Demad for Numerous Coatings; Increasing Focus on High-Performance Crosslinking Agents
- 3.3. Market Restrains
- 3.3.1. Presence of Self-Crosslinking Agents
- 3.4. Market Trends
- 3.4.1. Increasing Demand for Decorative Coatings
- 4. Market Factor Analysis
- 4.1. Porters Five Forces
- 4.2. Supply/Value Chain
- 4.3. PESTEL analysis
- 4.4. Market Entropy
- 4.5. Patent/Trademark Analysis
- 5. Global Crosslinkers Market Analysis, Insights and Forecast, 2019-2031
- 5.1. Market Analysis, Insights and Forecast - by Type
- 5.1.1. Amide
- 5.1.2. Amine
- 5.1.3. Amino
- 5.1.4. Carbodiimide
- 5.1.5. Isocyanate
- 5.1.6. Other Types
- 5.2. Market Analysis, Insights and Forecast - by Application
- 5.2.1. Automotive Coatings
- 5.2.2. Decorative Coatings
- 5.2.3. Industrial Coatings
- 5.2.4. Packaging Coatings
- 5.2.5. Other Applications
- 5.3. Market Analysis, Insights and Forecast - by Region
- 5.3.1. Asia Pacific
- 5.3.2. North America
- 5.3.3. Europe
- 5.3.4. South America
- 5.3.5. Middle East and Africa
- 5.1. Market Analysis, Insights and Forecast - by Type
- 6. Asia Pacific Crosslinkers Market Analysis, Insights and Forecast, 2019-2031
- 6.1. Market Analysis, Insights and Forecast - by Type
- 6.1.1. Amide
- 6.1.2. Amine
- 6.1.3. Amino
- 6.1.4. Carbodiimide
- 6.1.5. Isocyanate
- 6.1.6. Other Types
- 6.2. Market Analysis, Insights and Forecast - by Application
- 6.2.1. Automotive Coatings
- 6.2.2. Decorative Coatings
- 6.2.3. Industrial Coatings
- 6.2.4. Packaging Coatings
- 6.2.5. Other Applications
- 6.1. Market Analysis, Insights and Forecast - by Type
- 7. North America Crosslinkers Market Analysis, Insights and Forecast, 2019-2031
- 7.1. Market Analysis, Insights and Forecast - by Type
- 7.1.1. Amide
- 7.1.2. Amine
- 7.1.3. Amino
- 7.1.4. Carbodiimide
- 7.1.5. Isocyanate
- 7.1.6. Other Types
- 7.2. Market Analysis, Insights and Forecast - by Application
- 7.2.1. Automotive Coatings
- 7.2.2. Decorative Coatings
- 7.2.3. Industrial Coatings
- 7.2.4. Packaging Coatings
- 7.2.5. Other Applications
- 7.1. Market Analysis, Insights and Forecast - by Type
- 8. Europe Crosslinkers Market Analysis, Insights and Forecast, 2019-2031
- 8.1. Market Analysis, Insights and Forecast - by Type
- 8.1.1. Amide
- 8.1.2. Amine
- 8.1.3. Amino
- 8.1.4. Carbodiimide
- 8.1.5. Isocyanate
- 8.1.6. Other Types
- 8.2. Market Analysis, Insights and Forecast - by Application
- 8.2.1. Automotive Coatings
- 8.2.2. Decorative Coatings
- 8.2.3. Industrial Coatings
- 8.2.4. Packaging Coatings
- 8.2.5. Other Applications
- 8.1. Market Analysis, Insights and Forecast - by Type
- 9. South America Crosslinkers Market Analysis, Insights and Forecast, 2019-2031
- 9.1. Market Analysis, Insights and Forecast - by Type
- 9.1.1. Amide
- 9.1.2. Amine
- 9.1.3. Amino
- 9.1.4. Carbodiimide
- 9.1.5. Isocyanate
- 9.1.6. Other Types
- 9.2. Market Analysis, Insights and Forecast - by Application
- 9.2.1. Automotive Coatings
- 9.2.2. Decorative Coatings
- 9.2.3. Industrial Coatings
- 9.2.4. Packaging Coatings
- 9.2.5. Other Applications
- 9.1. Market Analysis, Insights and Forecast - by Type
- 10. Middle East and Africa Crosslinkers Market Analysis, Insights and Forecast, 2019-2031
- 10.1. Market Analysis, Insights and Forecast - by Type
- 10.1.1. Amide
- 10.1.2. Amine
- 10.1.3. Amino
- 10.1.4. Carbodiimide
- 10.1.5. Isocyanate
- 10.1.6. Other Types
- 10.2. Market Analysis, Insights and Forecast - by Application
- 10.2.1. Automotive Coatings
- 10.2.2. Decorative Coatings
- 10.2.3. Industrial Coatings
- 10.2.4. Packaging Coatings
- 10.2.5. Other Applications
- 10.1. Market Analysis, Insights and Forecast - by Type
- 11. Asia Pacific Crosslinkers Market Analysis, Insights and Forecast, 2019-2031
- 11.1. Market Analysis, Insights and Forecast - By Country/Sub-region
- 11.1.1 China
- 11.1.2 India
- 11.1.3 Japan
- 11.1.4 South Korea
- 11.1.5 Rest of Asia Pacific
- 12. North America Crosslinkers Market Analysis, Insights and Forecast, 2019-2031
- 12.1. Market Analysis, Insights and Forecast - By Country/Sub-region
- 12.1.1 United States
- 12.1.2 Canada
- 12.1.3 Mexico
- 13. Europe Crosslinkers Market Analysis, Insights and Forecast, 2019-2031
- 13.1. Market Analysis, Insights and Forecast - By Country/Sub-region
- 13.1.1 Germany
- 13.1.2 United Kingdom
- 13.1.3 France
- 13.1.4 Italy
- 13.1.5 Rest of Europe
- 14. South America Crosslinkers Market Analysis, Insights and Forecast, 2019-2031
- 14.1. Market Analysis, Insights and Forecast - By Country/Sub-region
- 14.1.1 Brazil
- 14.1.2 Argentina
- 14.1.3 Rest of South America
- 15. Middle East and Africa Crosslinkers Market Analysis, Insights and Forecast, 2019-2031
- 15.1. Market Analysis, Insights and Forecast - By Country/Sub-region
- 15.1.1 Saudi Arabia
- 15.1.2 South Africa
- 15.1.3 Rest of Middle East and Africa
- 16. Competitive Analysis
- 16.1. Global Market Share Analysis 2024
- 16.2. Company Profiles
- 16.2.1 Mitsubishi Chemical Corporation
- 16.2.1.1. Overview
- 16.2.1.2. Products
- 16.2.1.3. SWOT Analysis
- 16.2.1.4. Recent Developments
- 16.2.1.5. Financials (Based on Availability)
- 16.2.2 Evonik Industries AG
- 16.2.2.1. Overview
- 16.2.2.2. Products
- 16.2.2.3. SWOT Analysis
- 16.2.2.4. Recent Developments
- 16.2.2.5. Financials (Based on Availability)
- 16.2.3 Wanhua Chemical Group Co Ltd
- 16.2.3.1. Overview
- 16.2.3.2. Products
- 16.2.3.3. SWOT Analysis
- 16.2.3.4. Recent Developments
- 16.2.3.5. Financials (Based on Availability)
- 16.2.4 BASF SE
- 16.2.4.1. Overview
- 16.2.4.2. Products
- 16.2.4.3. SWOT Analysis
- 16.2.4.4. Recent Developments
- 16.2.4.5. Financials (Based on Availability)
- 16.2.5 Huntsman International LLC
- 16.2.5.1. Overview
- 16.2.5.2. Products
- 16.2.5.3. SWOT Analysis
- 16.2.5.4. Recent Developments
- 16.2.5.5. Financials (Based on Availability)
- 16.2.6 Dow
- 16.2.6.1. Overview
- 16.2.6.2. Products
- 16.2.6.3. SWOT Analysis
- 16.2.6.4. Recent Developments
- 16.2.6.5. Financials (Based on Availability)
- 16.2.7 Aditya Birla Chemicals
- 16.2.7.1. Overview
- 16.2.7.2. Products
- 16.2.7.3. SWOT Analysis
- 16.2.7.4. Recent Developments
- 16.2.7.5. Financials (Based on Availability)
- 16.2.8 KUMHO P&B CHEMICALS INC *List Not Exhaustive
- 16.2.8.1. Overview
- 16.2.8.2. Products
- 16.2.8.3. SWOT Analysis
- 16.2.8.4. Recent Developments
- 16.2.8.5. Financials (Based on Availability)
- 16.2.9 Allnex GMBH
- 16.2.9.1. Overview
- 16.2.9.2. Products
- 16.2.9.3. SWOT Analysis
- 16.2.9.4. Recent Developments
- 16.2.9.5. Financials (Based on Availability)
- 16.2.10 Hexion
- 16.2.10.1. Overview
- 16.2.10.2. Products
- 16.2.10.3. SWOT Analysis
- 16.2.10.4. Recent Developments
- 16.2.10.5. Financials (Based on Availability)
- 16.2.11 NIPPON SHOKUBAI CO LTD
- 16.2.11.1. Overview
- 16.2.11.2. Products
- 16.2.11.3. SWOT Analysis
- 16.2.11.4. Recent Developments
- 16.2.11.5. Financials (Based on Availability)
- 16.2.12 Covestro AG
- 16.2.12.1. Overview
- 16.2.12.2. Products
- 16.2.12.3. SWOT Analysis
- 16.2.12.4. Recent Developments
- 16.2.12.5. Financials (Based on Availability)
- 16.2.13 Nisshinbo Chemical Inc
- 16.2.13.1. Overview
- 16.2.13.2. Products
- 16.2.13.3. SWOT Analysis
- 16.2.13.4. Recent Developments
- 16.2.13.5. Financials (Based on Availability)
- 16.2.1 Mitsubishi Chemical Corporation
List of Figures
- Figure 1: Global Crosslinkers Market Revenue Breakdown (Million, %) by Region 2024 & 2032
- Figure 2: Asia Pacific Crosslinkers Market Revenue (Million), by Country 2024 & 2032
- Figure 3: Asia Pacific Crosslinkers Market Revenue Share (%), by Country 2024 & 2032
- Figure 4: North America Crosslinkers Market Revenue (Million), by Country 2024 & 2032
- Figure 5: North America Crosslinkers Market Revenue Share (%), by Country 2024 & 2032
- Figure 6: Europe Crosslinkers Market Revenue (Million), by Country 2024 & 2032
- Figure 7: Europe Crosslinkers Market Revenue Share (%), by Country 2024 & 2032
- Figure 8: South America Crosslinkers Market Revenue (Million), by Country 2024 & 2032
- Figure 9: South America Crosslinkers Market Revenue Share (%), by Country 2024 & 2032
- Figure 10: Middle East and Africa Crosslinkers Market Revenue (Million), by Country 2024 & 2032
- Figure 11: Middle East and Africa Crosslinkers Market Revenue Share (%), by Country 2024 & 2032
- Figure 12: Asia Pacific Crosslinkers Market Revenue (Million), by Type 2024 & 2032
- Figure 13: Asia Pacific Crosslinkers Market Revenue Share (%), by Type 2024 & 2032
- Figure 14: Asia Pacific Crosslinkers Market Revenue (Million), by Application 2024 & 2032
- Figure 15: Asia Pacific Crosslinkers Market Revenue Share (%), by Application 2024 & 2032
- Figure 16: Asia Pacific Crosslinkers Market Revenue (Million), by Country 2024 & 2032
- Figure 17: Asia Pacific Crosslinkers Market Revenue Share (%), by Country 2024 & 2032
- Figure 18: North America Crosslinkers Market Revenue (Million), by Type 2024 & 2032
- Figure 19: North America Crosslinkers Market Revenue Share (%), by Type 2024 & 2032
- Figure 20: North America Crosslinkers Market Revenue (Million), by Application 2024 & 2032
- Figure 21: North America Crosslinkers Market Revenue Share (%), by Application 2024 & 2032
- Figure 22: North America Crosslinkers Market Revenue (Million), by Country 2024 & 2032
- Figure 23: North America Crosslinkers Market Revenue Share (%), by Country 2024 & 2032
- Figure 24: Europe Crosslinkers Market Revenue (Million), by Type 2024 & 2032
- Figure 25: Europe Crosslinkers Market Revenue Share (%), by Type 2024 & 2032
- Figure 26: Europe Crosslinkers Market Revenue (Million), by Application 2024 & 2032
- Figure 27: Europe Crosslinkers Market Revenue Share (%), by Application 2024 & 2032
- Figure 28: Europe Crosslinkers Market Revenue (Million), by Country 2024 & 2032
- Figure 29: Europe Crosslinkers Market Revenue Share (%), by Country 2024 & 2032
- Figure 30: South America Crosslinkers Market Revenue (Million), by Type 2024 & 2032
- Figure 31: South America Crosslinkers Market Revenue Share (%), by Type 2024 & 2032
- Figure 32: South America Crosslinkers Market Revenue (Million), by Application 2024 & 2032
- Figure 33: South America Crosslinkers Market Revenue Share (%), by Application 2024 & 2032
- Figure 34: South America Crosslinkers Market Revenue (Million), by Country 2024 & 2032
- Figure 35: South America Crosslinkers Market Revenue Share (%), by Country 2024 & 2032
- Figure 36: Middle East and Africa Crosslinkers Market Revenue (Million), by Type 2024 & 2032
- Figure 37: Middle East and Africa Crosslinkers Market Revenue Share (%), by Type 2024 & 2032
- Figure 38: Middle East and Africa Crosslinkers Market Revenue (Million), by Application 2024 & 2032
- Figure 39: Middle East and Africa Crosslinkers Market Revenue Share (%), by Application 2024 & 2032
- Figure 40: Middle East and Africa Crosslinkers Market Revenue (Million), by Country 2024 & 2032
- Figure 41: Middle East and Africa Crosslinkers Market Revenue Share (%), by Country 2024 & 2032
List of Tables
- Table 1: Global Crosslinkers Market Revenue Million Forecast, by Region 2019 & 2032
- Table 2: Global Crosslinkers Market Revenue Million Forecast, by Type 2019 & 2032
- Table 3: Global Crosslinkers Market Revenue Million Forecast, by Application 2019 & 2032
- Table 4: Global Crosslinkers Market Revenue Million Forecast, by Region 2019 & 2032
- Table 5: Global Crosslinkers Market Revenue Million Forecast, by Country 2019 & 2032
- Table 6: China Crosslinkers Market Revenue (Million) Forecast, by Application 2019 & 2032
- Table 7: India Crosslinkers Market Revenue (Million) Forecast, by Application 2019 & 2032
- Table 8: Japan Crosslinkers Market Revenue (Million) Forecast, by Application 2019 & 2032
- Table 9: South Korea Crosslinkers Market Revenue (Million) Forecast, by Application 2019 & 2032
- Table 10: Rest of Asia Pacific Crosslinkers Market Revenue (Million) Forecast, by Application 2019 & 2032
- Table 11: Global Crosslinkers Market Revenue Million Forecast, by Country 2019 & 2032
- Table 12: United States Crosslinkers Market Revenue (Million) Forecast, by Application 2019 & 2032
- Table 13: Canada Crosslinkers Market Revenue (Million) Forecast, by Application 2019 & 2032
- Table 14: Mexico Crosslinkers Market Revenue (Million) Forecast, by Application 2019 & 2032
- Table 15: Global Crosslinkers Market Revenue Million Forecast, by Country 2019 & 2032
- Table 16: Germany Crosslinkers Market Revenue (Million) Forecast, by Application 2019 & 2032
- Table 17: United Kingdom Crosslinkers Market Revenue (Million) Forecast, by Application 2019 & 2032
- Table 18: France Crosslinkers Market Revenue (Million) Forecast, by Application 2019 & 2032
- Table 19: Italy Crosslinkers Market Revenue (Million) Forecast, by Application 2019 & 2032
- Table 20: Rest of Europe Crosslinkers Market Revenue (Million) Forecast, by Application 2019 & 2032
- Table 21: Global Crosslinkers Market Revenue Million Forecast, by Country 2019 & 2032
- Table 22: Brazil Crosslinkers Market Revenue (Million) Forecast, by Application 2019 & 2032
- Table 23: Argentina Crosslinkers Market Revenue (Million) Forecast, by Application 2019 & 2032
- Table 24: Rest of South America Crosslinkers Market Revenue (Million) Forecast, by Application 2019 & 2032
- Table 25: Global Crosslinkers Market Revenue Million Forecast, by Country 2019 & 2032
- Table 26: Saudi Arabia Crosslinkers Market Revenue (Million) Forecast, by Application 2019 & 2032
- Table 27: South Africa Crosslinkers Market Revenue (Million) Forecast, by Application 2019 & 2032
- Table 28: Rest of Middle East and Africa Crosslinkers Market Revenue (Million) Forecast, by Application 2019 & 2032
- Table 29: Global Crosslinkers Market Revenue Million Forecast, by Type 2019 & 2032
- Table 30: Global Crosslinkers Market Revenue Million Forecast, by Application 2019 & 2032
- Table 31: Global Crosslinkers Market Revenue Million Forecast, by Country 2019 & 2032
- Table 32: China Crosslinkers Market Revenue (Million) Forecast, by Application 2019 & 2032
- Table 33: India Crosslinkers Market Revenue (Million) Forecast, by Application 2019 & 2032
- Table 34: Japan Crosslinkers Market Revenue (Million) Forecast, by Application 2019 & 2032
- Table 35: South Korea Crosslinkers Market Revenue (Million) Forecast, by Application 2019 & 2032
- Table 36: Rest of Asia Pacific Crosslinkers Market Revenue (Million) Forecast, by Application 2019 & 2032
- Table 37: Global Crosslinkers Market Revenue Million Forecast, by Type 2019 & 2032
- Table 38: Global Crosslinkers Market Revenue Million Forecast, by Application 2019 & 2032
- Table 39: Global Crosslinkers Market Revenue Million Forecast, by Country 2019 & 2032
- Table 40: United States Crosslinkers Market Revenue (Million) Forecast, by Application 2019 & 2032
- Table 41: Canada Crosslinkers Market Revenue (Million) Forecast, by Application 2019 & 2032
- Table 42: Mexico Crosslinkers Market Revenue (Million) Forecast, by Application 2019 & 2032
- Table 43: Global Crosslinkers Market Revenue Million Forecast, by Type 2019 & 2032
- Table 44: Global Crosslinkers Market Revenue Million Forecast, by Application 2019 & 2032
- Table 45: Global Crosslinkers Market Revenue Million Forecast, by Country 2019 & 2032
- Table 46: Germany Crosslinkers Market Revenue (Million) Forecast, by Application 2019 & 2032
- Table 47: United Kingdom Crosslinkers Market Revenue (Million) Forecast, by Application 2019 & 2032
- Table 48: France Crosslinkers Market Revenue (Million) Forecast, by Application 2019 & 2032
- Table 49: Italy Crosslinkers Market Revenue (Million) Forecast, by Application 2019 & 2032
- Table 50: Rest of Europe Crosslinkers Market Revenue (Million) Forecast, by Application 2019 & 2032
- Table 51: Global Crosslinkers Market Revenue Million Forecast, by Type 2019 & 2032
- Table 52: Global Crosslinkers Market Revenue Million Forecast, by Application 2019 & 2032
- Table 53: Global Crosslinkers Market Revenue Million Forecast, by Country 2019 & 2032
- Table 54: Brazil Crosslinkers Market Revenue (Million) Forecast, by Application 2019 & 2032
- Table 55: Argentina Crosslinkers Market Revenue (Million) Forecast, by Application 2019 & 2032
- Table 56: Rest of South America Crosslinkers Market Revenue (Million) Forecast, by Application 2019 & 2032
- Table 57: Global Crosslinkers Market Revenue Million Forecast, by Type 2019 & 2032
- Table 58: Global Crosslinkers Market Revenue Million Forecast, by Application 2019 & 2032
- Table 59: Global Crosslinkers Market Revenue Million Forecast, by Country 2019 & 2032
- Table 60: Saudi Arabia Crosslinkers Market Revenue (Million) Forecast, by Application 2019 & 2032
- Table 61: South Africa Crosslinkers Market Revenue (Million) Forecast, by Application 2019 & 2032
- Table 62: Rest of Middle East and Africa Crosslinkers Market Revenue (Million) Forecast, by Application 2019 & 2032
Frequently Asked Questions
1. What is the projected Compound Annual Growth Rate (CAGR) of the Crosslinkers Market?
The projected CAGR is approximately 5.26%.
2. Which companies are prominent players in the Crosslinkers Market?
Key companies in the market include Mitsubishi Chemical Corporation, Evonik Industries AG, Wanhua Chemical Group Co Ltd, BASF SE, Huntsman International LLC, Dow, Aditya Birla Chemicals, KUMHO P&B CHEMICALS INC *List Not Exhaustive, Allnex GMBH, Hexion, NIPPON SHOKUBAI CO LTD, Covestro AG, Nisshinbo Chemical Inc.
3. What are the main segments of the Crosslinkers Market?
The market segments include Type, Application.
4. Can you provide details about the market size?
The market size is estimated to be USD 7.26 Million as of 2022.
5. What are some drivers contributing to market growth?
Increasing Demad for Numerous Coatings; Increasing Focus on High-Performance Crosslinking Agents.
6. What are the notable trends driving market growth?
Increasing Demand for Decorative Coatings.
7. Are there any restraints impacting market growth?
Presence of Self-Crosslinking Agents.
8. Can you provide examples of recent developments in the market?
In February 2022, Hexion completed the sale of its epoxy-based Coatings and Composite businesses, which includes the epoxy specialty resins and base epoxy resins and intermediates product lines for around USD 1.2 billion to Westlake Chemical Corporation.
9. What pricing options are available for accessing the report?
Pricing options include single-user, multi-user, and enterprise licenses priced at USD 4750, USD 5250, and USD 8750 respectively.
10. Is the market size provided in terms of value or volume?
The market size is provided in terms of value, measured in Million.
11. Are there any specific market keywords associated with the report?
Yes, the market keyword associated with the report is "Crosslinkers Market," which aids in identifying and referencing the specific market segment covered.
12. How do I determine which pricing option suits my needs best?
The pricing options vary based on user requirements and access needs. Individual users may opt for single-user licenses, while businesses requiring broader access may choose multi-user or enterprise licenses for cost-effective access to the report.
13. Are there any additional resources or data provided in the Crosslinkers Market report?
While the report offers comprehensive insights, it's advisable to review the specific contents or supplementary materials provided to ascertain if additional resources or data are available.
14. How can I stay updated on further developments or reports in the Crosslinkers Market?
To stay informed about further developments, trends, and reports in the Crosslinkers Market, consider subscribing to industry newsletters, following relevant companies and organizations, or regularly checking reputable industry news sources and publications.
Methodology
Step 1 - Identification of Relevant Samples Size from Population Database


Step 2 - Approaches for Defining Global Market Size (Value, Volume* & Price*)

Note*: In applicable scenarios
Step 3 - Data Sources
Primary Research
- Web Analytics
- Survey Reports
- Research Institute
- Latest Research Reports
- Opinion Leaders
Secondary Research
- Annual Reports
- White Paper
- Latest Press Release
- Industry Association
- Paid Database
- Investor Presentations

Step 4 - Data Triangulation
Involves using different sources of information in order to increase the validity of a study
These sources are likely to be stakeholders in a program - participants, other researchers, program staff, other community members, and so on.
Then we put all data in single framework & apply various statistical tools to find out the dynamic on the market.
During the analysis stage, feedback from the stakeholder groups would be compared to determine areas of agreement as well as areas of divergence
