

Key Insights
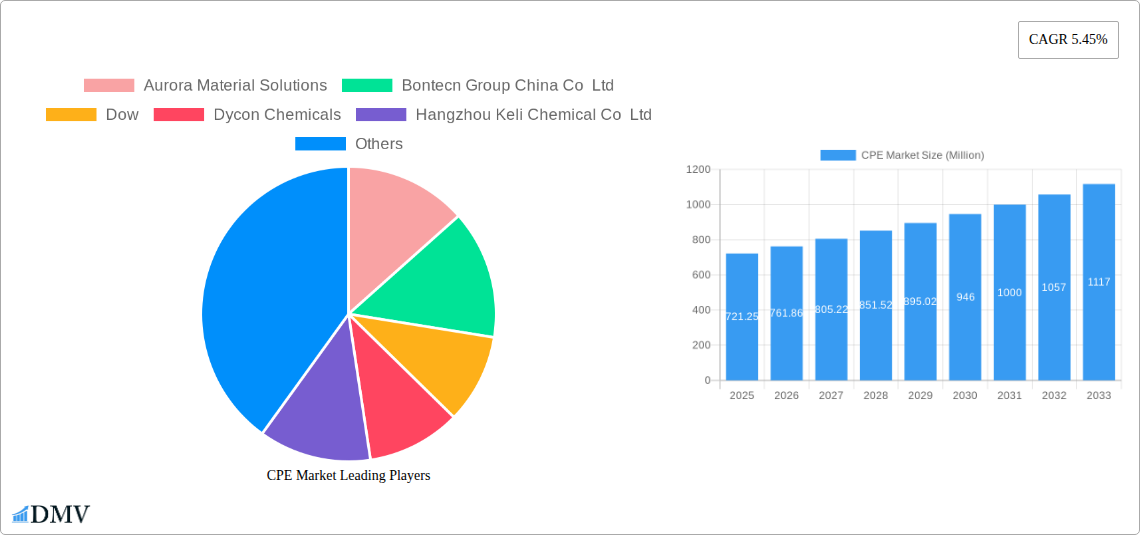
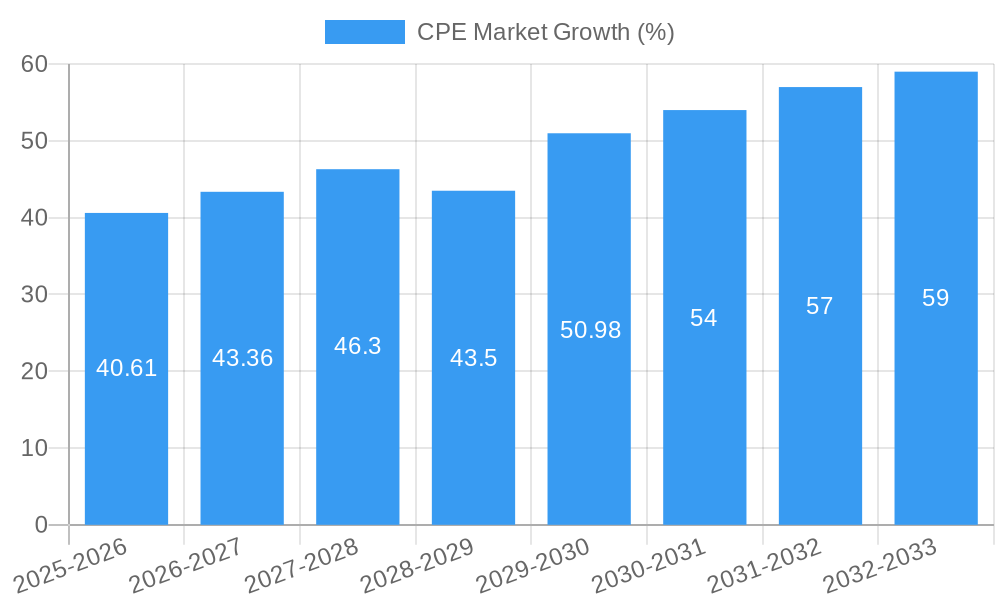
The Chlorinated Polyethylene (CPE) market, valued at $721.25 million in 2025, is projected to experience robust growth, driven by increasing demand from diverse sectors like wire and cable, automotive, and construction. A Compound Annual Growth Rate (CAGR) of 5.45% from 2025 to 2033 indicates a significant expansion of the market. Key drivers include the CPE's excellent weather resistance, flexibility, and chemical inertness, making it a preferred material for applications requiring durability and longevity. Furthermore, the growing adoption of sustainable and eco-friendly materials is indirectly boosting the demand for CPE, as it offers an alternative to less environmentally sound materials in various applications. However, the market faces certain restraints, primarily fluctuations in raw material prices (chlorine and polyethylene) and stringent environmental regulations related to chlorinated polymers. Nevertheless, continuous innovations in CPE formulations and the exploration of new applications in emerging sectors like packaging and oil & gas are expected to counterbalance these challenges, ensuring sustained market growth throughout the forecast period.
The competitive landscape is characterized by a mix of established players and regional manufacturers. Companies such as Dow, Resonac Holdings Corporation, and several significant Chinese manufacturers play a crucial role in shaping market dynamics. The competitive intensity is likely to increase with continued innovations and strategic partnerships aimed at expanding market share and exploring new geographical territories. The geographical distribution of the market likely shows strong presence in regions with established manufacturing hubs and high demand for CPE-based products. Further market segmentation data, while not provided, would likely reveal variations in growth rates across different CPE types (e.g., based on chlorine content and molecular weight), further highlighting the complexity and dynamism of this expanding market. Future growth will be significantly influenced by technological advancements that improve CPE's performance characteristics and reduce its environmental footprint.
CPE Market: A Comprehensive Report (2019-2033)
This insightful report provides a detailed analysis of the Chlorinated Polyethylene (CPE) market, offering a comprehensive overview of its current state, future trajectory, and key players. With a study period spanning 2019-2033, a base year of 2025, and a forecast period of 2025-2033, this report is an essential resource for stakeholders seeking to understand and capitalize on the opportunities within this dynamic market. The report's value is further enhanced by its incorporation of real-world data and recent industry developments, including the significant acquisition by Aurora Plastics LLC. The global CPE market is projected to reach xx Million by 2033.
CPE Market Composition & Trends
This section delves into the intricate landscape of the CPE market, examining market concentration, innovation drivers, regulatory frameworks, substitute products, end-user profiles, and mergers & acquisitions (M&A) activities. We analyze market share distribution amongst key players, revealing the competitive dynamics at play. The analysis also highlights the impact of recent M&A activities, such as the May 2024 acquisition of EnCom Polymers Inc. by Aurora Plastics LLC, which significantly expanded Aurora's CPE product portfolio. The total value of M&A deals within the CPE market during the historical period (2019-2024) is estimated at xx Million.
- Market Concentration: A detailed analysis of market share distribution among key players, including Dow, Resonac Holdings Corporation, and others.
- Innovation Catalysts: Examination of technological advancements driving market innovation and growth.
- Regulatory Landscape: Assessment of regulatory impacts on market growth and player strategies.
- Substitute Products: Analysis of substitute materials and their influence on market competition.
- End-User Profiles: Profiling of key end-use sectors and their consumption patterns.
- M&A Activities: Detailed analysis of significant M&A deals and their implications for market consolidation.
CPE Market Industry Evolution
This section meticulously analyzes the evolution of the CPE market, tracing its growth trajectories, technological advancements, and the shifting demands of consumers. We provide specific data points, including growth rates and adoption metrics, to illustrate the market's dynamic nature. The analysis spans the historical period (2019-2024), the base year (2025), and the forecast period (2025-2033), offering a comprehensive view of past performance and future projections. The CPE market is expected to demonstrate a CAGR of xx% during the forecast period, driven by factors such as increasing demand from key end-use industries and ongoing technological advancements. Specific examples of technological advancements, such as the development of new CPE formulations with improved properties, will be discussed. This section also incorporates analyses of changing consumer preferences and how they influence the demand for different types of CPE products.
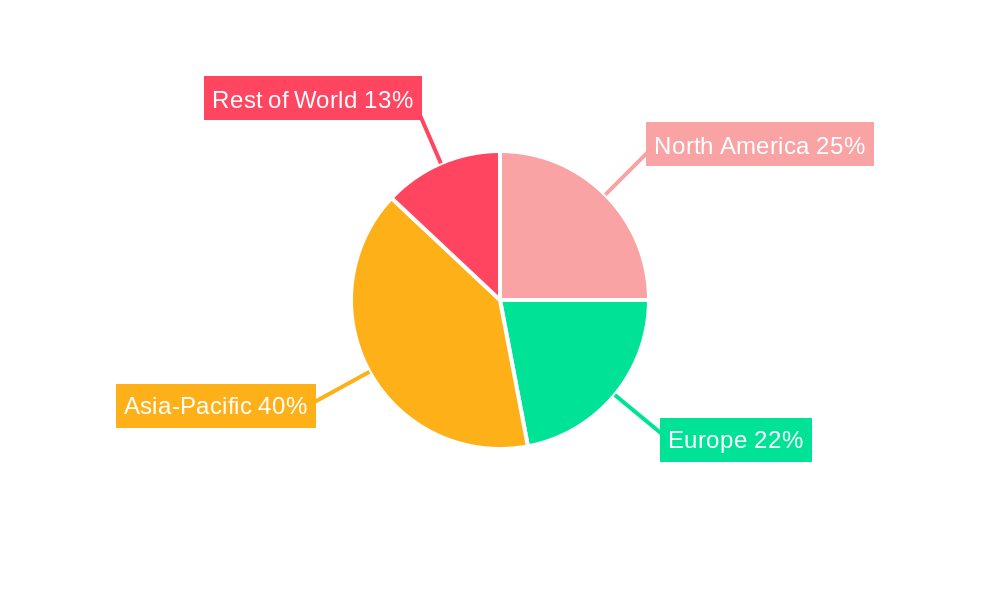
Leading Regions, Countries, or Segments in CPE Market
This section identifies the dominant regions, countries, or segments within the CPE market. A comprehensive analysis pinpoints the factors contributing to their leadership. The analysis uses a combination of detailed paragraphs and bullet points for clarity and conciseness.
- Key Drivers in the Dominant Region/Segment:
- Favorable government policies and investment incentives.
- Strong presence of major CPE manufacturers and suppliers.
- High demand from key end-use industries.
- Robust infrastructure and logistics networks.
[Detailed analysis of the dominance factors for the leading region/segment, including market size, growth rate, and key industry trends.]
CPE Market Product Innovations
This section highlights recent product innovations in the CPE market, focusing on novel applications and improved performance metrics. We showcase unique selling propositions and the technological advancements behind these innovations, underscoring their impact on market competitiveness and growth. Examples of new CPE products with enhanced properties, such as improved flexibility, durability, and chemical resistance, are discussed, along with their corresponding applications in various industries.
Propelling Factors for CPE Market Growth
This section outlines the key factors driving the growth of the CPE market. The drivers are categorized into technological, economic, and regulatory influences, with specific examples illustrating their impact. The increasing demand for CPE from various industries, such as automotive and construction, is highlighted. The section also touches upon government regulations promoting sustainable materials and their effect on market expansion. Furthermore, the analysis explores how advancements in CPE production technologies are contributing to increased efficiency and reduced costs.
Obstacles in the CPE Market Market
This section identifies and analyzes the challenges and restraints impacting the CPE market. These include regulatory hurdles, supply chain vulnerabilities, and competitive pressures. We quantify the impact of these obstacles on market growth whenever possible. For instance, the analysis examines the potential effects of raw material price fluctuations and their influence on production costs. The section also considers the challenges of meeting evolving environmental regulations and their potential to curb market expansion.
Future Opportunities in CPE Market
This section explores potential opportunities for growth within the CPE market, focusing on emerging markets, technological advancements, and evolving consumer trends. Opportunities include expanding into new geographic regions and developing innovative CPE applications in sectors like renewable energy and medical devices. The analysis also includes the potential for partnerships and collaborations to accelerate technological advancements and market expansion.
Major Players in the CPE Market Ecosystem
- Aurora Material Solutions
- Bontecn Group China Co Ltd
- Dow (Dow)
- Dycon Chemicals
- Hangzhou Keli Chemical Co Ltd
- Jiangsu Tianteng Chemical Industry Co Ltd
- Resonac Holdings Corporation (Resonac)
- Shandong Gaoxin Chemical Co Ltd
- Shandong Ketian Chemical Co Ltd
- Shandong Novista Chemical Ltd (Novista Group)
- Shandong Xiangsheng New Materials Technology Co Ltd
- Shandong Xuye New Materials Co Ltd
- Sundow Polymers Co Ltd
- Weifang Yaxing Chemical Co Ltd
- List Not Exhaustive
Key Developments in CPE Market Industry
- May 2024: Aurora Plastics LLC (Aurora) announced the acquisition of EnCom Polymers Inc., expanding its product offering to include chlorinated polyethylene alloys (CPE). This acquisition strengthened Aurora Plastics LLC's product portfolio.
Strategic CPE Market Market Forecast
This section summarizes the key growth catalysts identified throughout the report, focusing on the future potential of the CPE market. The forecast considers factors such as continuous technological advancements, the expansion into new applications, and the growing demand from various sectors. The report concludes by emphasizing the potential for significant market expansion in the coming years, driven by a combination of these factors.
CPE Market Segmentation
-
1. Product
- 1.1. CPE 135A
- 1.2. CPA 135B
- 1.3. Other Products
-
2. Application
- 2.1. Impact Modifier
- 2.2. Wire and Cable Jacketing
- 2.3. Hose and Tubing
- 2.4. Adhesives
- 2.5. Other Applications
CPE Market Segmentation By Geography
-
1. Asia Pacific
- 1.1. China
- 1.2. India
- 1.3. Japan
- 1.4. South Korea
- 1.5. Rest of Asia Pacific
-
2. North America
- 2.1. United States
- 2.2. Canada
- 2.3. Mexico
-
3. Europe
- 3.1. Germany
- 3.2. United Kingdom
- 3.3. France
- 3.4. Italy
- 3.5. Rest of Europe
-
4. South America
- 4.1. Brazil
- 4.2. Argentina
- 4.3. Rest of South America
-
5. Middle East and Africa
- 5.1. Saudi Arabia
- 5.2. South Africa
- 5.3. Rest of Middle East and Africa
CPE Market REPORT HIGHLIGHTS
| Aspects | Details |
|---|---|
| Study Period | 2019-2033 |
| Base Year | 2024 |
| Estimated Year | 2025 |
| Forecast Period | 2025-2033 |
| Historical Period | 2019-2024 |
| Growth Rate | CAGR of 5.45% from 2019-2033 |
| Segmentation |
|
Table of Contents
- 1. Introduction
- 1.1. Research Scope
- 1.2. Market Segmentation
- 1.3. Research Methodology
- 1.4. Definitions and Assumptions
- 2. Executive Summary
- 2.1. Introduction
- 3. Market Dynamics
- 3.1. Introduction
- 3.2. Market Drivers
- 3.2.1. Rising Demand for CPE-based Impact Modifiers in PVC Products; Growing Demand for CPE-based Hoses and Tubes in the Automotive Industry
- 3.3. Market Restrains
- 3.3.1. Rising Demand for CPE-based Impact Modifiers in PVC Products; Growing Demand for CPE-based Hoses and Tubes in the Automotive Industry
- 3.4. Market Trends
- 3.4.1. Impact Modifier is Expected to Dominate the Market
- 4. Market Factor Analysis
- 4.1. Porters Five Forces
- 4.2. Supply/Value Chain
- 4.3. PESTEL analysis
- 4.4. Market Entropy
- 4.5. Patent/Trademark Analysis
- 5. Global CPE Market Analysis, Insights and Forecast, 2019-2031
- 5.1. Market Analysis, Insights and Forecast - by Product
- 5.1.1. CPE 135A
- 5.1.2. CPA 135B
- 5.1.3. Other Products
- 5.2. Market Analysis, Insights and Forecast - by Application
- 5.2.1. Impact Modifier
- 5.2.2. Wire and Cable Jacketing
- 5.2.3. Hose and Tubing
- 5.2.4. Adhesives
- 5.2.5. Other Applications
- 5.3. Market Analysis, Insights and Forecast - by Region
- 5.3.1. Asia Pacific
- 5.3.2. North America
- 5.3.3. Europe
- 5.3.4. South America
- 5.3.5. Middle East and Africa
- 5.1. Market Analysis, Insights and Forecast - by Product
- 6. Asia Pacific CPE Market Analysis, Insights and Forecast, 2019-2031
- 6.1. Market Analysis, Insights and Forecast - by Product
- 6.1.1. CPE 135A
- 6.1.2. CPA 135B
- 6.1.3. Other Products
- 6.2. Market Analysis, Insights and Forecast - by Application
- 6.2.1. Impact Modifier
- 6.2.2. Wire and Cable Jacketing
- 6.2.3. Hose and Tubing
- 6.2.4. Adhesives
- 6.2.5. Other Applications
- 6.1. Market Analysis, Insights and Forecast - by Product
- 7. North America CPE Market Analysis, Insights and Forecast, 2019-2031
- 7.1. Market Analysis, Insights and Forecast - by Product
- 7.1.1. CPE 135A
- 7.1.2. CPA 135B
- 7.1.3. Other Products
- 7.2. Market Analysis, Insights and Forecast - by Application
- 7.2.1. Impact Modifier
- 7.2.2. Wire and Cable Jacketing
- 7.2.3. Hose and Tubing
- 7.2.4. Adhesives
- 7.2.5. Other Applications
- 7.1. Market Analysis, Insights and Forecast - by Product
- 8. Europe CPE Market Analysis, Insights and Forecast, 2019-2031
- 8.1. Market Analysis, Insights and Forecast - by Product
- 8.1.1. CPE 135A
- 8.1.2. CPA 135B
- 8.1.3. Other Products
- 8.2. Market Analysis, Insights and Forecast - by Application
- 8.2.1. Impact Modifier
- 8.2.2. Wire and Cable Jacketing
- 8.2.3. Hose and Tubing
- 8.2.4. Adhesives
- 8.2.5. Other Applications
- 8.1. Market Analysis, Insights and Forecast - by Product
- 9. South America CPE Market Analysis, Insights and Forecast, 2019-2031
- 9.1. Market Analysis, Insights and Forecast - by Product
- 9.1.1. CPE 135A
- 9.1.2. CPA 135B
- 9.1.3. Other Products
- 9.2. Market Analysis, Insights and Forecast - by Application
- 9.2.1. Impact Modifier
- 9.2.2. Wire and Cable Jacketing
- 9.2.3. Hose and Tubing
- 9.2.4. Adhesives
- 9.2.5. Other Applications
- 9.1. Market Analysis, Insights and Forecast - by Product
- 10. Middle East and Africa CPE Market Analysis, Insights and Forecast, 2019-2031
- 10.1. Market Analysis, Insights and Forecast - by Product
- 10.1.1. CPE 135A
- 10.1.2. CPA 135B
- 10.1.3. Other Products
- 10.2. Market Analysis, Insights and Forecast - by Application
- 10.2.1. Impact Modifier
- 10.2.2. Wire and Cable Jacketing
- 10.2.3. Hose and Tubing
- 10.2.4. Adhesives
- 10.2.5. Other Applications
- 10.1. Market Analysis, Insights and Forecast - by Product
- 11. Competitive Analysis
- 11.1. Global Market Share Analysis 2024
- 11.2. Company Profiles
- 11.2.1 Aurora Material Solutions
- 11.2.1.1. Overview
- 11.2.1.2. Products
- 11.2.1.3. SWOT Analysis
- 11.2.1.4. Recent Developments
- 11.2.1.5. Financials (Based on Availability)
- 11.2.2 Bontecn Group China Co Ltd
- 11.2.2.1. Overview
- 11.2.2.2. Products
- 11.2.2.3. SWOT Analysis
- 11.2.2.4. Recent Developments
- 11.2.2.5. Financials (Based on Availability)
- 11.2.3 Dow
- 11.2.3.1. Overview
- 11.2.3.2. Products
- 11.2.3.3. SWOT Analysis
- 11.2.3.4. Recent Developments
- 11.2.3.5. Financials (Based on Availability)
- 11.2.4 Dycon Chemicals
- 11.2.4.1. Overview
- 11.2.4.2. Products
- 11.2.4.3. SWOT Analysis
- 11.2.4.4. Recent Developments
- 11.2.4.5. Financials (Based on Availability)
- 11.2.5 Hangzhou Keli Chemical Co Ltd
- 11.2.5.1. Overview
- 11.2.5.2. Products
- 11.2.5.3. SWOT Analysis
- 11.2.5.4. Recent Developments
- 11.2.5.5. Financials (Based on Availability)
- 11.2.6 Jiangsu Tianteng Chemical Industry Co Ltd
- 11.2.6.1. Overview
- 11.2.6.2. Products
- 11.2.6.3. SWOT Analysis
- 11.2.6.4. Recent Developments
- 11.2.6.5. Financials (Based on Availability)
- 11.2.7 Resonac Holdings Corporation
- 11.2.7.1. Overview
- 11.2.7.2. Products
- 11.2.7.3. SWOT Analysis
- 11.2.7.4. Recent Developments
- 11.2.7.5. Financials (Based on Availability)
- 11.2.8 Shandong Gaoxin Chemical Co Ltd
- 11.2.8.1. Overview
- 11.2.8.2. Products
- 11.2.8.3. SWOT Analysis
- 11.2.8.4. Recent Developments
- 11.2.8.5. Financials (Based on Availability)
- 11.2.9 Shandong Ketian Chemical Co Ltd
- 11.2.9.1. Overview
- 11.2.9.2. Products
- 11.2.9.3. SWOT Analysis
- 11.2.9.4. Recent Developments
- 11.2.9.5. Financials (Based on Availability)
- 11.2.10 Shandong Novista Chemical Ltd (Novista Group)
- 11.2.10.1. Overview
- 11.2.10.2. Products
- 11.2.10.3. SWOT Analysis
- 11.2.10.4. Recent Developments
- 11.2.10.5. Financials (Based on Availability)
- 11.2.11 Shandong Xiangsheng New Materials Technology Co Ltd
- 11.2.11.1. Overview
- 11.2.11.2. Products
- 11.2.11.3. SWOT Analysis
- 11.2.11.4. Recent Developments
- 11.2.11.5. Financials (Based on Availability)
- 11.2.12 Shandong Xuye New Materials Co Ltd
- 11.2.12.1. Overview
- 11.2.12.2. Products
- 11.2.12.3. SWOT Analysis
- 11.2.12.4. Recent Developments
- 11.2.12.5. Financials (Based on Availability)
- 11.2.13 Sundow Polymers Co Ltd
- 11.2.13.1. Overview
- 11.2.13.2. Products
- 11.2.13.3. SWOT Analysis
- 11.2.13.4. Recent Developments
- 11.2.13.5. Financials (Based on Availability)
- 11.2.14 Weifang Yaxing Chemical Co Ltd*List Not Exhaustive
- 11.2.14.1. Overview
- 11.2.14.2. Products
- 11.2.14.3. SWOT Analysis
- 11.2.14.4. Recent Developments
- 11.2.14.5. Financials (Based on Availability)
- 11.2.1 Aurora Material Solutions
List of Figures
- Figure 1: Global CPE Market Revenue Breakdown (Million, %) by Region 2024 & 2032
- Figure 2: Global CPE Market Volume Breakdown (Million, %) by Region 2024 & 2032
- Figure 3: Asia Pacific CPE Market Revenue (Million), by Product 2024 & 2032
- Figure 4: Asia Pacific CPE Market Volume (Million), by Product 2024 & 2032
- Figure 5: Asia Pacific CPE Market Revenue Share (%), by Product 2024 & 2032
- Figure 6: Asia Pacific CPE Market Volume Share (%), by Product 2024 & 2032
- Figure 7: Asia Pacific CPE Market Revenue (Million), by Application 2024 & 2032
- Figure 8: Asia Pacific CPE Market Volume (Million), by Application 2024 & 2032
- Figure 9: Asia Pacific CPE Market Revenue Share (%), by Application 2024 & 2032
- Figure 10: Asia Pacific CPE Market Volume Share (%), by Application 2024 & 2032
- Figure 11: Asia Pacific CPE Market Revenue (Million), by Country 2024 & 2032
- Figure 12: Asia Pacific CPE Market Volume (Million), by Country 2024 & 2032
- Figure 13: Asia Pacific CPE Market Revenue Share (%), by Country 2024 & 2032
- Figure 14: Asia Pacific CPE Market Volume Share (%), by Country 2024 & 2032
- Figure 15: North America CPE Market Revenue (Million), by Product 2024 & 2032
- Figure 16: North America CPE Market Volume (Million), by Product 2024 & 2032
- Figure 17: North America CPE Market Revenue Share (%), by Product 2024 & 2032
- Figure 18: North America CPE Market Volume Share (%), by Product 2024 & 2032
- Figure 19: North America CPE Market Revenue (Million), by Application 2024 & 2032
- Figure 20: North America CPE Market Volume (Million), by Application 2024 & 2032
- Figure 21: North America CPE Market Revenue Share (%), by Application 2024 & 2032
- Figure 22: North America CPE Market Volume Share (%), by Application 2024 & 2032
- Figure 23: North America CPE Market Revenue (Million), by Country 2024 & 2032
- Figure 24: North America CPE Market Volume (Million), by Country 2024 & 2032
- Figure 25: North America CPE Market Revenue Share (%), by Country 2024 & 2032
- Figure 26: North America CPE Market Volume Share (%), by Country 2024 & 2032
- Figure 27: Europe CPE Market Revenue (Million), by Product 2024 & 2032
- Figure 28: Europe CPE Market Volume (Million), by Product 2024 & 2032
- Figure 29: Europe CPE Market Revenue Share (%), by Product 2024 & 2032
- Figure 30: Europe CPE Market Volume Share (%), by Product 2024 & 2032
- Figure 31: Europe CPE Market Revenue (Million), by Application 2024 & 2032
- Figure 32: Europe CPE Market Volume (Million), by Application 2024 & 2032
- Figure 33: Europe CPE Market Revenue Share (%), by Application 2024 & 2032
- Figure 34: Europe CPE Market Volume Share (%), by Application 2024 & 2032
- Figure 35: Europe CPE Market Revenue (Million), by Country 2024 & 2032
- Figure 36: Europe CPE Market Volume (Million), by Country 2024 & 2032
- Figure 37: Europe CPE Market Revenue Share (%), by Country 2024 & 2032
- Figure 38: Europe CPE Market Volume Share (%), by Country 2024 & 2032
- Figure 39: South America CPE Market Revenue (Million), by Product 2024 & 2032
- Figure 40: South America CPE Market Volume (Million), by Product 2024 & 2032
- Figure 41: South America CPE Market Revenue Share (%), by Product 2024 & 2032
- Figure 42: South America CPE Market Volume Share (%), by Product 2024 & 2032
- Figure 43: South America CPE Market Revenue (Million), by Application 2024 & 2032
- Figure 44: South America CPE Market Volume (Million), by Application 2024 & 2032
- Figure 45: South America CPE Market Revenue Share (%), by Application 2024 & 2032
- Figure 46: South America CPE Market Volume Share (%), by Application 2024 & 2032
- Figure 47: South America CPE Market Revenue (Million), by Country 2024 & 2032
- Figure 48: South America CPE Market Volume (Million), by Country 2024 & 2032
- Figure 49: South America CPE Market Revenue Share (%), by Country 2024 & 2032
- Figure 50: South America CPE Market Volume Share (%), by Country 2024 & 2032
- Figure 51: Middle East and Africa CPE Market Revenue (Million), by Product 2024 & 2032
- Figure 52: Middle East and Africa CPE Market Volume (Million), by Product 2024 & 2032
- Figure 53: Middle East and Africa CPE Market Revenue Share (%), by Product 2024 & 2032
- Figure 54: Middle East and Africa CPE Market Volume Share (%), by Product 2024 & 2032
- Figure 55: Middle East and Africa CPE Market Revenue (Million), by Application 2024 & 2032
- Figure 56: Middle East and Africa CPE Market Volume (Million), by Application 2024 & 2032
- Figure 57: Middle East and Africa CPE Market Revenue Share (%), by Application 2024 & 2032
- Figure 58: Middle East and Africa CPE Market Volume Share (%), by Application 2024 & 2032
- Figure 59: Middle East and Africa CPE Market Revenue (Million), by Country 2024 & 2032
- Figure 60: Middle East and Africa CPE Market Volume (Million), by Country 2024 & 2032
- Figure 61: Middle East and Africa CPE Market Revenue Share (%), by Country 2024 & 2032
- Figure 62: Middle East and Africa CPE Market Volume Share (%), by Country 2024 & 2032
List of Tables
- Table 1: Global CPE Market Revenue Million Forecast, by Region 2019 & 2032
- Table 2: Global CPE Market Volume Million Forecast, by Region 2019 & 2032
- Table 3: Global CPE Market Revenue Million Forecast, by Product 2019 & 2032
- Table 4: Global CPE Market Volume Million Forecast, by Product 2019 & 2032
- Table 5: Global CPE Market Revenue Million Forecast, by Application 2019 & 2032
- Table 6: Global CPE Market Volume Million Forecast, by Application 2019 & 2032
- Table 7: Global CPE Market Revenue Million Forecast, by Region 2019 & 2032
- Table 8: Global CPE Market Volume Million Forecast, by Region 2019 & 2032
- Table 9: Global CPE Market Revenue Million Forecast, by Product 2019 & 2032
- Table 10: Global CPE Market Volume Million Forecast, by Product 2019 & 2032
- Table 11: Global CPE Market Revenue Million Forecast, by Application 2019 & 2032
- Table 12: Global CPE Market Volume Million Forecast, by Application 2019 & 2032
- Table 13: Global CPE Market Revenue Million Forecast, by Country 2019 & 2032
- Table 14: Global CPE Market Volume Million Forecast, by Country 2019 & 2032
- Table 15: China CPE Market Revenue (Million) Forecast, by Application 2019 & 2032
- Table 16: China CPE Market Volume (Million) Forecast, by Application 2019 & 2032
- Table 17: India CPE Market Revenue (Million) Forecast, by Application 2019 & 2032
- Table 18: India CPE Market Volume (Million) Forecast, by Application 2019 & 2032
- Table 19: Japan CPE Market Revenue (Million) Forecast, by Application 2019 & 2032
- Table 20: Japan CPE Market Volume (Million) Forecast, by Application 2019 & 2032
- Table 21: South Korea CPE Market Revenue (Million) Forecast, by Application 2019 & 2032
- Table 22: South Korea CPE Market Volume (Million) Forecast, by Application 2019 & 2032
- Table 23: Rest of Asia Pacific CPE Market Revenue (Million) Forecast, by Application 2019 & 2032
- Table 24: Rest of Asia Pacific CPE Market Volume (Million) Forecast, by Application 2019 & 2032
- Table 25: Global CPE Market Revenue Million Forecast, by Product 2019 & 2032
- Table 26: Global CPE Market Volume Million Forecast, by Product 2019 & 2032
- Table 27: Global CPE Market Revenue Million Forecast, by Application 2019 & 2032
- Table 28: Global CPE Market Volume Million Forecast, by Application 2019 & 2032
- Table 29: Global CPE Market Revenue Million Forecast, by Country 2019 & 2032
- Table 30: Global CPE Market Volume Million Forecast, by Country 2019 & 2032
- Table 31: United States CPE Market Revenue (Million) Forecast, by Application 2019 & 2032
- Table 32: United States CPE Market Volume (Million) Forecast, by Application 2019 & 2032
- Table 33: Canada CPE Market Revenue (Million) Forecast, by Application 2019 & 2032
- Table 34: Canada CPE Market Volume (Million) Forecast, by Application 2019 & 2032
- Table 35: Mexico CPE Market Revenue (Million) Forecast, by Application 2019 & 2032
- Table 36: Mexico CPE Market Volume (Million) Forecast, by Application 2019 & 2032
- Table 37: Global CPE Market Revenue Million Forecast, by Product 2019 & 2032
- Table 38: Global CPE Market Volume Million Forecast, by Product 2019 & 2032
- Table 39: Global CPE Market Revenue Million Forecast, by Application 2019 & 2032
- Table 40: Global CPE Market Volume Million Forecast, by Application 2019 & 2032
- Table 41: Global CPE Market Revenue Million Forecast, by Country 2019 & 2032
- Table 42: Global CPE Market Volume Million Forecast, by Country 2019 & 2032
- Table 43: Germany CPE Market Revenue (Million) Forecast, by Application 2019 & 2032
- Table 44: Germany CPE Market Volume (Million) Forecast, by Application 2019 & 2032
- Table 45: United Kingdom CPE Market Revenue (Million) Forecast, by Application 2019 & 2032
- Table 46: United Kingdom CPE Market Volume (Million) Forecast, by Application 2019 & 2032
- Table 47: France CPE Market Revenue (Million) Forecast, by Application 2019 & 2032
- Table 48: France CPE Market Volume (Million) Forecast, by Application 2019 & 2032
- Table 49: Italy CPE Market Revenue (Million) Forecast, by Application 2019 & 2032
- Table 50: Italy CPE Market Volume (Million) Forecast, by Application 2019 & 2032
- Table 51: Rest of Europe CPE Market Revenue (Million) Forecast, by Application 2019 & 2032
- Table 52: Rest of Europe CPE Market Volume (Million) Forecast, by Application 2019 & 2032
- Table 53: Global CPE Market Revenue Million Forecast, by Product 2019 & 2032
- Table 54: Global CPE Market Volume Million Forecast, by Product 2019 & 2032
- Table 55: Global CPE Market Revenue Million Forecast, by Application 2019 & 2032
- Table 56: Global CPE Market Volume Million Forecast, by Application 2019 & 2032
- Table 57: Global CPE Market Revenue Million Forecast, by Country 2019 & 2032
- Table 58: Global CPE Market Volume Million Forecast, by Country 2019 & 2032
- Table 59: Brazil CPE Market Revenue (Million) Forecast, by Application 2019 & 2032
- Table 60: Brazil CPE Market Volume (Million) Forecast, by Application 2019 & 2032
- Table 61: Argentina CPE Market Revenue (Million) Forecast, by Application 2019 & 2032
- Table 62: Argentina CPE Market Volume (Million) Forecast, by Application 2019 & 2032
- Table 63: Rest of South America CPE Market Revenue (Million) Forecast, by Application 2019 & 2032
- Table 64: Rest of South America CPE Market Volume (Million) Forecast, by Application 2019 & 2032
- Table 65: Global CPE Market Revenue Million Forecast, by Product 2019 & 2032
- Table 66: Global CPE Market Volume Million Forecast, by Product 2019 & 2032
- Table 67: Global CPE Market Revenue Million Forecast, by Application 2019 & 2032
- Table 68: Global CPE Market Volume Million Forecast, by Application 2019 & 2032
- Table 69: Global CPE Market Revenue Million Forecast, by Country 2019 & 2032
- Table 70: Global CPE Market Volume Million Forecast, by Country 2019 & 2032
- Table 71: Saudi Arabia CPE Market Revenue (Million) Forecast, by Application 2019 & 2032
- Table 72: Saudi Arabia CPE Market Volume (Million) Forecast, by Application 2019 & 2032
- Table 73: South Africa CPE Market Revenue (Million) Forecast, by Application 2019 & 2032
- Table 74: South Africa CPE Market Volume (Million) Forecast, by Application 2019 & 2032
- Table 75: Rest of Middle East and Africa CPE Market Revenue (Million) Forecast, by Application 2019 & 2032
- Table 76: Rest of Middle East and Africa CPE Market Volume (Million) Forecast, by Application 2019 & 2032
Frequently Asked Questions
1. What is the projected Compound Annual Growth Rate (CAGR) of the CPE Market?
The projected CAGR is approximately 5.45%.
2. Which companies are prominent players in the CPE Market?
Key companies in the market include Aurora Material Solutions, Bontecn Group China Co Ltd, Dow, Dycon Chemicals, Hangzhou Keli Chemical Co Ltd, Jiangsu Tianteng Chemical Industry Co Ltd, Resonac Holdings Corporation, Shandong Gaoxin Chemical Co Ltd, Shandong Ketian Chemical Co Ltd, Shandong Novista Chemical Ltd (Novista Group), Shandong Xiangsheng New Materials Technology Co Ltd, Shandong Xuye New Materials Co Ltd, Sundow Polymers Co Ltd, Weifang Yaxing Chemical Co Ltd*List Not Exhaustive.
3. What are the main segments of the CPE Market?
The market segments include Product, Application.
4. Can you provide details about the market size?
The market size is estimated to be USD 721.25 Million as of 2022.
5. What are some drivers contributing to market growth?
Rising Demand for CPE-based Impact Modifiers in PVC Products; Growing Demand for CPE-based Hoses and Tubes in the Automotive Industry.
6. What are the notable trends driving market growth?
Impact Modifier is Expected to Dominate the Market.
7. Are there any restraints impacting market growth?
Rising Demand for CPE-based Impact Modifiers in PVC Products; Growing Demand for CPE-based Hoses and Tubes in the Automotive Industry.
8. Can you provide examples of recent developments in the market?
May 2024: Aurora Plastics LLC (Aurora) announced the acquisition of EnCom Polymers Inc., extending its product offering to include chlorinated polyethylene alloys (CPE). This acquisition strengthened Aurora Plastics LLC's product portfolio.
9. What pricing options are available for accessing the report?
Pricing options include single-user, multi-user, and enterprise licenses priced at USD 4750, USD 5250, and USD 8750 respectively.
10. Is the market size provided in terms of value or volume?
The market size is provided in terms of value, measured in Million and volume, measured in Million.
11. Are there any specific market keywords associated with the report?
Yes, the market keyword associated with the report is "CPE Market," which aids in identifying and referencing the specific market segment covered.
12. How do I determine which pricing option suits my needs best?
The pricing options vary based on user requirements and access needs. Individual users may opt for single-user licenses, while businesses requiring broader access may choose multi-user or enterprise licenses for cost-effective access to the report.
13. Are there any additional resources or data provided in the CPE Market report?
While the report offers comprehensive insights, it's advisable to review the specific contents or supplementary materials provided to ascertain if additional resources or data are available.
14. How can I stay updated on further developments or reports in the CPE Market?
To stay informed about further developments, trends, and reports in the CPE Market, consider subscribing to industry newsletters, following relevant companies and organizations, or regularly checking reputable industry news sources and publications.
Methodology
Step 1 - Identification of Relevant Samples Size from Population Database


Step 2 - Approaches for Defining Global Market Size (Value, Volume* & Price*)

Note*: In applicable scenarios
Step 3 - Data Sources
Primary Research
- Web Analytics
- Survey Reports
- Research Institute
- Latest Research Reports
- Opinion Leaders
Secondary Research
- Annual Reports
- White Paper
- Latest Press Release
- Industry Association
- Paid Database
- Investor Presentations

Step 4 - Data Triangulation
Involves using different sources of information in order to increase the validity of a study
These sources are likely to be stakeholders in a program - participants, other researchers, program staff, other community members, and so on.
Then we put all data in single framework & apply various statistical tools to find out the dynamic on the market.
During the analysis stage, feedback from the stakeholder groups would be compared to determine areas of agreement as well as areas of divergence
