

Key Insights
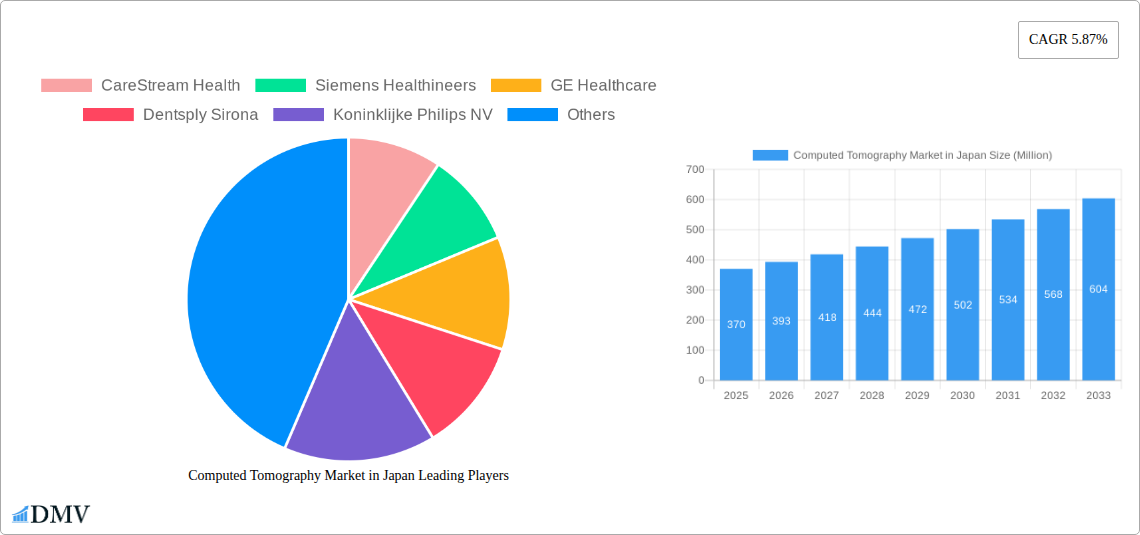
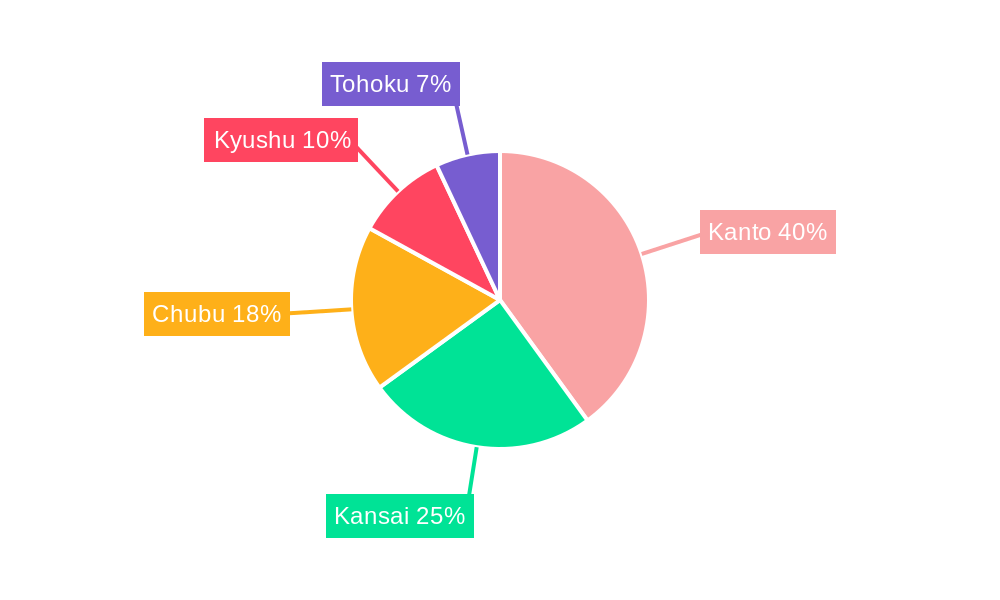
The Japanese Computed Tomography (CT) market, valued at $370 million in 2025, is projected to experience robust growth, driven by factors such as an aging population increasing the prevalence of chronic diseases requiring CT scans, rising healthcare expenditure, technological advancements leading to improved image quality and faster scan times, and the growing adoption of minimally invasive procedures guided by CT imaging. The market is segmented by slice type (low, medium, high), application (oncology, neurology, cardiovascular, musculoskeletal, and others), and end-user (hospitals, diagnostic centers, and others). Hospitals constitute the largest segment, reflecting the concentration of advanced imaging technologies in these facilities. The high-slice CT segment is expected to witness the fastest growth due to its superior image resolution and diagnostic capabilities. Regional variations exist, with the Kanto region likely holding the largest market share due to its high population density and concentration of medical facilities. While regulatory approvals and high equipment costs could act as restraints, the overall market outlook remains positive, fueled by continuous technological innovation and increasing demand for advanced diagnostic imaging.
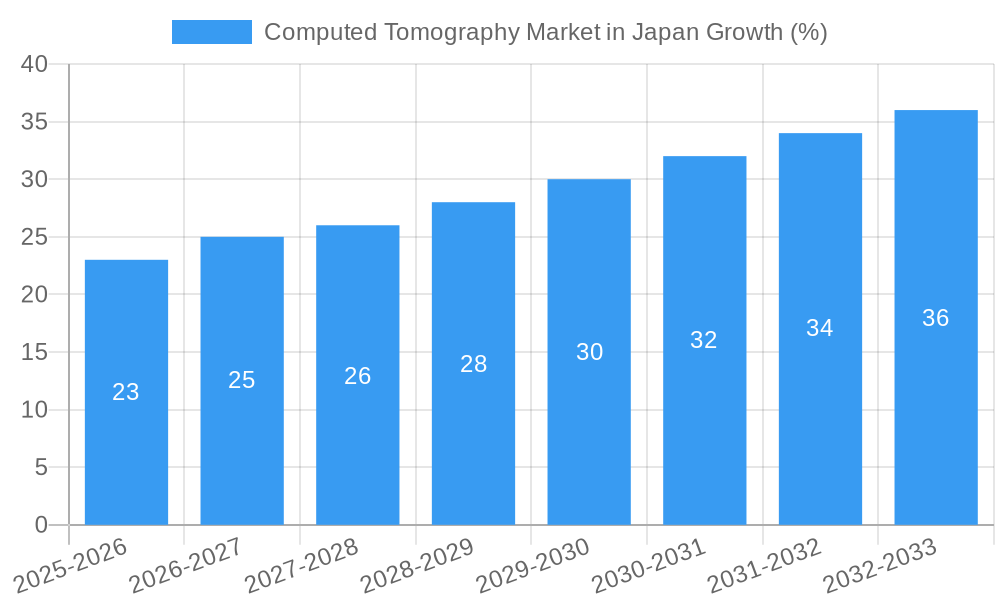
The forecast period (2025-2033) anticipates a steady CAGR of 5.87%, projecting significant market expansion. Technological advancements like AI-powered image analysis and the integration of CT with other modalities (like PET/CT) will further enhance the market’s growth trajectory. Specific regional growth will likely mirror population demographics and healthcare infrastructure development, with the Kansai and Chubu regions also showing considerable expansion. Competition among established players like CareStream Health, Siemens Healthineers, GE Healthcare, and others, will intensify, driving innovation and potentially leading to price adjustments, influencing overall market dynamics. The increasing adoption of advanced CT technologies in specialized applications, particularly oncology and neurology, will contribute significantly to the market's expansion throughout the forecast period.
This insightful report provides a detailed analysis of the Computed Tomography (CT) market in Japan, covering the period 2019-2033. It offers a comprehensive overview of market dynamics, competitive landscape, technological advancements, and future growth prospects, equipping stakeholders with actionable intelligence for strategic decision-making. The report segments the market by type (Low Slice, Medium Slice, High Slice), application (Oncology, Neurology, Cardiovascular, Musculoskeletal, Other Applications), and end-user (Hospitals, Diagnostic Centers, Other End-Users). The market size is valued in Millions.
Computed Tomography Market in Japan Market Composition & Trends
The Japanese Computed Tomography market exhibits a moderately concentrated landscape, with key players such as Siemens Healthineers, GE Healthcare, Fujifilm Holdings Corporation, and Canon Medical Systems Corporation holding significant market share. Market share distribution fluctuates based on technological advancements and strategic partnerships. The estimated market size in 2025 is xx Million, with a projected compound annual growth rate (CAGR) of xx% during 2025-2033.
Innovation is a key driver, with companies investing heavily in developing advanced CT technologies like photon-counting CT. Regulatory approvals and stringent quality standards influence market dynamics. Substitute technologies, such as MRI, present competitive challenges, while M&A activities are relatively infrequent, with recent deal values ranging from xx Million to xx Million. End-users, primarily hospitals and diagnostic centers, show a preference for high-slice CT systems due to enhanced imaging capabilities.
- Market Concentration: Moderately concentrated, with top 5 players holding approximately xx% market share in 2025.
- Innovation Catalysts: Development of photon-counting CT, AI-powered image analysis.
- Regulatory Landscape: Stringent regulatory approvals and quality control measures.
- Substitute Products: MRI, Ultrasound
- End-User Profile: Hospitals (xx%), Diagnostic Centers (xx%), Other (xx%)
- M&A Activity: Infrequent, with recent deals valued between xx Million and xx Million.
Computed Tomography Market in Japan Industry Evolution
The Japanese CT market has experienced steady growth over the historical period (2019-2024), driven by factors such as an aging population, rising prevalence of chronic diseases, and increased healthcare expenditure. Technological advancements, including the integration of AI and improved image processing capabilities, have significantly enhanced diagnostic accuracy and efficiency. Shifting consumer demands for faster and more precise diagnostic tools further propel market growth. The market witnessed a growth rate of xx% between 2019 and 2024, and is projected to maintain a CAGR of xx% from 2025 to 2033, reaching a market size of xx Million by 2033. This growth is significantly influenced by the adoption of advanced CT systems, particularly in specialized medical fields. The adoption rate of high-slice CT systems is rising steadily, reflecting an increasing preference for superior image quality and diagnostic precision.
Leading Regions, Countries, or Segments in Computed Tomography Market in Japan
The Japanese CT market is predominantly driven by the high prevalence of chronic diseases necessitating advanced diagnostic tools. The major segments contributing to market growth include:
- High-Slice CT Systems: Dominated by their superior image resolution and diagnostic capabilities.
- Oncology Applications: Driven by the increasing incidence of cancer and demand for precise cancer detection and treatment planning.
- Hospitals: Major end-users, accounting for the largest market share due to their advanced infrastructure and high patient volume.
Key Drivers:
- High prevalence of chronic diseases necessitating advanced diagnostic tools.
- Increasing healthcare expenditure enabling investment in sophisticated medical technologies.
- Government support through initiatives promoting early detection and diagnosis.
- Technological advancements leading to improved diagnostic accuracy.
The Kanto region, owing to its higher concentration of hospitals and advanced medical facilities, and major cities like Tokyo, Osaka and Nagoya represent the largest market share within Japan.
Computed Tomography Market in Japan Product Innovations
Recent innovations include the integration of AI for automated image analysis and improved diagnostic accuracy. Photon-counting CT offers superior image quality and contrast resolution, facilitating improved lesion detection and characterization. Manufacturers are also focusing on developing smaller and more efficient CT scanners for improved accessibility. These advancements enhance the diagnostic capabilities and overall performance of CT systems, contributing to faster and more accurate diagnoses. The introduction of these innovations is expected to further drive market expansion, with companies emphasizing unique selling propositions such as faster scan times, reduced radiation dose, and enhanced image quality.
Propelling Factors for Computed Tomography Market in Japan Growth
Several factors drive the growth of the Japanese CT market. Technological advancements, such as AI-powered image analysis and photon-counting CT, significantly improve diagnostic accuracy and efficiency. Economic factors, including increased healthcare spending and rising disposable incomes, enhance accessibility to advanced medical technologies. Government initiatives promoting early disease detection and improved healthcare infrastructure further fuel market expansion.
Obstacles in the Computed Tomography Market in Japan Market
Despite its growth potential, the Japanese CT market faces challenges. Stringent regulatory approvals for new technologies and high initial investment costs for advanced CT scanners create barriers to entry. Supply chain disruptions and global economic uncertainties impact the availability and pricing of essential components. Intense competition among established players also creates pressure on pricing and profitability margins, potentially hindering market growth.
Future Opportunities in Computed Tomography Market in Japan
Future opportunities lie in the expanding applications of AI in CT image analysis, further development of photon-counting CT, and increased adoption of mobile CT systems for improved accessibility in remote areas. Growing demand for minimally invasive diagnostic procedures and increased focus on preventive healthcare will further drive market growth. Exploring new applications, such as early detection of various diseases using advanced CT technology, presents a significant opportunity for market expansion.
Major Players in the Computed Tomography Market in Japan Ecosystem
- CareStream Health
- Siemens Healthineers
- GE Healthcare
- Dentsply Sirona
- Koninklijke Philips NV
- J Morita Corporation
- Canon Medical Systems Corporation
- Planmed Oy
- Fujifilm Holdings Corporation
Key Developments in Computed Tomography Market in Japan Industry
- April 2023: Canon Inc. and the National Cancer Center Japan (NCC) initiated clinical research using a next-generation X-ray CT system with photon-counting computed tomography (PCCT), signifying a major technological advancement in cancer diagnosis.
- April 2022: Fujitsu and Southern Tohoku General Hospital launched a joint research project focusing on AI-powered early detection of pancreatic cancer from non-contrast CT scans, highlighting the increasing role of AI in enhancing diagnostic capabilities.
Strategic Computed Tomography Market in Japan Market Forecast
The Japanese CT market is poised for substantial growth, driven by technological advancements, increasing healthcare expenditure, and government initiatives promoting early disease detection. The forecast period (2025-2033) anticipates a robust expansion, fueled by the adoption of advanced CT technologies and expanding applications in various medical fields. Continued innovation and strategic partnerships will play a crucial role in shaping the future of the Japanese CT market, with significant opportunities for market expansion and increased profitability for key players.
Computed Tomography Market in Japan Segmentation
-
1. Type
- 1.1. Low Slice
- 1.2. Medium Slice
- 1.3. High Slice
-
2. Application
- 2.1. Oncology
- 2.2. Neurology
- 2.3. Cardiovascular
- 2.4. Musculoskeletal
- 2.5. Other Applications
-
3. End-User
- 3.1. Hospitals
- 3.2. Diagnostic Centers
- 3.3. Other End-Users
Computed Tomography Market in Japan Segmentation By Geography
-
1. North America
- 1.1. United States
- 1.2. Canada
- 1.3. Mexico
-
2. South America
- 2.1. Brazil
- 2.2. Argentina
- 2.3. Rest of South America
-
3. Europe
- 3.1. United Kingdom
- 3.2. Germany
- 3.3. France
- 3.4. Italy
- 3.5. Spain
- 3.6. Russia
- 3.7. Benelux
- 3.8. Nordics
- 3.9. Rest of Europe
-
4. Middle East & Africa
- 4.1. Turkey
- 4.2. Israel
- 4.3. GCC
- 4.4. North Africa
- 4.5. South Africa
- 4.6. Rest of Middle East & Africa
-
5. Asia Pacific
- 5.1. China
- 5.2. India
- 5.3. Japan
- 5.4. South Korea
- 5.5. ASEAN
- 5.6. Oceania
- 5.7. Rest of Asia Pacific
Computed Tomography Market in Japan REPORT HIGHLIGHTS
| Aspects | Details |
|---|---|
| Study Period | 2019-2033 |
| Base Year | 2024 |
| Estimated Year | 2025 |
| Forecast Period | 2025-2033 |
| Historical Period | 2019-2024 |
| Growth Rate | CAGR of 5.87% from 2019-2033 |
| Segmentation |
|
Table of Contents
- 1. Introduction
- 1.1. Research Scope
- 1.2. Market Segmentation
- 1.3. Research Methodology
- 1.4. Definitions and Assumptions
- 2. Executive Summary
- 2.1. Introduction
- 3. Market Dynamics
- 3.1. Introduction
- 3.2. Market Drivers
- 3.2.1. Increasing Geriatric Population and Chronic Disease Burden; Technological Advancements in Computed Tomography
- 3.3. Market Restrains
- 3.3.1. High Cost Associated With CT Scan Procedure and Equipment
- 3.4. Market Trends
- 3.4.1. The Diagnostic Centers Segment is Expected to Witness Significant Growth in End Users
- 4. Market Factor Analysis
- 4.1. Porters Five Forces
- 4.2. Supply/Value Chain
- 4.3. PESTEL analysis
- 4.4. Market Entropy
- 4.5. Patent/Trademark Analysis
- 5. Global Computed Tomography Market in Japan Analysis, Insights and Forecast, 2019-2031
- 5.1. Market Analysis, Insights and Forecast - by Type
- 5.1.1. Low Slice
- 5.1.2. Medium Slice
- 5.1.3. High Slice
- 5.2. Market Analysis, Insights and Forecast - by Application
- 5.2.1. Oncology
- 5.2.2. Neurology
- 5.2.3. Cardiovascular
- 5.2.4. Musculoskeletal
- 5.2.5. Other Applications
- 5.3. Market Analysis, Insights and Forecast - by End-User
- 5.3.1. Hospitals
- 5.3.2. Diagnostic Centers
- 5.3.3. Other End-Users
- 5.4. Market Analysis, Insights and Forecast - by Region
- 5.4.1. North America
- 5.4.2. South America
- 5.4.3. Europe
- 5.4.4. Middle East & Africa
- 5.4.5. Asia Pacific
- 5.1. Market Analysis, Insights and Forecast - by Type
- 6. North America Computed Tomography Market in Japan Analysis, Insights and Forecast, 2019-2031
- 6.1. Market Analysis, Insights and Forecast - by Type
- 6.1.1. Low Slice
- 6.1.2. Medium Slice
- 6.1.3. High Slice
- 6.2. Market Analysis, Insights and Forecast - by Application
- 6.2.1. Oncology
- 6.2.2. Neurology
- 6.2.3. Cardiovascular
- 6.2.4. Musculoskeletal
- 6.2.5. Other Applications
- 6.3. Market Analysis, Insights and Forecast - by End-User
- 6.3.1. Hospitals
- 6.3.2. Diagnostic Centers
- 6.3.3. Other End-Users
- 6.1. Market Analysis, Insights and Forecast - by Type
- 7. South America Computed Tomography Market in Japan Analysis, Insights and Forecast, 2019-2031
- 7.1. Market Analysis, Insights and Forecast - by Type
- 7.1.1. Low Slice
- 7.1.2. Medium Slice
- 7.1.3. High Slice
- 7.2. Market Analysis, Insights and Forecast - by Application
- 7.2.1. Oncology
- 7.2.2. Neurology
- 7.2.3. Cardiovascular
- 7.2.4. Musculoskeletal
- 7.2.5. Other Applications
- 7.3. Market Analysis, Insights and Forecast - by End-User
- 7.3.1. Hospitals
- 7.3.2. Diagnostic Centers
- 7.3.3. Other End-Users
- 7.1. Market Analysis, Insights and Forecast - by Type
- 8. Europe Computed Tomography Market in Japan Analysis, Insights and Forecast, 2019-2031
- 8.1. Market Analysis, Insights and Forecast - by Type
- 8.1.1. Low Slice
- 8.1.2. Medium Slice
- 8.1.3. High Slice
- 8.2. Market Analysis, Insights and Forecast - by Application
- 8.2.1. Oncology
- 8.2.2. Neurology
- 8.2.3. Cardiovascular
- 8.2.4. Musculoskeletal
- 8.2.5. Other Applications
- 8.3. Market Analysis, Insights and Forecast - by End-User
- 8.3.1. Hospitals
- 8.3.2. Diagnostic Centers
- 8.3.3. Other End-Users
- 8.1. Market Analysis, Insights and Forecast - by Type
- 9. Middle East & Africa Computed Tomography Market in Japan Analysis, Insights and Forecast, 2019-2031
- 9.1. Market Analysis, Insights and Forecast - by Type
- 9.1.1. Low Slice
- 9.1.2. Medium Slice
- 9.1.3. High Slice
- 9.2. Market Analysis, Insights and Forecast - by Application
- 9.2.1. Oncology
- 9.2.2. Neurology
- 9.2.3. Cardiovascular
- 9.2.4. Musculoskeletal
- 9.2.5. Other Applications
- 9.3. Market Analysis, Insights and Forecast - by End-User
- 9.3.1. Hospitals
- 9.3.2. Diagnostic Centers
- 9.3.3. Other End-Users
- 9.1. Market Analysis, Insights and Forecast - by Type
- 10. Asia Pacific Computed Tomography Market in Japan Analysis, Insights and Forecast, 2019-2031
- 10.1. Market Analysis, Insights and Forecast - by Type
- 10.1.1. Low Slice
- 10.1.2. Medium Slice
- 10.1.3. High Slice
- 10.2. Market Analysis, Insights and Forecast - by Application
- 10.2.1. Oncology
- 10.2.2. Neurology
- 10.2.3. Cardiovascular
- 10.2.4. Musculoskeletal
- 10.2.5. Other Applications
- 10.3. Market Analysis, Insights and Forecast - by End-User
- 10.3.1. Hospitals
- 10.3.2. Diagnostic Centers
- 10.3.3. Other End-Users
- 10.1. Market Analysis, Insights and Forecast - by Type
- 11. Kanto Computed Tomography Market in Japan Analysis, Insights and Forecast, 2019-2031
- 12. Kansai Computed Tomography Market in Japan Analysis, Insights and Forecast, 2019-2031
- 13. Chubu Computed Tomography Market in Japan Analysis, Insights and Forecast, 2019-2031
- 14. Kyushu Computed Tomography Market in Japan Analysis, Insights and Forecast, 2019-2031
- 15. Tohoku Computed Tomography Market in Japan Analysis, Insights and Forecast, 2019-2031
- 16. Competitive Analysis
- 16.1. Global Market Share Analysis 2024
- 16.2. Company Profiles
- 16.2.1 CareStream Health
- 16.2.1.1. Overview
- 16.2.1.2. Products
- 16.2.1.3. SWOT Analysis
- 16.2.1.4. Recent Developments
- 16.2.1.5. Financials (Based on Availability)
- 16.2.2 Siemens Healthineers
- 16.2.2.1. Overview
- 16.2.2.2. Products
- 16.2.2.3. SWOT Analysis
- 16.2.2.4. Recent Developments
- 16.2.2.5. Financials (Based on Availability)
- 16.2.3 GE Healthcare
- 16.2.3.1. Overview
- 16.2.3.2. Products
- 16.2.3.3. SWOT Analysis
- 16.2.3.4. Recent Developments
- 16.2.3.5. Financials (Based on Availability)
- 16.2.4 Dentsply Sirona
- 16.2.4.1. Overview
- 16.2.4.2. Products
- 16.2.4.3. SWOT Analysis
- 16.2.4.4. Recent Developments
- 16.2.4.5. Financials (Based on Availability)
- 16.2.5 Koninklijke Philips NV
- 16.2.5.1. Overview
- 16.2.5.2. Products
- 16.2.5.3. SWOT Analysis
- 16.2.5.4. Recent Developments
- 16.2.5.5. Financials (Based on Availability)
- 16.2.6 J Morita Corporation
- 16.2.6.1. Overview
- 16.2.6.2. Products
- 16.2.6.3. SWOT Analysis
- 16.2.6.4. Recent Developments
- 16.2.6.5. Financials (Based on Availability)
- 16.2.7 Canon Medical Systems Corporation
- 16.2.7.1. Overview
- 16.2.7.2. Products
- 16.2.7.3. SWOT Analysis
- 16.2.7.4. Recent Developments
- 16.2.7.5. Financials (Based on Availability)
- 16.2.8 Planmed Oy
- 16.2.8.1. Overview
- 16.2.8.2. Products
- 16.2.8.3. SWOT Analysis
- 16.2.8.4. Recent Developments
- 16.2.8.5. Financials (Based on Availability)
- 16.2.9 Fujifilm Holdings Corporation
- 16.2.9.1. Overview
- 16.2.9.2. Products
- 16.2.9.3. SWOT Analysis
- 16.2.9.4. Recent Developments
- 16.2.9.5. Financials (Based on Availability)
- 16.2.1 CareStream Health
List of Figures
- Figure 1: Global Computed Tomography Market in Japan Revenue Breakdown (Million, %) by Region 2024 & 2032
- Figure 2: Japan Computed Tomography Market in Japan Revenue (Million), by Country 2024 & 2032
- Figure 3: Japan Computed Tomography Market in Japan Revenue Share (%), by Country 2024 & 2032
- Figure 4: North America Computed Tomography Market in Japan Revenue (Million), by Type 2024 & 2032
- Figure 5: North America Computed Tomography Market in Japan Revenue Share (%), by Type 2024 & 2032
- Figure 6: North America Computed Tomography Market in Japan Revenue (Million), by Application 2024 & 2032
- Figure 7: North America Computed Tomography Market in Japan Revenue Share (%), by Application 2024 & 2032
- Figure 8: North America Computed Tomography Market in Japan Revenue (Million), by End-User 2024 & 2032
- Figure 9: North America Computed Tomography Market in Japan Revenue Share (%), by End-User 2024 & 2032
- Figure 10: North America Computed Tomography Market in Japan Revenue (Million), by Country 2024 & 2032
- Figure 11: North America Computed Tomography Market in Japan Revenue Share (%), by Country 2024 & 2032
- Figure 12: South America Computed Tomography Market in Japan Revenue (Million), by Type 2024 & 2032
- Figure 13: South America Computed Tomography Market in Japan Revenue Share (%), by Type 2024 & 2032
- Figure 14: South America Computed Tomography Market in Japan Revenue (Million), by Application 2024 & 2032
- Figure 15: South America Computed Tomography Market in Japan Revenue Share (%), by Application 2024 & 2032
- Figure 16: South America Computed Tomography Market in Japan Revenue (Million), by End-User 2024 & 2032
- Figure 17: South America Computed Tomography Market in Japan Revenue Share (%), by End-User 2024 & 2032
- Figure 18: South America Computed Tomography Market in Japan Revenue (Million), by Country 2024 & 2032
- Figure 19: South America Computed Tomography Market in Japan Revenue Share (%), by Country 2024 & 2032
- Figure 20: Europe Computed Tomography Market in Japan Revenue (Million), by Type 2024 & 2032
- Figure 21: Europe Computed Tomography Market in Japan Revenue Share (%), by Type 2024 & 2032
- Figure 22: Europe Computed Tomography Market in Japan Revenue (Million), by Application 2024 & 2032
- Figure 23: Europe Computed Tomography Market in Japan Revenue Share (%), by Application 2024 & 2032
- Figure 24: Europe Computed Tomography Market in Japan Revenue (Million), by End-User 2024 & 2032
- Figure 25: Europe Computed Tomography Market in Japan Revenue Share (%), by End-User 2024 & 2032
- Figure 26: Europe Computed Tomography Market in Japan Revenue (Million), by Country 2024 & 2032
- Figure 27: Europe Computed Tomography Market in Japan Revenue Share (%), by Country 2024 & 2032
- Figure 28: Middle East & Africa Computed Tomography Market in Japan Revenue (Million), by Type 2024 & 2032
- Figure 29: Middle East & Africa Computed Tomography Market in Japan Revenue Share (%), by Type 2024 & 2032
- Figure 30: Middle East & Africa Computed Tomography Market in Japan Revenue (Million), by Application 2024 & 2032
- Figure 31: Middle East & Africa Computed Tomography Market in Japan Revenue Share (%), by Application 2024 & 2032
- Figure 32: Middle East & Africa Computed Tomography Market in Japan Revenue (Million), by End-User 2024 & 2032
- Figure 33: Middle East & Africa Computed Tomography Market in Japan Revenue Share (%), by End-User 2024 & 2032
- Figure 34: Middle East & Africa Computed Tomography Market in Japan Revenue (Million), by Country 2024 & 2032
- Figure 35: Middle East & Africa Computed Tomography Market in Japan Revenue Share (%), by Country 2024 & 2032
- Figure 36: Asia Pacific Computed Tomography Market in Japan Revenue (Million), by Type 2024 & 2032
- Figure 37: Asia Pacific Computed Tomography Market in Japan Revenue Share (%), by Type 2024 & 2032
- Figure 38: Asia Pacific Computed Tomography Market in Japan Revenue (Million), by Application 2024 & 2032
- Figure 39: Asia Pacific Computed Tomography Market in Japan Revenue Share (%), by Application 2024 & 2032
- Figure 40: Asia Pacific Computed Tomography Market in Japan Revenue (Million), by End-User 2024 & 2032
- Figure 41: Asia Pacific Computed Tomography Market in Japan Revenue Share (%), by End-User 2024 & 2032
- Figure 42: Asia Pacific Computed Tomography Market in Japan Revenue (Million), by Country 2024 & 2032
- Figure 43: Asia Pacific Computed Tomography Market in Japan Revenue Share (%), by Country 2024 & 2032
List of Tables
- Table 1: Global Computed Tomography Market in Japan Revenue Million Forecast, by Region 2019 & 2032
- Table 2: Global Computed Tomography Market in Japan Revenue Million Forecast, by Type 2019 & 2032
- Table 3: Global Computed Tomography Market in Japan Revenue Million Forecast, by Application 2019 & 2032
- Table 4: Global Computed Tomography Market in Japan Revenue Million Forecast, by End-User 2019 & 2032
- Table 5: Global Computed Tomography Market in Japan Revenue Million Forecast, by Region 2019 & 2032
- Table 6: Global Computed Tomography Market in Japan Revenue Million Forecast, by Country 2019 & 2032
- Table 7: Kanto Computed Tomography Market in Japan Revenue (Million) Forecast, by Application 2019 & 2032
- Table 8: Kansai Computed Tomography Market in Japan Revenue (Million) Forecast, by Application 2019 & 2032
- Table 9: Chubu Computed Tomography Market in Japan Revenue (Million) Forecast, by Application 2019 & 2032
- Table 10: Kyushu Computed Tomography Market in Japan Revenue (Million) Forecast, by Application 2019 & 2032
- Table 11: Tohoku Computed Tomography Market in Japan Revenue (Million) Forecast, by Application 2019 & 2032
- Table 12: Global Computed Tomography Market in Japan Revenue Million Forecast, by Type 2019 & 2032
- Table 13: Global Computed Tomography Market in Japan Revenue Million Forecast, by Application 2019 & 2032
- Table 14: Global Computed Tomography Market in Japan Revenue Million Forecast, by End-User 2019 & 2032
- Table 15: Global Computed Tomography Market in Japan Revenue Million Forecast, by Country 2019 & 2032
- Table 16: United States Computed Tomography Market in Japan Revenue (Million) Forecast, by Application 2019 & 2032
- Table 17: Canada Computed Tomography Market in Japan Revenue (Million) Forecast, by Application 2019 & 2032
- Table 18: Mexico Computed Tomography Market in Japan Revenue (Million) Forecast, by Application 2019 & 2032
- Table 19: Global Computed Tomography Market in Japan Revenue Million Forecast, by Type 2019 & 2032
- Table 20: Global Computed Tomography Market in Japan Revenue Million Forecast, by Application 2019 & 2032
- Table 21: Global Computed Tomography Market in Japan Revenue Million Forecast, by End-User 2019 & 2032
- Table 22: Global Computed Tomography Market in Japan Revenue Million Forecast, by Country 2019 & 2032
- Table 23: Brazil Computed Tomography Market in Japan Revenue (Million) Forecast, by Application 2019 & 2032
- Table 24: Argentina Computed Tomography Market in Japan Revenue (Million) Forecast, by Application 2019 & 2032
- Table 25: Rest of South America Computed Tomography Market in Japan Revenue (Million) Forecast, by Application 2019 & 2032
- Table 26: Global Computed Tomography Market in Japan Revenue Million Forecast, by Type 2019 & 2032
- Table 27: Global Computed Tomography Market in Japan Revenue Million Forecast, by Application 2019 & 2032
- Table 28: Global Computed Tomography Market in Japan Revenue Million Forecast, by End-User 2019 & 2032
- Table 29: Global Computed Tomography Market in Japan Revenue Million Forecast, by Country 2019 & 2032
- Table 30: United Kingdom Computed Tomography Market in Japan Revenue (Million) Forecast, by Application 2019 & 2032
- Table 31: Germany Computed Tomography Market in Japan Revenue (Million) Forecast, by Application 2019 & 2032
- Table 32: France Computed Tomography Market in Japan Revenue (Million) Forecast, by Application 2019 & 2032
- Table 33: Italy Computed Tomography Market in Japan Revenue (Million) Forecast, by Application 2019 & 2032
- Table 34: Spain Computed Tomography Market in Japan Revenue (Million) Forecast, by Application 2019 & 2032
- Table 35: Russia Computed Tomography Market in Japan Revenue (Million) Forecast, by Application 2019 & 2032
- Table 36: Benelux Computed Tomography Market in Japan Revenue (Million) Forecast, by Application 2019 & 2032
- Table 37: Nordics Computed Tomography Market in Japan Revenue (Million) Forecast, by Application 2019 & 2032
- Table 38: Rest of Europe Computed Tomography Market in Japan Revenue (Million) Forecast, by Application 2019 & 2032
- Table 39: Global Computed Tomography Market in Japan Revenue Million Forecast, by Type 2019 & 2032
- Table 40: Global Computed Tomography Market in Japan Revenue Million Forecast, by Application 2019 & 2032
- Table 41: Global Computed Tomography Market in Japan Revenue Million Forecast, by End-User 2019 & 2032
- Table 42: Global Computed Tomography Market in Japan Revenue Million Forecast, by Country 2019 & 2032
- Table 43: Turkey Computed Tomography Market in Japan Revenue (Million) Forecast, by Application 2019 & 2032
- Table 44: Israel Computed Tomography Market in Japan Revenue (Million) Forecast, by Application 2019 & 2032
- Table 45: GCC Computed Tomography Market in Japan Revenue (Million) Forecast, by Application 2019 & 2032
- Table 46: North Africa Computed Tomography Market in Japan Revenue (Million) Forecast, by Application 2019 & 2032
- Table 47: South Africa Computed Tomography Market in Japan Revenue (Million) Forecast, by Application 2019 & 2032
- Table 48: Rest of Middle East & Africa Computed Tomography Market in Japan Revenue (Million) Forecast, by Application 2019 & 2032
- Table 49: Global Computed Tomography Market in Japan Revenue Million Forecast, by Type 2019 & 2032
- Table 50: Global Computed Tomography Market in Japan Revenue Million Forecast, by Application 2019 & 2032
- Table 51: Global Computed Tomography Market in Japan Revenue Million Forecast, by End-User 2019 & 2032
- Table 52: Global Computed Tomography Market in Japan Revenue Million Forecast, by Country 2019 & 2032
- Table 53: China Computed Tomography Market in Japan Revenue (Million) Forecast, by Application 2019 & 2032
- Table 54: India Computed Tomography Market in Japan Revenue (Million) Forecast, by Application 2019 & 2032
- Table 55: Japan Computed Tomography Market in Japan Revenue (Million) Forecast, by Application 2019 & 2032
- Table 56: South Korea Computed Tomography Market in Japan Revenue (Million) Forecast, by Application 2019 & 2032
- Table 57: ASEAN Computed Tomography Market in Japan Revenue (Million) Forecast, by Application 2019 & 2032
- Table 58: Oceania Computed Tomography Market in Japan Revenue (Million) Forecast, by Application 2019 & 2032
- Table 59: Rest of Asia Pacific Computed Tomography Market in Japan Revenue (Million) Forecast, by Application 2019 & 2032
Frequently Asked Questions
1. What is the projected Compound Annual Growth Rate (CAGR) of the Computed Tomography Market in Japan?
The projected CAGR is approximately 5.87%.
2. Which companies are prominent players in the Computed Tomography Market in Japan?
Key companies in the market include CareStream Health, Siemens Healthineers, GE Healthcare, Dentsply Sirona, Koninklijke Philips NV, J Morita Corporation, Canon Medical Systems Corporation, Planmed Oy, Fujifilm Holdings Corporation.
3. What are the main segments of the Computed Tomography Market in Japan?
The market segments include Type, Application, End-User.
4. Can you provide details about the market size?
The market size is estimated to be USD 0.37 Million as of 2022.
5. What are some drivers contributing to market growth?
Increasing Geriatric Population and Chronic Disease Burden; Technological Advancements in Computed Tomography.
6. What are the notable trends driving market growth?
The Diagnostic Centers Segment is Expected to Witness Significant Growth in End Users.
7. Are there any restraints impacting market growth?
High Cost Associated With CT Scan Procedure and Equipment.
8. Can you provide examples of recent developments in the market?
April 2023: Canon Inc. announced that Canon and the National Cancer Center Japan (NCC) have begun clinical research employing a next-generation X-ray CT system with photon-counting computed tomography (photon-counting CT, PCCT).
9. What pricing options are available for accessing the report?
Pricing options include single-user, multi-user, and enterprise licenses priced at USD 3800, USD 4500, and USD 5800 respectively.
10. Is the market size provided in terms of value or volume?
The market size is provided in terms of value, measured in Million.
11. Are there any specific market keywords associated with the report?
Yes, the market keyword associated with the report is "Computed Tomography Market in Japan," which aids in identifying and referencing the specific market segment covered.
12. How do I determine which pricing option suits my needs best?
The pricing options vary based on user requirements and access needs. Individual users may opt for single-user licenses, while businesses requiring broader access may choose multi-user or enterprise licenses for cost-effective access to the report.
13. Are there any additional resources or data provided in the Computed Tomography Market in Japan report?
While the report offers comprehensive insights, it's advisable to review the specific contents or supplementary materials provided to ascertain if additional resources or data are available.
14. How can I stay updated on further developments or reports in the Computed Tomography Market in Japan?
To stay informed about further developments, trends, and reports in the Computed Tomography Market in Japan, consider subscribing to industry newsletters, following relevant companies and organizations, or regularly checking reputable industry news sources and publications.
Methodology
Step 1 - Identification of Relevant Samples Size from Population Database


Step 2 - Approaches for Defining Global Market Size (Value, Volume* & Price*)

Note*: In applicable scenarios
Step 3 - Data Sources
Primary Research
- Web Analytics
- Survey Reports
- Research Institute
- Latest Research Reports
- Opinion Leaders
Secondary Research
- Annual Reports
- White Paper
- Latest Press Release
- Industry Association
- Paid Database
- Investor Presentations

Step 4 - Data Triangulation
Involves using different sources of information in order to increase the validity of a study
These sources are likely to be stakeholders in a program - participants, other researchers, program staff, other community members, and so on.
Then we put all data in single framework & apply various statistical tools to find out the dynamic on the market.
During the analysis stage, feedback from the stakeholder groups would be compared to determine areas of agreement as well as areas of divergence
