

Key Insights
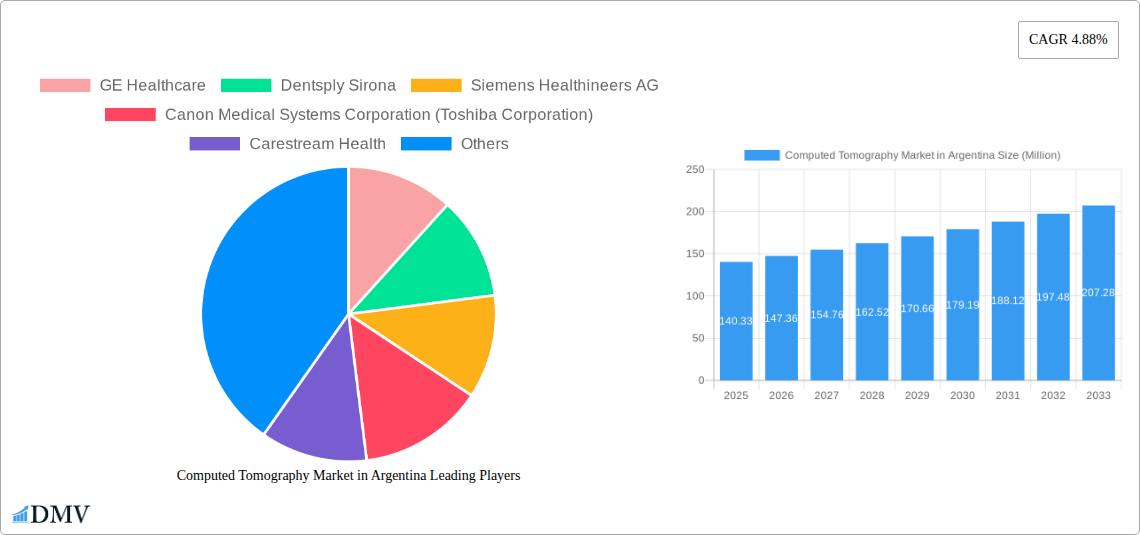
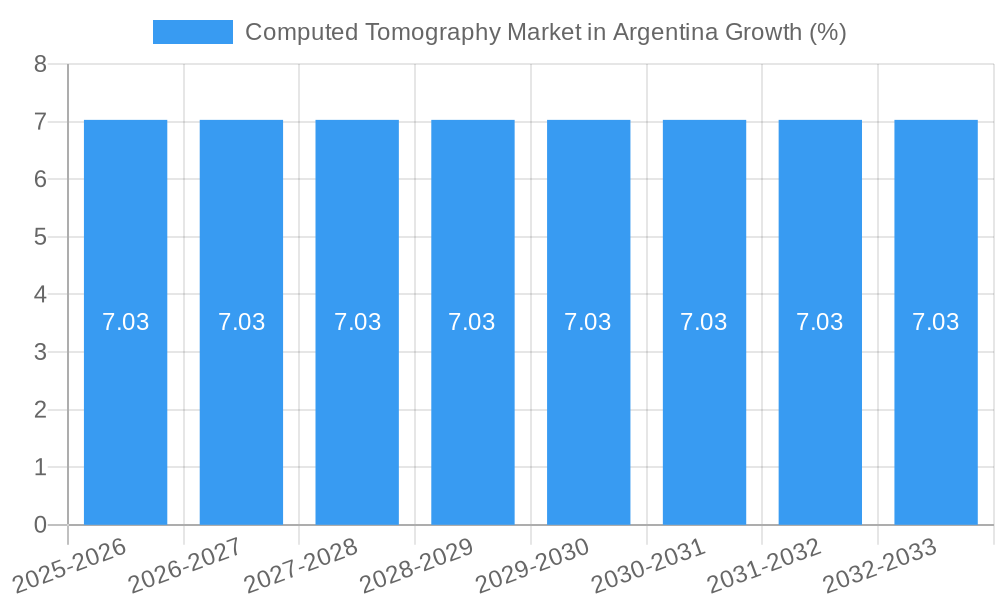
The Argentinian Computed Tomography (CT) market, valued at $140.33 million in 2025, exhibits robust growth potential, projected to expand at a compound annual growth rate (CAGR) of 4.88% from 2025 to 2033. This growth is fueled by several key factors. Increasing prevalence of chronic diseases like cardiovascular conditions, cancer, and neurological disorders necessitates advanced diagnostic imaging, driving demand for CT scans. Furthermore, technological advancements in CT technology, such as multi-slice CT scanners offering faster scan times and improved image quality, are significantly impacting market expansion. Government initiatives promoting healthcare infrastructure development and increased healthcare expenditure further contribute to market growth. The market is segmented by end-user (hospitals, diagnostic centers, other), type (low, medium, high slice), and application (oncology, neurology, cardiovascular, musculoskeletal, other). Hospitals currently dominate the end-user segment due to their comprehensive diagnostic capabilities. High-slice CT scanners are gaining traction due to superior image quality and speed. Oncology and cardiovascular applications represent significant market shares, reflecting the prevalence of these diseases in Argentina. However, challenges such as high equipment costs and the need for skilled technicians could potentially restrain market growth to some degree. Competition is fierce, with key players like GE Healthcare, Siemens Healthineers AG, and Philips vying for market share through technological innovation and strategic partnerships.
The Argentinian CT market's future trajectory is promising, particularly considering the rising geriatric population, which is more susceptible to chronic diseases requiring CT scans. While economic factors could influence market growth, the long-term outlook remains positive. The ongoing focus on improving healthcare infrastructure and the introduction of advanced imaging technologies will likely offset any potential restraints. The market's segmentation presents opportunities for specialized players to cater to niche applications and end-user needs. The continuous evolution of CT technology, encompassing artificial intelligence (AI) for image analysis, will also drive further growth and market differentiation. Companies investing in research and development, as well as those focusing on service and maintenance support, are likely to gain a competitive advantage in this dynamic market.
Computed Tomography (CT) Market in Argentina: A Comprehensive Report (2019-2033)
This insightful report provides a detailed analysis of the Computed Tomography (CT) market in Argentina, offering a comprehensive overview of market dynamics, growth trajectories, key players, and future opportunities. The study period covers 2019-2033, with a base year of 2025 and a forecast period of 2025-2033. This report is essential for stakeholders seeking to understand the current landscape and future potential of the Argentinean CT market.
Computed Tomography Market in Argentina: Market Composition & Trends
The Argentinean CT market exhibits a moderately concentrated landscape, with key players such as GE Healthcare, Siemens Healthineers AG, and Philips holding significant market share. The market's evolution is driven by factors including technological advancements (e.g., multi-slice CT scanners, AI-powered image analysis), increasing prevalence of chronic diseases, rising healthcare expenditure, and government initiatives to improve healthcare infrastructure. Regulatory frameworks, while generally supportive of technological advancements, influence market access and pricing strategies. Substitute imaging modalities like MRI and ultrasound compete for market share, particularly in specific applications. M&A activities have been relatively limited in recent years, with reported deal values totaling approximately xx Million in the historical period. End-user profiles reveal a significant concentration in Hospitals (xx%), followed by Diagnostic Centers (xx%) and Other End Users (xx%).
- Market Share Distribution (2024): GE Healthcare (xx%), Siemens Healthineers AG (xx%), Philips (xx%), Others (xx%).
- M&A Activity (2019-2024): Total Deal Value: xx Million
- Key Innovation Catalysts: AI-powered image analysis, multi-slice technology, advanced reconstruction algorithms.
- Regulatory Landscape: Primarily supportive of technological advancement, with regulations focused on safety and efficacy.
Computed Tomography Market in Argentina: Industry Evolution
The Argentinean CT market has witnessed steady growth throughout the historical period (2019-2024), with a Compound Annual Growth Rate (CAGR) of approximately xx%. This growth is primarily attributed to increased demand for advanced diagnostic imaging, rising prevalence of chronic diseases requiring CT scans (e.g., cardiovascular diseases, cancer), and government investments in healthcare infrastructure. Technological advancements, particularly the introduction of higher-slice CT scanners offering faster scan times and improved image quality, have also significantly propelled market expansion. Shifting consumer demands are towards faster, more precise, and less invasive imaging techniques, which is driving the adoption of advanced CT systems. The forecast period (2025-2033) is expected to witness continued growth, albeit at a slightly moderated CAGR of xx%, driven by factors such as increasing healthcare awareness and affordability of CT scans. Adoption rates for advanced CT technologies are expected to increase significantly, with multi-slice CT scanners becoming increasingly prevalent.
Leading Regions, Countries, or Segments in Computed Tomography Market in Argentina
The largest segment within the Argentinean CT market is Hospitals, accounting for approximately xx% of the total market value in 2024. This dominance is primarily driven by the high concentration of CT scanners in large public and private hospitals, coupled with their capacity to cater to a broader range of patients and applications. The high-slice CT segment is also a significant driver of market growth due to its superior image quality and speed.
- Hospitals: High concentration of CT scanners, diverse patient base, high utilization rates.
- High-Slice CT: Superior image quality, faster scan times, increased adoption rates.
- Oncology Applications: Increasing prevalence of cancer leading to high demand for CT-guided biopsies and treatment planning.
Within the country, Buenos Aires and Cordoba provinces show the highest adoption of CT technology due to increased healthcare infrastructure investment and higher disease prevalence rates.
Computed Tomography Market in Argentina: Product Innovations
Recent innovations in the Argentinean CT market include the integration of AI-powered image analysis tools for improved diagnostic accuracy and efficiency, the development of more compact and versatile CT systems for use in smaller facilities, and advanced reconstruction algorithms that further enhance image quality and reduce radiation exposure. These innovations are improving the overall value proposition of CT scans, driving higher adoption rates, and enhancing the patient experience.
Propelling Factors for Computed Tomography Market in Argentina Growth
The growth of the Argentinean CT market is primarily driven by several factors, including a rising prevalence of chronic diseases, a growing elderly population requiring more frequent diagnostic imaging, increased government investment in healthcare infrastructure, expanding private healthcare sector, and the adoption of technologically advanced CT scanners. Furthermore, improving healthcare awareness and insurance coverage play a significant role in increasing access to CT scans.
Obstacles in the Computed Tomography Market in Argentina Market
Despite positive growth drivers, the Argentinean CT market faces certain obstacles. These include the high cost of advanced CT systems, potential supply chain disruptions affecting equipment procurement and maintenance, fluctuations in the Argentinean peso impacting import costs, and competitive pressures from other imaging modalities. These factors can influence market access and affordability of CT scans.
Future Opportunities in Computed Tomography Market in Argentina
Future opportunities in the Argentinean CT market lie in the expansion of tele-radiology services, the integration of CT with other imaging technologies for more comprehensive diagnostic assessments, and increasing demand for specialized CT applications (e.g., cardiac CT). Moreover, the growing adoption of AI-powered image analysis tools and the development of more affordable CT systems can unlock new market segments and drive future growth.
Major Players in the Computed Tomography Market in Argentina Ecosystem
- GE Healthcare (GE Healthcare)
- Dentsply Sirona (Dentsply Sirona)
- Siemens Healthineers AG (Siemens Healthineers AG)
- Canon Medical Systems Corporation (Toshiba Corporation) (Canon Medical Systems Corporation)
- Carestream Health (Carestream Health)
- Koninklijke Philips NV (Koninklijke Philips NV)
- Planmeca Group (Planmed OY) (Planmeca Group)
Key Developments in Computed Tomography Market in Argentina Industry
- November 2020: Agfa Radiology Solutions Argentina installed a DR 600 ceiling-mounted Full Leg/Full Spine computed tomography room system at the Imágenes Jaraba Medical Center.
- January 2021: Konica Minolta Healthcare Americas Inc. and AGIMED deployed Konica Minolta imaging management solutions in Córdoba's primary public health hospital system.
Strategic Computed Tomography Market in Argentina Market Forecast
The Argentinean CT market is poised for continued growth throughout the forecast period (2025-2033), driven by technological advancements, increasing healthcare spending, and a growing need for advanced diagnostic imaging. The adoption of AI-powered tools and the development of more affordable and accessible CT systems will play a significant role in shaping the market's trajectory. This expansion will create opportunities for existing players and attract new entrants to the market, fostering competition and further innovation.
Computed Tomography Market in Argentina Segmentation
-
1. Type
- 1.1. Low Slice
- 1.2. Medium Slice
- 1.3. High Slice
-
2. Application
- 2.1. Oncology
- 2.2. Neurology
- 2.3. Cardiovascular
- 2.4. Musculoskeletal
- 2.5. Other Applications
-
3. End User
- 3.1. Hospitals
- 3.2. Diagnostic Centers
- 3.3. Other End Users
Computed Tomography Market in Argentina Segmentation By Geography
-
1. North America
- 1.1. United States
- 1.2. Canada
- 1.3. Mexico
-
2. South America
- 2.1. Brazil
- 2.2. Argentina
- 2.3. Rest of South America
-
3. Europe
- 3.1. United Kingdom
- 3.2. Germany
- 3.3. France
- 3.4. Italy
- 3.5. Spain
- 3.6. Russia
- 3.7. Benelux
- 3.8. Nordics
- 3.9. Rest of Europe
-
4. Middle East & Africa
- 4.1. Turkey
- 4.2. Israel
- 4.3. GCC
- 4.4. North Africa
- 4.5. South Africa
- 4.6. Rest of Middle East & Africa
-
5. Asia Pacific
- 5.1. China
- 5.2. India
- 5.3. Japan
- 5.4. South Korea
- 5.5. ASEAN
- 5.6. Oceania
- 5.7. Rest of Asia Pacific
Computed Tomography Market in Argentina REPORT HIGHLIGHTS
| Aspects | Details |
|---|---|
| Study Period | 2019-2033 |
| Base Year | 2024 |
| Estimated Year | 2025 |
| Forecast Period | 2025-2033 |
| Historical Period | 2019-2024 |
| Growth Rate | CAGR of 4.88% from 2019-2033 |
| Segmentation |
|
Table of Contents
- 1. Introduction
- 1.1. Research Scope
- 1.2. Market Segmentation
- 1.3. Research Methodology
- 1.4. Definitions and Assumptions
- 2. Executive Summary
- 2.1. Introduction
- 3. Market Dynamics
- 3.1. Introduction
- 3.2. Market Drivers
- 3.2.1. Increasing Prevalence of Chronic Diseases; Rising Geriatric Population; Increasing Technological Advancements
- 3.3. Market Restrains
- 3.3.1. Lack Of Proper Reimbursement And Stringent Regulatory Approval Procedures; High Cost of Equipment
- 3.4. Market Trends
- 3.4.1. Medium Slice Segment is Expected to Hold a Significant Market Share Over the Forecast Period
- 4. Market Factor Analysis
- 4.1. Porters Five Forces
- 4.2. Supply/Value Chain
- 4.3. PESTEL analysis
- 4.4. Market Entropy
- 4.5. Patent/Trademark Analysis
- 5. Global Computed Tomography Market in Argentina Analysis, Insights and Forecast, 2019-2031
- 5.1. Market Analysis, Insights and Forecast - by Type
- 5.1.1. Low Slice
- 5.1.2. Medium Slice
- 5.1.3. High Slice
- 5.2. Market Analysis, Insights and Forecast - by Application
- 5.2.1. Oncology
- 5.2.2. Neurology
- 5.2.3. Cardiovascular
- 5.2.4. Musculoskeletal
- 5.2.5. Other Applications
- 5.3. Market Analysis, Insights and Forecast - by End User
- 5.3.1. Hospitals
- 5.3.2. Diagnostic Centers
- 5.3.3. Other End Users
- 5.4. Market Analysis, Insights and Forecast - by Region
- 5.4.1. North America
- 5.4.2. South America
- 5.4.3. Europe
- 5.4.4. Middle East & Africa
- 5.4.5. Asia Pacific
- 5.1. Market Analysis, Insights and Forecast - by Type
- 6. North America Computed Tomography Market in Argentina Analysis, Insights and Forecast, 2019-2031
- 6.1. Market Analysis, Insights and Forecast - by Type
- 6.1.1. Low Slice
- 6.1.2. Medium Slice
- 6.1.3. High Slice
- 6.2. Market Analysis, Insights and Forecast - by Application
- 6.2.1. Oncology
- 6.2.2. Neurology
- 6.2.3. Cardiovascular
- 6.2.4. Musculoskeletal
- 6.2.5. Other Applications
- 6.3. Market Analysis, Insights and Forecast - by End User
- 6.3.1. Hospitals
- 6.3.2. Diagnostic Centers
- 6.3.3. Other End Users
- 6.1. Market Analysis, Insights and Forecast - by Type
- 7. South America Computed Tomography Market in Argentina Analysis, Insights and Forecast, 2019-2031
- 7.1. Market Analysis, Insights and Forecast - by Type
- 7.1.1. Low Slice
- 7.1.2. Medium Slice
- 7.1.3. High Slice
- 7.2. Market Analysis, Insights and Forecast - by Application
- 7.2.1. Oncology
- 7.2.2. Neurology
- 7.2.3. Cardiovascular
- 7.2.4. Musculoskeletal
- 7.2.5. Other Applications
- 7.3. Market Analysis, Insights and Forecast - by End User
- 7.3.1. Hospitals
- 7.3.2. Diagnostic Centers
- 7.3.3. Other End Users
- 7.1. Market Analysis, Insights and Forecast - by Type
- 8. Europe Computed Tomography Market in Argentina Analysis, Insights and Forecast, 2019-2031
- 8.1. Market Analysis, Insights and Forecast - by Type
- 8.1.1. Low Slice
- 8.1.2. Medium Slice
- 8.1.3. High Slice
- 8.2. Market Analysis, Insights and Forecast - by Application
- 8.2.1. Oncology
- 8.2.2. Neurology
- 8.2.3. Cardiovascular
- 8.2.4. Musculoskeletal
- 8.2.5. Other Applications
- 8.3. Market Analysis, Insights and Forecast - by End User
- 8.3.1. Hospitals
- 8.3.2. Diagnostic Centers
- 8.3.3. Other End Users
- 8.1. Market Analysis, Insights and Forecast - by Type
- 9. Middle East & Africa Computed Tomography Market in Argentina Analysis, Insights and Forecast, 2019-2031
- 9.1. Market Analysis, Insights and Forecast - by Type
- 9.1.1. Low Slice
- 9.1.2. Medium Slice
- 9.1.3. High Slice
- 9.2. Market Analysis, Insights and Forecast - by Application
- 9.2.1. Oncology
- 9.2.2. Neurology
- 9.2.3. Cardiovascular
- 9.2.4. Musculoskeletal
- 9.2.5. Other Applications
- 9.3. Market Analysis, Insights and Forecast - by End User
- 9.3.1. Hospitals
- 9.3.2. Diagnostic Centers
- 9.3.3. Other End Users
- 9.1. Market Analysis, Insights and Forecast - by Type
- 10. Asia Pacific Computed Tomography Market in Argentina Analysis, Insights and Forecast, 2019-2031
- 10.1. Market Analysis, Insights and Forecast - by Type
- 10.1.1. Low Slice
- 10.1.2. Medium Slice
- 10.1.3. High Slice
- 10.2. Market Analysis, Insights and Forecast - by Application
- 10.2.1. Oncology
- 10.2.2. Neurology
- 10.2.3. Cardiovascular
- 10.2.4. Musculoskeletal
- 10.2.5. Other Applications
- 10.3. Market Analysis, Insights and Forecast - by End User
- 10.3.1. Hospitals
- 10.3.2. Diagnostic Centers
- 10.3.3. Other End Users
- 10.1. Market Analysis, Insights and Forecast - by Type
- 11. Competitive Analysis
- 11.1. Global Market Share Analysis 2024
- 11.2. Company Profiles
- 11.2.1 GE Healthcare
- 11.2.1.1. Overview
- 11.2.1.2. Products
- 11.2.1.3. SWOT Analysis
- 11.2.1.4. Recent Developments
- 11.2.1.5. Financials (Based on Availability)
- 11.2.2 Dentsply Sirona
- 11.2.2.1. Overview
- 11.2.2.2. Products
- 11.2.2.3. SWOT Analysis
- 11.2.2.4. Recent Developments
- 11.2.2.5. Financials (Based on Availability)
- 11.2.3 Siemens Healthineers AG
- 11.2.3.1. Overview
- 11.2.3.2. Products
- 11.2.3.3. SWOT Analysis
- 11.2.3.4. Recent Developments
- 11.2.3.5. Financials (Based on Availability)
- 11.2.4 Canon Medical Systems Corporation (Toshiba Corporation)
- 11.2.4.1. Overview
- 11.2.4.2. Products
- 11.2.4.3. SWOT Analysis
- 11.2.4.4. Recent Developments
- 11.2.4.5. Financials (Based on Availability)
- 11.2.5 Carestream Health
- 11.2.5.1. Overview
- 11.2.5.2. Products
- 11.2.5.3. SWOT Analysis
- 11.2.5.4. Recent Developments
- 11.2.5.5. Financials (Based on Availability)
- 11.2.6 Koninklijke Philips NV
- 11.2.6.1. Overview
- 11.2.6.2. Products
- 11.2.6.3. SWOT Analysis
- 11.2.6.4. Recent Developments
- 11.2.6.5. Financials (Based on Availability)
- 11.2.7 Planmeca Group (Planmed OY)
- 11.2.7.1. Overview
- 11.2.7.2. Products
- 11.2.7.3. SWOT Analysis
- 11.2.7.4. Recent Developments
- 11.2.7.5. Financials (Based on Availability)
- 11.2.1 GE Healthcare
List of Figures
- Figure 1: Global Computed Tomography Market in Argentina Revenue Breakdown (Million, %) by Region 2024 & 2032
- Figure 2: Argentina Computed Tomography Market in Argentina Revenue (Million), by Country 2024 & 2032
- Figure 3: Argentina Computed Tomography Market in Argentina Revenue Share (%), by Country 2024 & 2032
- Figure 4: North America Computed Tomography Market in Argentina Revenue (Million), by Type 2024 & 2032
- Figure 5: North America Computed Tomography Market in Argentina Revenue Share (%), by Type 2024 & 2032
- Figure 6: North America Computed Tomography Market in Argentina Revenue (Million), by Application 2024 & 2032
- Figure 7: North America Computed Tomography Market in Argentina Revenue Share (%), by Application 2024 & 2032
- Figure 8: North America Computed Tomography Market in Argentina Revenue (Million), by End User 2024 & 2032
- Figure 9: North America Computed Tomography Market in Argentina Revenue Share (%), by End User 2024 & 2032
- Figure 10: North America Computed Tomography Market in Argentina Revenue (Million), by Country 2024 & 2032
- Figure 11: North America Computed Tomography Market in Argentina Revenue Share (%), by Country 2024 & 2032
- Figure 12: South America Computed Tomography Market in Argentina Revenue (Million), by Type 2024 & 2032
- Figure 13: South America Computed Tomography Market in Argentina Revenue Share (%), by Type 2024 & 2032
- Figure 14: South America Computed Tomography Market in Argentina Revenue (Million), by Application 2024 & 2032
- Figure 15: South America Computed Tomography Market in Argentina Revenue Share (%), by Application 2024 & 2032
- Figure 16: South America Computed Tomography Market in Argentina Revenue (Million), by End User 2024 & 2032
- Figure 17: South America Computed Tomography Market in Argentina Revenue Share (%), by End User 2024 & 2032
- Figure 18: South America Computed Tomography Market in Argentina Revenue (Million), by Country 2024 & 2032
- Figure 19: South America Computed Tomography Market in Argentina Revenue Share (%), by Country 2024 & 2032
- Figure 20: Europe Computed Tomography Market in Argentina Revenue (Million), by Type 2024 & 2032
- Figure 21: Europe Computed Tomography Market in Argentina Revenue Share (%), by Type 2024 & 2032
- Figure 22: Europe Computed Tomography Market in Argentina Revenue (Million), by Application 2024 & 2032
- Figure 23: Europe Computed Tomography Market in Argentina Revenue Share (%), by Application 2024 & 2032
- Figure 24: Europe Computed Tomography Market in Argentina Revenue (Million), by End User 2024 & 2032
- Figure 25: Europe Computed Tomography Market in Argentina Revenue Share (%), by End User 2024 & 2032
- Figure 26: Europe Computed Tomography Market in Argentina Revenue (Million), by Country 2024 & 2032
- Figure 27: Europe Computed Tomography Market in Argentina Revenue Share (%), by Country 2024 & 2032
- Figure 28: Middle East & Africa Computed Tomography Market in Argentina Revenue (Million), by Type 2024 & 2032
- Figure 29: Middle East & Africa Computed Tomography Market in Argentina Revenue Share (%), by Type 2024 & 2032
- Figure 30: Middle East & Africa Computed Tomography Market in Argentina Revenue (Million), by Application 2024 & 2032
- Figure 31: Middle East & Africa Computed Tomography Market in Argentina Revenue Share (%), by Application 2024 & 2032
- Figure 32: Middle East & Africa Computed Tomography Market in Argentina Revenue (Million), by End User 2024 & 2032
- Figure 33: Middle East & Africa Computed Tomography Market in Argentina Revenue Share (%), by End User 2024 & 2032
- Figure 34: Middle East & Africa Computed Tomography Market in Argentina Revenue (Million), by Country 2024 & 2032
- Figure 35: Middle East & Africa Computed Tomography Market in Argentina Revenue Share (%), by Country 2024 & 2032
- Figure 36: Asia Pacific Computed Tomography Market in Argentina Revenue (Million), by Type 2024 & 2032
- Figure 37: Asia Pacific Computed Tomography Market in Argentina Revenue Share (%), by Type 2024 & 2032
- Figure 38: Asia Pacific Computed Tomography Market in Argentina Revenue (Million), by Application 2024 & 2032
- Figure 39: Asia Pacific Computed Tomography Market in Argentina Revenue Share (%), by Application 2024 & 2032
- Figure 40: Asia Pacific Computed Tomography Market in Argentina Revenue (Million), by End User 2024 & 2032
- Figure 41: Asia Pacific Computed Tomography Market in Argentina Revenue Share (%), by End User 2024 & 2032
- Figure 42: Asia Pacific Computed Tomography Market in Argentina Revenue (Million), by Country 2024 & 2032
- Figure 43: Asia Pacific Computed Tomography Market in Argentina Revenue Share (%), by Country 2024 & 2032
List of Tables
- Table 1: Global Computed Tomography Market in Argentina Revenue Million Forecast, by Region 2019 & 2032
- Table 2: Global Computed Tomography Market in Argentina Revenue Million Forecast, by Type 2019 & 2032
- Table 3: Global Computed Tomography Market in Argentina Revenue Million Forecast, by Application 2019 & 2032
- Table 4: Global Computed Tomography Market in Argentina Revenue Million Forecast, by End User 2019 & 2032
- Table 5: Global Computed Tomography Market in Argentina Revenue Million Forecast, by Region 2019 & 2032
- Table 6: Global Computed Tomography Market in Argentina Revenue Million Forecast, by Country 2019 & 2032
- Table 7: Global Computed Tomography Market in Argentina Revenue Million Forecast, by Type 2019 & 2032
- Table 8: Global Computed Tomography Market in Argentina Revenue Million Forecast, by Application 2019 & 2032
- Table 9: Global Computed Tomography Market in Argentina Revenue Million Forecast, by End User 2019 & 2032
- Table 10: Global Computed Tomography Market in Argentina Revenue Million Forecast, by Country 2019 & 2032
- Table 11: United States Computed Tomography Market in Argentina Revenue (Million) Forecast, by Application 2019 & 2032
- Table 12: Canada Computed Tomography Market in Argentina Revenue (Million) Forecast, by Application 2019 & 2032
- Table 13: Mexico Computed Tomography Market in Argentina Revenue (Million) Forecast, by Application 2019 & 2032
- Table 14: Global Computed Tomography Market in Argentina Revenue Million Forecast, by Type 2019 & 2032
- Table 15: Global Computed Tomography Market in Argentina Revenue Million Forecast, by Application 2019 & 2032
- Table 16: Global Computed Tomography Market in Argentina Revenue Million Forecast, by End User 2019 & 2032
- Table 17: Global Computed Tomography Market in Argentina Revenue Million Forecast, by Country 2019 & 2032
- Table 18: Brazil Computed Tomography Market in Argentina Revenue (Million) Forecast, by Application 2019 & 2032
- Table 19: Argentina Computed Tomography Market in Argentina Revenue (Million) Forecast, by Application 2019 & 2032
- Table 20: Rest of South America Computed Tomography Market in Argentina Revenue (Million) Forecast, by Application 2019 & 2032
- Table 21: Global Computed Tomography Market in Argentina Revenue Million Forecast, by Type 2019 & 2032
- Table 22: Global Computed Tomography Market in Argentina Revenue Million Forecast, by Application 2019 & 2032
- Table 23: Global Computed Tomography Market in Argentina Revenue Million Forecast, by End User 2019 & 2032
- Table 24: Global Computed Tomography Market in Argentina Revenue Million Forecast, by Country 2019 & 2032
- Table 25: United Kingdom Computed Tomography Market in Argentina Revenue (Million) Forecast, by Application 2019 & 2032
- Table 26: Germany Computed Tomography Market in Argentina Revenue (Million) Forecast, by Application 2019 & 2032
- Table 27: France Computed Tomography Market in Argentina Revenue (Million) Forecast, by Application 2019 & 2032
- Table 28: Italy Computed Tomography Market in Argentina Revenue (Million) Forecast, by Application 2019 & 2032
- Table 29: Spain Computed Tomography Market in Argentina Revenue (Million) Forecast, by Application 2019 & 2032
- Table 30: Russia Computed Tomography Market in Argentina Revenue (Million) Forecast, by Application 2019 & 2032
- Table 31: Benelux Computed Tomography Market in Argentina Revenue (Million) Forecast, by Application 2019 & 2032
- Table 32: Nordics Computed Tomography Market in Argentina Revenue (Million) Forecast, by Application 2019 & 2032
- Table 33: Rest of Europe Computed Tomography Market in Argentina Revenue (Million) Forecast, by Application 2019 & 2032
- Table 34: Global Computed Tomography Market in Argentina Revenue Million Forecast, by Type 2019 & 2032
- Table 35: Global Computed Tomography Market in Argentina Revenue Million Forecast, by Application 2019 & 2032
- Table 36: Global Computed Tomography Market in Argentina Revenue Million Forecast, by End User 2019 & 2032
- Table 37: Global Computed Tomography Market in Argentina Revenue Million Forecast, by Country 2019 & 2032
- Table 38: Turkey Computed Tomography Market in Argentina Revenue (Million) Forecast, by Application 2019 & 2032
- Table 39: Israel Computed Tomography Market in Argentina Revenue (Million) Forecast, by Application 2019 & 2032
- Table 40: GCC Computed Tomography Market in Argentina Revenue (Million) Forecast, by Application 2019 & 2032
- Table 41: North Africa Computed Tomography Market in Argentina Revenue (Million) Forecast, by Application 2019 & 2032
- Table 42: South Africa Computed Tomography Market in Argentina Revenue (Million) Forecast, by Application 2019 & 2032
- Table 43: Rest of Middle East & Africa Computed Tomography Market in Argentina Revenue (Million) Forecast, by Application 2019 & 2032
- Table 44: Global Computed Tomography Market in Argentina Revenue Million Forecast, by Type 2019 & 2032
- Table 45: Global Computed Tomography Market in Argentina Revenue Million Forecast, by Application 2019 & 2032
- Table 46: Global Computed Tomography Market in Argentina Revenue Million Forecast, by End User 2019 & 2032
- Table 47: Global Computed Tomography Market in Argentina Revenue Million Forecast, by Country 2019 & 2032
- Table 48: China Computed Tomography Market in Argentina Revenue (Million) Forecast, by Application 2019 & 2032
- Table 49: India Computed Tomography Market in Argentina Revenue (Million) Forecast, by Application 2019 & 2032
- Table 50: Japan Computed Tomography Market in Argentina Revenue (Million) Forecast, by Application 2019 & 2032
- Table 51: South Korea Computed Tomography Market in Argentina Revenue (Million) Forecast, by Application 2019 & 2032
- Table 52: ASEAN Computed Tomography Market in Argentina Revenue (Million) Forecast, by Application 2019 & 2032
- Table 53: Oceania Computed Tomography Market in Argentina Revenue (Million) Forecast, by Application 2019 & 2032
- Table 54: Rest of Asia Pacific Computed Tomography Market in Argentina Revenue (Million) Forecast, by Application 2019 & 2032
Frequently Asked Questions
1. What is the projected Compound Annual Growth Rate (CAGR) of the Computed Tomography Market in Argentina?
The projected CAGR is approximately 4.88%.
2. Which companies are prominent players in the Computed Tomography Market in Argentina?
Key companies in the market include GE Healthcare, Dentsply Sirona, Siemens Healthineers AG, Canon Medical Systems Corporation (Toshiba Corporation), Carestream Health, Koninklijke Philips NV, Planmeca Group (Planmed OY).
3. What are the main segments of the Computed Tomography Market in Argentina?
The market segments include Type, Application, End User.
4. Can you provide details about the market size?
The market size is estimated to be USD 140.33 Million as of 2022.
5. What are some drivers contributing to market growth?
Increasing Prevalence of Chronic Diseases; Rising Geriatric Population; Increasing Technological Advancements.
6. What are the notable trends driving market growth?
Medium Slice Segment is Expected to Hold a Significant Market Share Over the Forecast Period.
7. Are there any restraints impacting market growth?
Lack Of Proper Reimbursement And Stringent Regulatory Approval Procedures; High Cost of Equipment.
8. Can you provide examples of recent developments in the market?
In January 2021, in Córdoba, Argentina's primary public health hospital system, Konica Minolta Healthcare Americas Inc. and its strategic partner AGIMED, a healthcare provider, deployed Konica Minolta imaging management solutions.
9. What pricing options are available for accessing the report?
Pricing options include single-user, multi-user, and enterprise licenses priced at USD 3800, USD 4500, and USD 5800 respectively.
10. Is the market size provided in terms of value or volume?
The market size is provided in terms of value, measured in Million.
11. Are there any specific market keywords associated with the report?
Yes, the market keyword associated with the report is "Computed Tomography Market in Argentina," which aids in identifying and referencing the specific market segment covered.
12. How do I determine which pricing option suits my needs best?
The pricing options vary based on user requirements and access needs. Individual users may opt for single-user licenses, while businesses requiring broader access may choose multi-user or enterprise licenses for cost-effective access to the report.
13. Are there any additional resources or data provided in the Computed Tomography Market in Argentina report?
While the report offers comprehensive insights, it's advisable to review the specific contents or supplementary materials provided to ascertain if additional resources or data are available.
14. How can I stay updated on further developments or reports in the Computed Tomography Market in Argentina?
To stay informed about further developments, trends, and reports in the Computed Tomography Market in Argentina, consider subscribing to industry newsletters, following relevant companies and organizations, or regularly checking reputable industry news sources and publications.
Methodology
Step 1 - Identification of Relevant Samples Size from Population Database


Step 2 - Approaches for Defining Global Market Size (Value, Volume* & Price*)

Note*: In applicable scenarios
Step 3 - Data Sources
Primary Research
- Web Analytics
- Survey Reports
- Research Institute
- Latest Research Reports
- Opinion Leaders
Secondary Research
- Annual Reports
- White Paper
- Latest Press Release
- Industry Association
- Paid Database
- Investor Presentations

Step 4 - Data Triangulation
Involves using different sources of information in order to increase the validity of a study
These sources are likely to be stakeholders in a program - participants, other researchers, program staff, other community members, and so on.
Then we put all data in single framework & apply various statistical tools to find out the dynamic on the market.
During the analysis stage, feedback from the stakeholder groups would be compared to determine areas of agreement as well as areas of divergence
