

Key Insights
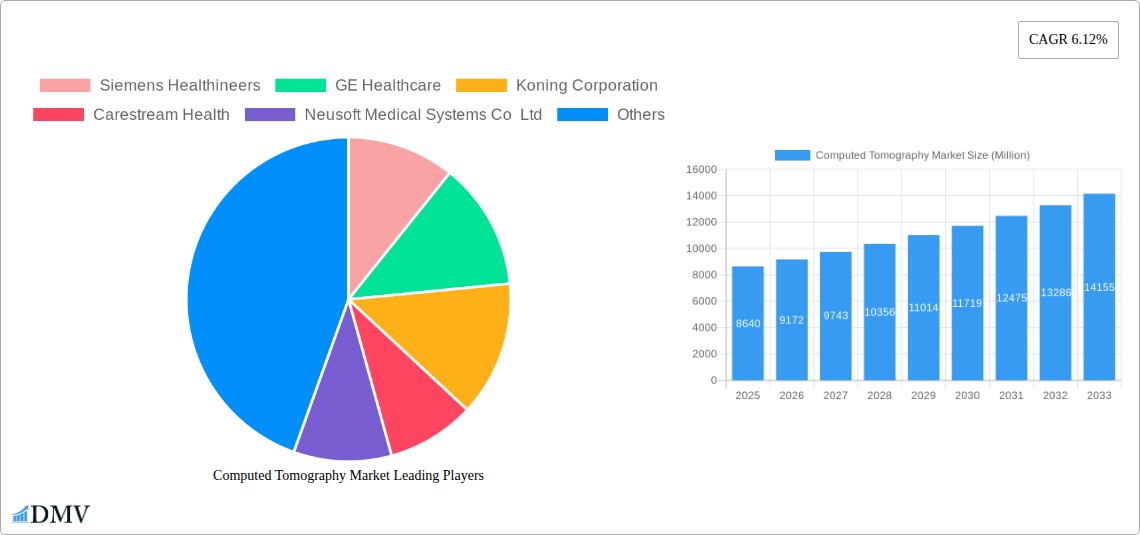
The global Computed Tomography (CT) market, valued at $8.64 billion in 2025, is projected to experience robust growth, driven by a compound annual growth rate (CAGR) of 6.12% from 2025 to 2033. This expansion is fueled by several key factors. Technological advancements, such as multi-slice CT scanners offering faster scan times and improved image quality, are enhancing diagnostic capabilities and driving adoption across various healthcare settings. The increasing prevalence of chronic diseases like cardiovascular conditions, cancer, and neurological disorders necessitates advanced imaging techniques like CT scans for accurate diagnosis and treatment planning, further boosting market demand. Furthermore, rising geriatric populations in developed and developing nations contribute significantly to the growth, as older individuals often require more frequent diagnostic imaging. The market is segmented by type (low, medium, and high slice CT scanners), application (oncology, neurology, cardiology, musculoskeletal, and others), and end-user (hospitals, diagnostic centers, and others). The high-slice CT scanner segment is expected to dominate due to its superior image resolution and speed. Geographically, North America and Europe currently hold significant market shares, driven by well-established healthcare infrastructure and high adoption rates. However, the Asia-Pacific region is anticipated to witness the fastest growth during the forecast period due to rising healthcare expenditure, expanding healthcare infrastructure, and increasing awareness of advanced diagnostic technologies.
While the market faces challenges such as high equipment costs and the need for skilled professionals to operate and interpret CT scans, these are largely offset by the significant clinical benefits and the increasing affordability of CT technology in emerging markets. The competitive landscape is shaped by key players such as Siemens Healthineers, GE Healthcare, and others, who are actively investing in research and development to enhance their product offerings and expand their market reach. The continuous innovation and technological advancements are expected to maintain the positive trajectory of the CT market throughout the forecast period, leading to a substantial increase in market size by 2033. This growth presents considerable opportunities for manufacturers, healthcare providers, and related industries.
Computed Tomography (CT) Market Report: 2019-2033
This comprehensive report provides an in-depth analysis of the Computed Tomography (CT) market, offering invaluable insights for stakeholders seeking to understand current market dynamics and future growth opportunities. The study period spans from 2019 to 2033, with 2025 serving as the base and estimated year. The report forecasts market trends from 2025 to 2033, building upon historical data from 2019 to 2024. The market is segmented by type (Low Slice, Medium Slice, High Slice), application (Oncology, Neurology, Cardiovascular, Musculoskeletal, Other Applications), and end-user (Hospitals, Diagnostic Centers, Other End Users). Key players profiled include Siemens Healthineers, GE Healthcare, Koninklijke Philips NV, and others. The global market size is projected to reach xx Million by 2033.
Computed Tomography Market Composition & Trends
This section delves into the competitive landscape of the CT market, analyzing market concentration, innovation drivers, regulatory frameworks, substitute products, end-user profiles, and mergers & acquisitions (M&A) activities. The market exhibits a moderately concentrated structure, with a few major players holding significant market share. However, the presence of numerous smaller players fosters competition and innovation.
- Market Share Distribution: Siemens Healthineers and GE Healthcare hold a combined xx% market share in 2025, while other major players such as Philips and Canon Medical Systems account for xx%. The remaining xx% is distributed among various smaller players.
- M&A Activity: The last 5 years have witnessed xx M&A deals in the CT market, with a total deal value of approximately xx Million. These transactions primarily focused on expanding product portfolios and geographic reach.
- Innovation Catalysts: Technological advancements, such as spectral CT and photon-counting CT, are driving innovation and shaping market trends. Regulatory approvals and reimbursements also play a significant role in the adoption of new technologies.
- Regulatory Landscape: Stringent regulatory requirements related to safety and efficacy are driving standardization and quality improvement across the market.
- Substitute Products: While CT scans remain the gold standard for many imaging applications, MRI and ultrasound technologies offer alternative solutions for specific clinical needs, creating a competitive environment.
- End-User Profiles: Hospitals and diagnostic centers constitute the primary end users, with a significant portion of market demand originating from developed economies and rapidly growing healthcare sectors in developing nations.
Computed Tomography Market Industry Evolution
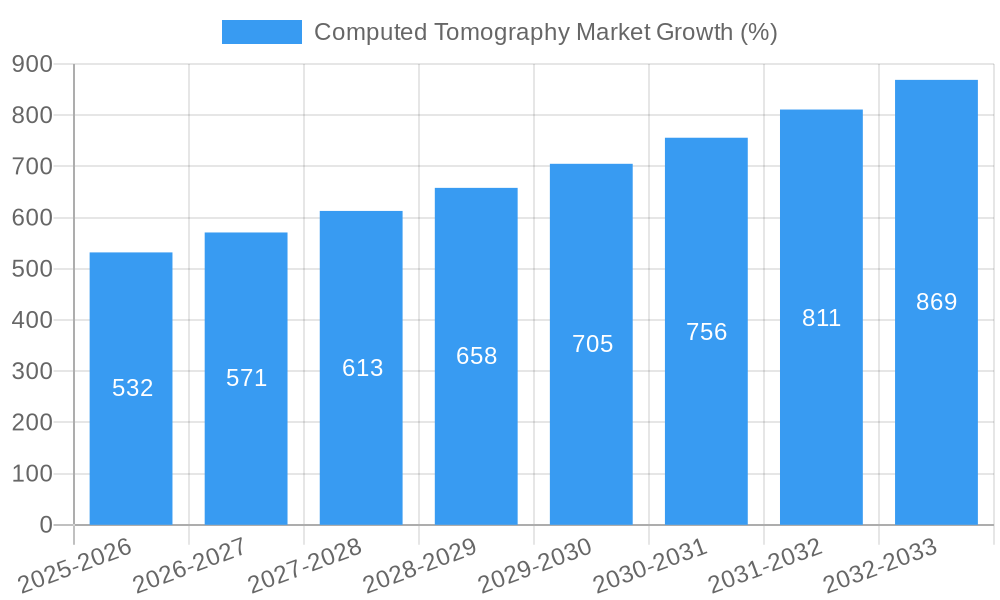
The Computed Tomography market has witnessed robust growth throughout the historical period (2019-2024), expanding at a Compound Annual Growth Rate (CAGR) of xx%. This growth is attributed to several factors: increasing prevalence of chronic diseases necessitating advanced diagnostic tools, technological advancements enhancing image quality and diagnostic accuracy, and rising healthcare spending globally. The market is expected to maintain a healthy growth trajectory throughout the forecast period (2025-2033), reaching an estimated market value of xx Million by 2033, fueled by the adoption of advanced technologies and expansion into emerging markets. Specific data points regarding the adoption of spectral CT, photon-counting CT, and AI-driven image analysis tools are analyzed within the report, demonstrating clear growth rates and impact on market penetration.
Leading Regions, Countries, or Segments in Computed Tomography Market
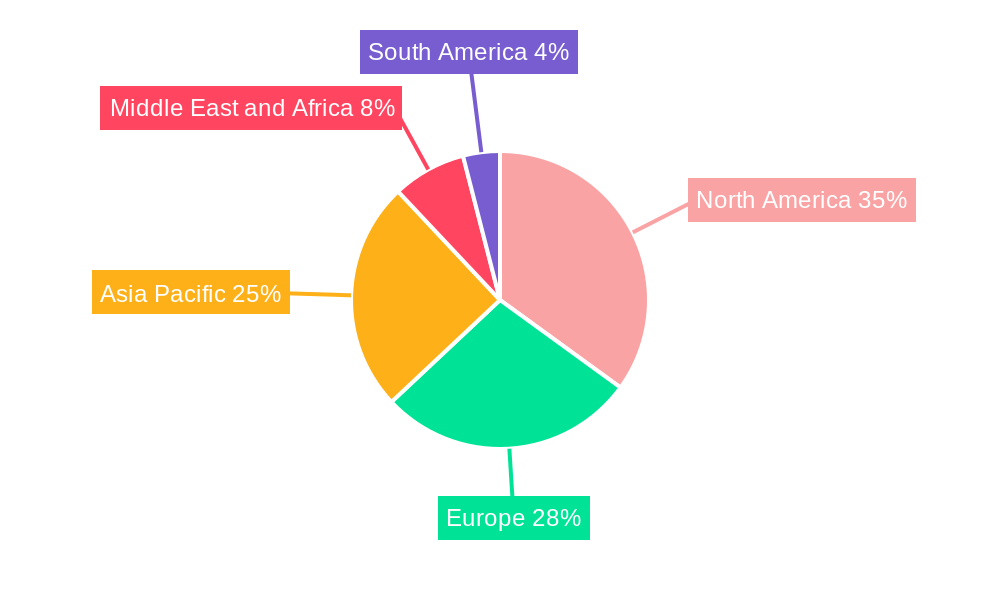
North America currently dominates the global CT market, driven by factors such as high healthcare expenditure, technological advancements, and a large installed base of CT scanners. However, Asia-Pacific is projected to experience the fastest growth during the forecast period, fueled by rising healthcare infrastructure development, increasing prevalence of chronic diseases, and growing affordability of CT scans in emerging economies like India and China.
- Key Drivers by Segment:
- Type: High-slice CT scanners are witnessing rapid growth due to their improved image quality and diagnostic capabilities.
- Application: Oncology applications account for the largest segment, driven by the increasing incidence of cancer globally.
- End User: Hospitals remain the major end-user segment, while diagnostic centers are exhibiting significant growth driven by the rising demand for outpatient imaging services.
- Geographic Dominance: North America and Europe hold the largest market share currently, while the Asia-Pacific region displays the fastest-growing trajectory. This is strongly influenced by increasing healthcare expenditure and investment in advanced medical technology within these regions.
Computed Tomography Market Product Innovations
Recent years have witnessed significant advancements in CT technology, including the introduction of spectral CT scanners offering superior diagnostic accuracy and photon-counting CT scanners providing improved image quality and reduced radiation dose. These innovations, alongside AI-powered image analysis tools, are enhancing diagnostic capabilities and streamlining workflows, increasing efficiency and precision within clinical settings. The unique selling propositions of these new technologies are emphasized through detailed analysis of their performance metrics and clinical impact, further reinforcing their market appeal.
Propelling Factors for Computed Tomography Market Growth
Several factors are driving the growth of the CT market. Firstly, technological advancements such as spectral and photon-counting CT are leading to improved image quality, reduced radiation exposure, and enhanced diagnostic capabilities. Secondly, rising healthcare expenditure globally is fueling investment in advanced medical technologies like CT scanners. Thirdly, increasing prevalence of chronic diseases like cancer and cardiovascular ailments is driving the demand for advanced diagnostic tools. Finally, favorable regulatory frameworks and reimbursements encourage wider adoption.
Obstacles in the Computed Tomography Market
Despite the positive growth outlook, several obstacles hinder the market's progression. High initial investment costs for CT scanners can pose a barrier for smaller healthcare providers. Furthermore, supply chain disruptions and component shortages can impact the availability and cost of CT scanners. Regulatory hurdles and varying reimbursement policies across different regions create challenges. Lastly, intense competition among major players can put downward pressure on prices. These factors have a quantifiable impact, affecting growth projections within the report.
Future Opportunities in Computed Tomography Market
The future of the CT market holds several promising opportunities. Expansion into emerging markets with growing healthcare infrastructure represents a significant growth avenue. Advancements in AI-powered image analysis and integration with other diagnostic technologies can improve efficiency and reduce costs. The development of portable and mobile CT systems will expand access in remote and underserved areas. Finally, increased adoption of cloud-based platforms for image storage and analysis could further enhance market growth.
Major Players in the Computed Tomography Market Ecosystem
- Siemens Healthineers (Siemens Healthineers)
- GE Healthcare (GE Healthcare)
- Koning Corporation
- Carestream Health (Carestream Health)
- Neusoft Medical Systems Co Ltd
- Stryker Corporation (Stryker Corporation)
- Koninklijke Philips NV (Koninklijke Philips NV)
- Canon Medical Systems Corporation (Canon Medical Systems Corporation)
- Planmeca Group (Planmed OY) (Planmeca)
- Shimadzu Corporation (Shimadzu Corporation)
- Fujifilm Holdings Corporation (Fujifilm Holdings Corporation)
Key Developments in Computed Tomography Market Industry
- May 2021: Royal Philips launched the spectral detector-based Spectral Computed Tomography (CT) 7500.
- November 2021: Siemens Healthineers launched the Naeotom Alpha photon-counting CT scanner.
- April 2022: Siemens commenced a new CT scanner production line in Bengaluru, India.
- April 2022: Wipro GE Healthcare launched the Revolution Aspire CT scanner, manufactured in India.
- June 2022: Trivitron Healthcare announced plans to launch made-in-India CT-Scan and MRI systems.
Strategic Computed Tomography Market Forecast
The CT market is poised for continued expansion, driven by technological innovation, increasing healthcare spending, and rising prevalence of chronic diseases. Future opportunities lie in the adoption of AI-driven diagnostics, expansion into emerging markets, and the development of more accessible and affordable CT scanning technologies. The market’s growth trajectory suggests a significant potential for expansion over the coming years.
Computed Tomography Market Segmentation
-
1. Type
- 1.1. Low Slice
- 1.2. Medium Slice
- 1.3. High Slice
-
2. Application
- 2.1. Oncology
- 2.2. Neurology
- 2.3. Cardiovascular
- 2.4. Musculoskeletal
- 2.5. Other Applications
-
3. End User
- 3.1. Hospitals
- 3.2. Diagnostic Centers
- 3.3. Other End Users
Computed Tomography Market Segmentation By Geography
-
1. North America
- 1.1. United States
- 1.2. Canada
- 1.3. Mexico
-
2. Europe
- 2.1. Germany
- 2.2. United Kingdom
- 2.3. France
- 2.4. Italy
- 2.5. Spain
- 2.6. Rest of Europe
-
3. Asia Pacific
- 3.1. China
- 3.2. Japan
- 3.3. India
- 3.4. Australia
- 3.5. South Korea
- 3.6. Rest of Asia Pacific
-
4. Middle East and Africa
- 4.1. GCC
- 4.2. South Africa
- 4.3. Rest of Middle East and Africa
-
5. South America
- 5.1. Brazil
- 5.2. Argentina
- 5.3. Rest of South America
Computed Tomography Market REPORT HIGHLIGHTS
| Aspects | Details |
|---|---|
| Study Period | 2019-2033 |
| Base Year | 2024 |
| Estimated Year | 2025 |
| Forecast Period | 2025-2033 |
| Historical Period | 2019-2024 |
| Growth Rate | CAGR of 6.12% from 2019-2033 |
| Segmentation |
|
Table of Contents
- 1. Introduction
- 1.1. Research Scope
- 1.2. Market Segmentation
- 1.3. Research Methodology
- 1.4. Definitions and Assumptions
- 2. Executive Summary
- 2.1. Introduction
- 3. Market Dynamics
- 3.1. Introduction
- 3.2. Market Drivers
- 3.2.1. Rising Geriatric Population and Increasing Incidences of Chronic Diseases; Shifting Medical Care Toward Image-guided Interventions; Technological Advancements
- 3.3. Market Restrains
- 3.3.1. Lack of Adequate Reimbursement; Stringent Regulatory Framework
- 3.4. Market Trends
- 3.4.1. The High Slice Segment is Expected to Observe Healthy Growth
- 4. Market Factor Analysis
- 4.1. Porters Five Forces
- 4.2. Supply/Value Chain
- 4.3. PESTEL analysis
- 4.4. Market Entropy
- 4.5. Patent/Trademark Analysis
- 5. Global Computed Tomography Market Analysis, Insights and Forecast, 2019-2031
- 5.1. Market Analysis, Insights and Forecast - by Type
- 5.1.1. Low Slice
- 5.1.2. Medium Slice
- 5.1.3. High Slice
- 5.2. Market Analysis, Insights and Forecast - by Application
- 5.2.1. Oncology
- 5.2.2. Neurology
- 5.2.3. Cardiovascular
- 5.2.4. Musculoskeletal
- 5.2.5. Other Applications
- 5.3. Market Analysis, Insights and Forecast - by End User
- 5.3.1. Hospitals
- 5.3.2. Diagnostic Centers
- 5.3.3. Other End Users
- 5.4. Market Analysis, Insights and Forecast - by Region
- 5.4.1. North America
- 5.4.2. Europe
- 5.4.3. Asia Pacific
- 5.4.4. Middle East and Africa
- 5.4.5. South America
- 5.1. Market Analysis, Insights and Forecast - by Type
- 6. North America Computed Tomography Market Analysis, Insights and Forecast, 2019-2031
- 6.1. Market Analysis, Insights and Forecast - by Type
- 6.1.1. Low Slice
- 6.1.2. Medium Slice
- 6.1.3. High Slice
- 6.2. Market Analysis, Insights and Forecast - by Application
- 6.2.1. Oncology
- 6.2.2. Neurology
- 6.2.3. Cardiovascular
- 6.2.4. Musculoskeletal
- 6.2.5. Other Applications
- 6.3. Market Analysis, Insights and Forecast - by End User
- 6.3.1. Hospitals
- 6.3.2. Diagnostic Centers
- 6.3.3. Other End Users
- 6.1. Market Analysis, Insights and Forecast - by Type
- 7. Europe Computed Tomography Market Analysis, Insights and Forecast, 2019-2031
- 7.1. Market Analysis, Insights and Forecast - by Type
- 7.1.1. Low Slice
- 7.1.2. Medium Slice
- 7.1.3. High Slice
- 7.2. Market Analysis, Insights and Forecast - by Application
- 7.2.1. Oncology
- 7.2.2. Neurology
- 7.2.3. Cardiovascular
- 7.2.4. Musculoskeletal
- 7.2.5. Other Applications
- 7.3. Market Analysis, Insights and Forecast - by End User
- 7.3.1. Hospitals
- 7.3.2. Diagnostic Centers
- 7.3.3. Other End Users
- 7.1. Market Analysis, Insights and Forecast - by Type
- 8. Asia Pacific Computed Tomography Market Analysis, Insights and Forecast, 2019-2031
- 8.1. Market Analysis, Insights and Forecast - by Type
- 8.1.1. Low Slice
- 8.1.2. Medium Slice
- 8.1.3. High Slice
- 8.2. Market Analysis, Insights and Forecast - by Application
- 8.2.1. Oncology
- 8.2.2. Neurology
- 8.2.3. Cardiovascular
- 8.2.4. Musculoskeletal
- 8.2.5. Other Applications
- 8.3. Market Analysis, Insights and Forecast - by End User
- 8.3.1. Hospitals
- 8.3.2. Diagnostic Centers
- 8.3.3. Other End Users
- 8.1. Market Analysis, Insights and Forecast - by Type
- 9. Middle East and Africa Computed Tomography Market Analysis, Insights and Forecast, 2019-2031
- 9.1. Market Analysis, Insights and Forecast - by Type
- 9.1.1. Low Slice
- 9.1.2. Medium Slice
- 9.1.3. High Slice
- 9.2. Market Analysis, Insights and Forecast - by Application
- 9.2.1. Oncology
- 9.2.2. Neurology
- 9.2.3. Cardiovascular
- 9.2.4. Musculoskeletal
- 9.2.5. Other Applications
- 9.3. Market Analysis, Insights and Forecast - by End User
- 9.3.1. Hospitals
- 9.3.2. Diagnostic Centers
- 9.3.3. Other End Users
- 9.1. Market Analysis, Insights and Forecast - by Type
- 10. South America Computed Tomography Market Analysis, Insights and Forecast, 2019-2031
- 10.1. Market Analysis, Insights and Forecast - by Type
- 10.1.1. Low Slice
- 10.1.2. Medium Slice
- 10.1.3. High Slice
- 10.2. Market Analysis, Insights and Forecast - by Application
- 10.2.1. Oncology
- 10.2.2. Neurology
- 10.2.3. Cardiovascular
- 10.2.4. Musculoskeletal
- 10.2.5. Other Applications
- 10.3. Market Analysis, Insights and Forecast - by End User
- 10.3.1. Hospitals
- 10.3.2. Diagnostic Centers
- 10.3.3. Other End Users
- 10.1. Market Analysis, Insights and Forecast - by Type
- 11. North America Computed Tomography Market Analysis, Insights and Forecast, 2019-2031
- 11.1. Market Analysis, Insights and Forecast - By Country/Sub-region
- 11.1.1 United States
- 11.1.2 Canada
- 11.1.3 Mexico
- 12. Europe Computed Tomography Market Analysis, Insights and Forecast, 2019-2031
- 12.1. Market Analysis, Insights and Forecast - By Country/Sub-region
- 12.1.1 Germany
- 12.1.2 United Kingdom
- 12.1.3 France
- 12.1.4 Italy
- 12.1.5 Spain
- 12.1.6 Rest of Europe
- 13. Asia Pacific Computed Tomography Market Analysis, Insights and Forecast, 2019-2031
- 13.1. Market Analysis, Insights and Forecast - By Country/Sub-region
- 13.1.1 China
- 13.1.2 Japan
- 13.1.3 India
- 13.1.4 Australia
- 13.1.5 South Korea
- 13.1.6 Rest of Asia Pacific
- 14. Middle East and Africa Computed Tomography Market Analysis, Insights and Forecast, 2019-2031
- 14.1. Market Analysis, Insights and Forecast - By Country/Sub-region
- 14.1.1 GCC
- 14.1.2 South Africa
- 14.1.3 Rest of Middle East and Africa
- 15. South America Computed Tomography Market Analysis, Insights and Forecast, 2019-2031
- 15.1. Market Analysis, Insights and Forecast - By Country/Sub-region
- 15.1.1 Brazil
- 15.1.2 Argentina
- 15.1.3 Rest of South America
- 16. Competitive Analysis
- 16.1. Global Market Share Analysis 2024
- 16.2. Company Profiles
- 16.2.1 Siemens Healthineers
- 16.2.1.1. Overview
- 16.2.1.2. Products
- 16.2.1.3. SWOT Analysis
- 16.2.1.4. Recent Developments
- 16.2.1.5. Financials (Based on Availability)
- 16.2.2 GE Healthcare
- 16.2.2.1. Overview
- 16.2.2.2. Products
- 16.2.2.3. SWOT Analysis
- 16.2.2.4. Recent Developments
- 16.2.2.5. Financials (Based on Availability)
- 16.2.3 Koning Corporation
- 16.2.3.1. Overview
- 16.2.3.2. Products
- 16.2.3.3. SWOT Analysis
- 16.2.3.4. Recent Developments
- 16.2.3.5. Financials (Based on Availability)
- 16.2.4 Carestream Health
- 16.2.4.1. Overview
- 16.2.4.2. Products
- 16.2.4.3. SWOT Analysis
- 16.2.4.4. Recent Developments
- 16.2.4.5. Financials (Based on Availability)
- 16.2.5 Neusoft Medical Systems Co Ltd
- 16.2.5.1. Overview
- 16.2.5.2. Products
- 16.2.5.3. SWOT Analysis
- 16.2.5.4. Recent Developments
- 16.2.5.5. Financials (Based on Availability)
- 16.2.6 Stryker Corporation
- 16.2.6.1. Overview
- 16.2.6.2. Products
- 16.2.6.3. SWOT Analysis
- 16.2.6.4. Recent Developments
- 16.2.6.5. Financials (Based on Availability)
- 16.2.7 Koninklijke Philips NV
- 16.2.7.1. Overview
- 16.2.7.2. Products
- 16.2.7.3. SWOT Analysis
- 16.2.7.4. Recent Developments
- 16.2.7.5. Financials (Based on Availability)
- 16.2.8 Canon Medical Systems Corporation
- 16.2.8.1. Overview
- 16.2.8.2. Products
- 16.2.8.3. SWOT Analysis
- 16.2.8.4. Recent Developments
- 16.2.8.5. Financials (Based on Availability)
- 16.2.9 Planmeca Group (Planmed OY)
- 16.2.9.1. Overview
- 16.2.9.2. Products
- 16.2.9.3. SWOT Analysis
- 16.2.9.4. Recent Developments
- 16.2.9.5. Financials (Based on Availability)
- 16.2.10 Shimadzu Corporation
- 16.2.10.1. Overview
- 16.2.10.2. Products
- 16.2.10.3. SWOT Analysis
- 16.2.10.4. Recent Developments
- 16.2.10.5. Financials (Based on Availability)
- 16.2.11 Fujifilm Holdings Corporation
- 16.2.11.1. Overview
- 16.2.11.2. Products
- 16.2.11.3. SWOT Analysis
- 16.2.11.4. Recent Developments
- 16.2.11.5. Financials (Based on Availability)
- 16.2.1 Siemens Healthineers
List of Figures
- Figure 1: Global Computed Tomography Market Revenue Breakdown (Million, %) by Region 2024 & 2032
- Figure 2: North America Computed Tomography Market Revenue (Million), by Country 2024 & 2032
- Figure 3: North America Computed Tomography Market Revenue Share (%), by Country 2024 & 2032
- Figure 4: Europe Computed Tomography Market Revenue (Million), by Country 2024 & 2032
- Figure 5: Europe Computed Tomography Market Revenue Share (%), by Country 2024 & 2032
- Figure 6: Asia Pacific Computed Tomography Market Revenue (Million), by Country 2024 & 2032
- Figure 7: Asia Pacific Computed Tomography Market Revenue Share (%), by Country 2024 & 2032
- Figure 8: Middle East and Africa Computed Tomography Market Revenue (Million), by Country 2024 & 2032
- Figure 9: Middle East and Africa Computed Tomography Market Revenue Share (%), by Country 2024 & 2032
- Figure 10: South America Computed Tomography Market Revenue (Million), by Country 2024 & 2032
- Figure 11: South America Computed Tomography Market Revenue Share (%), by Country 2024 & 2032
- Figure 12: North America Computed Tomography Market Revenue (Million), by Type 2024 & 2032
- Figure 13: North America Computed Tomography Market Revenue Share (%), by Type 2024 & 2032
- Figure 14: North America Computed Tomography Market Revenue (Million), by Application 2024 & 2032
- Figure 15: North America Computed Tomography Market Revenue Share (%), by Application 2024 & 2032
- Figure 16: North America Computed Tomography Market Revenue (Million), by End User 2024 & 2032
- Figure 17: North America Computed Tomography Market Revenue Share (%), by End User 2024 & 2032
- Figure 18: North America Computed Tomography Market Revenue (Million), by Country 2024 & 2032
- Figure 19: North America Computed Tomography Market Revenue Share (%), by Country 2024 & 2032
- Figure 20: Europe Computed Tomography Market Revenue (Million), by Type 2024 & 2032
- Figure 21: Europe Computed Tomography Market Revenue Share (%), by Type 2024 & 2032
- Figure 22: Europe Computed Tomography Market Revenue (Million), by Application 2024 & 2032
- Figure 23: Europe Computed Tomography Market Revenue Share (%), by Application 2024 & 2032
- Figure 24: Europe Computed Tomography Market Revenue (Million), by End User 2024 & 2032
- Figure 25: Europe Computed Tomography Market Revenue Share (%), by End User 2024 & 2032
- Figure 26: Europe Computed Tomography Market Revenue (Million), by Country 2024 & 2032
- Figure 27: Europe Computed Tomography Market Revenue Share (%), by Country 2024 & 2032
- Figure 28: Asia Pacific Computed Tomography Market Revenue (Million), by Type 2024 & 2032
- Figure 29: Asia Pacific Computed Tomography Market Revenue Share (%), by Type 2024 & 2032
- Figure 30: Asia Pacific Computed Tomography Market Revenue (Million), by Application 2024 & 2032
- Figure 31: Asia Pacific Computed Tomography Market Revenue Share (%), by Application 2024 & 2032
- Figure 32: Asia Pacific Computed Tomography Market Revenue (Million), by End User 2024 & 2032
- Figure 33: Asia Pacific Computed Tomography Market Revenue Share (%), by End User 2024 & 2032
- Figure 34: Asia Pacific Computed Tomography Market Revenue (Million), by Country 2024 & 2032
- Figure 35: Asia Pacific Computed Tomography Market Revenue Share (%), by Country 2024 & 2032
- Figure 36: Middle East and Africa Computed Tomography Market Revenue (Million), by Type 2024 & 2032
- Figure 37: Middle East and Africa Computed Tomography Market Revenue Share (%), by Type 2024 & 2032
- Figure 38: Middle East and Africa Computed Tomography Market Revenue (Million), by Application 2024 & 2032
- Figure 39: Middle East and Africa Computed Tomography Market Revenue Share (%), by Application 2024 & 2032
- Figure 40: Middle East and Africa Computed Tomography Market Revenue (Million), by End User 2024 & 2032
- Figure 41: Middle East and Africa Computed Tomography Market Revenue Share (%), by End User 2024 & 2032
- Figure 42: Middle East and Africa Computed Tomography Market Revenue (Million), by Country 2024 & 2032
- Figure 43: Middle East and Africa Computed Tomography Market Revenue Share (%), by Country 2024 & 2032
- Figure 44: South America Computed Tomography Market Revenue (Million), by Type 2024 & 2032
- Figure 45: South America Computed Tomography Market Revenue Share (%), by Type 2024 & 2032
- Figure 46: South America Computed Tomography Market Revenue (Million), by Application 2024 & 2032
- Figure 47: South America Computed Tomography Market Revenue Share (%), by Application 2024 & 2032
- Figure 48: South America Computed Tomography Market Revenue (Million), by End User 2024 & 2032
- Figure 49: South America Computed Tomography Market Revenue Share (%), by End User 2024 & 2032
- Figure 50: South America Computed Tomography Market Revenue (Million), by Country 2024 & 2032
- Figure 51: South America Computed Tomography Market Revenue Share (%), by Country 2024 & 2032
List of Tables
- Table 1: Global Computed Tomography Market Revenue Million Forecast, by Region 2019 & 2032
- Table 2: Global Computed Tomography Market Revenue Million Forecast, by Type 2019 & 2032
- Table 3: Global Computed Tomography Market Revenue Million Forecast, by Application 2019 & 2032
- Table 4: Global Computed Tomography Market Revenue Million Forecast, by End User 2019 & 2032
- Table 5: Global Computed Tomography Market Revenue Million Forecast, by Region 2019 & 2032
- Table 6: Global Computed Tomography Market Revenue Million Forecast, by Country 2019 & 2032
- Table 7: United States Computed Tomography Market Revenue (Million) Forecast, by Application 2019 & 2032
- Table 8: Canada Computed Tomography Market Revenue (Million) Forecast, by Application 2019 & 2032
- Table 9: Mexico Computed Tomography Market Revenue (Million) Forecast, by Application 2019 & 2032
- Table 10: Global Computed Tomography Market Revenue Million Forecast, by Country 2019 & 2032
- Table 11: Germany Computed Tomography Market Revenue (Million) Forecast, by Application 2019 & 2032
- Table 12: United Kingdom Computed Tomography Market Revenue (Million) Forecast, by Application 2019 & 2032
- Table 13: France Computed Tomography Market Revenue (Million) Forecast, by Application 2019 & 2032
- Table 14: Italy Computed Tomography Market Revenue (Million) Forecast, by Application 2019 & 2032
- Table 15: Spain Computed Tomography Market Revenue (Million) Forecast, by Application 2019 & 2032
- Table 16: Rest of Europe Computed Tomography Market Revenue (Million) Forecast, by Application 2019 & 2032
- Table 17: Global Computed Tomography Market Revenue Million Forecast, by Country 2019 & 2032
- Table 18: China Computed Tomography Market Revenue (Million) Forecast, by Application 2019 & 2032
- Table 19: Japan Computed Tomography Market Revenue (Million) Forecast, by Application 2019 & 2032
- Table 20: India Computed Tomography Market Revenue (Million) Forecast, by Application 2019 & 2032
- Table 21: Australia Computed Tomography Market Revenue (Million) Forecast, by Application 2019 & 2032
- Table 22: South Korea Computed Tomography Market Revenue (Million) Forecast, by Application 2019 & 2032
- Table 23: Rest of Asia Pacific Computed Tomography Market Revenue (Million) Forecast, by Application 2019 & 2032
- Table 24: Global Computed Tomography Market Revenue Million Forecast, by Country 2019 & 2032
- Table 25: GCC Computed Tomography Market Revenue (Million) Forecast, by Application 2019 & 2032
- Table 26: South Africa Computed Tomography Market Revenue (Million) Forecast, by Application 2019 & 2032
- Table 27: Rest of Middle East and Africa Computed Tomography Market Revenue (Million) Forecast, by Application 2019 & 2032
- Table 28: Global Computed Tomography Market Revenue Million Forecast, by Country 2019 & 2032
- Table 29: Brazil Computed Tomography Market Revenue (Million) Forecast, by Application 2019 & 2032
- Table 30: Argentina Computed Tomography Market Revenue (Million) Forecast, by Application 2019 & 2032
- Table 31: Rest of South America Computed Tomography Market Revenue (Million) Forecast, by Application 2019 & 2032
- Table 32: Global Computed Tomography Market Revenue Million Forecast, by Type 2019 & 2032
- Table 33: Global Computed Tomography Market Revenue Million Forecast, by Application 2019 & 2032
- Table 34: Global Computed Tomography Market Revenue Million Forecast, by End User 2019 & 2032
- Table 35: Global Computed Tomography Market Revenue Million Forecast, by Country 2019 & 2032
- Table 36: United States Computed Tomography Market Revenue (Million) Forecast, by Application 2019 & 2032
- Table 37: Canada Computed Tomography Market Revenue (Million) Forecast, by Application 2019 & 2032
- Table 38: Mexico Computed Tomography Market Revenue (Million) Forecast, by Application 2019 & 2032
- Table 39: Global Computed Tomography Market Revenue Million Forecast, by Type 2019 & 2032
- Table 40: Global Computed Tomography Market Revenue Million Forecast, by Application 2019 & 2032
- Table 41: Global Computed Tomography Market Revenue Million Forecast, by End User 2019 & 2032
- Table 42: Global Computed Tomography Market Revenue Million Forecast, by Country 2019 & 2032
- Table 43: Germany Computed Tomography Market Revenue (Million) Forecast, by Application 2019 & 2032
- Table 44: United Kingdom Computed Tomography Market Revenue (Million) Forecast, by Application 2019 & 2032
- Table 45: France Computed Tomography Market Revenue (Million) Forecast, by Application 2019 & 2032
- Table 46: Italy Computed Tomography Market Revenue (Million) Forecast, by Application 2019 & 2032
- Table 47: Spain Computed Tomography Market Revenue (Million) Forecast, by Application 2019 & 2032
- Table 48: Rest of Europe Computed Tomography Market Revenue (Million) Forecast, by Application 2019 & 2032
- Table 49: Global Computed Tomography Market Revenue Million Forecast, by Type 2019 & 2032
- Table 50: Global Computed Tomography Market Revenue Million Forecast, by Application 2019 & 2032
- Table 51: Global Computed Tomography Market Revenue Million Forecast, by End User 2019 & 2032
- Table 52: Global Computed Tomography Market Revenue Million Forecast, by Country 2019 & 2032
- Table 53: China Computed Tomography Market Revenue (Million) Forecast, by Application 2019 & 2032
- Table 54: Japan Computed Tomography Market Revenue (Million) Forecast, by Application 2019 & 2032
- Table 55: India Computed Tomography Market Revenue (Million) Forecast, by Application 2019 & 2032
- Table 56: Australia Computed Tomography Market Revenue (Million) Forecast, by Application 2019 & 2032
- Table 57: South Korea Computed Tomography Market Revenue (Million) Forecast, by Application 2019 & 2032
- Table 58: Rest of Asia Pacific Computed Tomography Market Revenue (Million) Forecast, by Application 2019 & 2032
- Table 59: Global Computed Tomography Market Revenue Million Forecast, by Type 2019 & 2032
- Table 60: Global Computed Tomography Market Revenue Million Forecast, by Application 2019 & 2032
- Table 61: Global Computed Tomography Market Revenue Million Forecast, by End User 2019 & 2032
- Table 62: Global Computed Tomography Market Revenue Million Forecast, by Country 2019 & 2032
- Table 63: GCC Computed Tomography Market Revenue (Million) Forecast, by Application 2019 & 2032
- Table 64: South Africa Computed Tomography Market Revenue (Million) Forecast, by Application 2019 & 2032
- Table 65: Rest of Middle East and Africa Computed Tomography Market Revenue (Million) Forecast, by Application 2019 & 2032
- Table 66: Global Computed Tomography Market Revenue Million Forecast, by Type 2019 & 2032
- Table 67: Global Computed Tomography Market Revenue Million Forecast, by Application 2019 & 2032
- Table 68: Global Computed Tomography Market Revenue Million Forecast, by End User 2019 & 2032
- Table 69: Global Computed Tomography Market Revenue Million Forecast, by Country 2019 & 2032
- Table 70: Brazil Computed Tomography Market Revenue (Million) Forecast, by Application 2019 & 2032
- Table 71: Argentina Computed Tomography Market Revenue (Million) Forecast, by Application 2019 & 2032
- Table 72: Rest of South America Computed Tomography Market Revenue (Million) Forecast, by Application 2019 & 2032
Frequently Asked Questions
1. What is the projected Compound Annual Growth Rate (CAGR) of the Computed Tomography Market?
The projected CAGR is approximately 6.12%.
2. Which companies are prominent players in the Computed Tomography Market?
Key companies in the market include Siemens Healthineers, GE Healthcare, Koning Corporation, Carestream Health, Neusoft Medical Systems Co Ltd, Stryker Corporation, Koninklijke Philips NV, Canon Medical Systems Corporation, Planmeca Group (Planmed OY), Shimadzu Corporation, Fujifilm Holdings Corporation.
3. What are the main segments of the Computed Tomography Market?
The market segments include Type, Application, End User.
4. Can you provide details about the market size?
The market size is estimated to be USD 8.64 Million as of 2022.
5. What are some drivers contributing to market growth?
Rising Geriatric Population and Increasing Incidences of Chronic Diseases; Shifting Medical Care Toward Image-guided Interventions; Technological Advancements.
6. What are the notable trends driving market growth?
The High Slice Segment is Expected to Observe Healthy Growth.
7. Are there any restraints impacting market growth?
Lack of Adequate Reimbursement; Stringent Regulatory Framework.
8. Can you provide examples of recent developments in the market?
June 2022: Trivitron Healthcare announced plans to launch made-in-India CT-Scan and MRI systems in fiscal year 2022-23. It will be for both Indian and international markets, and it will be used for better diagnosis in remote areas too because of its smart features, cost, and portability.
9. What pricing options are available for accessing the report?
Pricing options include single-user, multi-user, and enterprise licenses priced at USD 4750, USD 5250, and USD 8750 respectively.
10. Is the market size provided in terms of value or volume?
The market size is provided in terms of value, measured in Million.
11. Are there any specific market keywords associated with the report?
Yes, the market keyword associated with the report is "Computed Tomography Market," which aids in identifying and referencing the specific market segment covered.
12. How do I determine which pricing option suits my needs best?
The pricing options vary based on user requirements and access needs. Individual users may opt for single-user licenses, while businesses requiring broader access may choose multi-user or enterprise licenses for cost-effective access to the report.
13. Are there any additional resources or data provided in the Computed Tomography Market report?
While the report offers comprehensive insights, it's advisable to review the specific contents or supplementary materials provided to ascertain if additional resources or data are available.
14. How can I stay updated on further developments or reports in the Computed Tomography Market?
To stay informed about further developments, trends, and reports in the Computed Tomography Market, consider subscribing to industry newsletters, following relevant companies and organizations, or regularly checking reputable industry news sources and publications.
Methodology
Step 1 - Identification of Relevant Samples Size from Population Database


Step 2 - Approaches for Defining Global Market Size (Value, Volume* & Price*)

Note*: In applicable scenarios
Step 3 - Data Sources
Primary Research
- Web Analytics
- Survey Reports
- Research Institute
- Latest Research Reports
- Opinion Leaders
Secondary Research
- Annual Reports
- White Paper
- Latest Press Release
- Industry Association
- Paid Database
- Investor Presentations

Step 4 - Data Triangulation
Involves using different sources of information in order to increase the validity of a study
These sources are likely to be stakeholders in a program - participants, other researchers, program staff, other community members, and so on.
Then we put all data in single framework & apply various statistical tools to find out the dynamic on the market.
During the analysis stage, feedback from the stakeholder groups would be compared to determine areas of agreement as well as areas of divergence
