

Key Insights
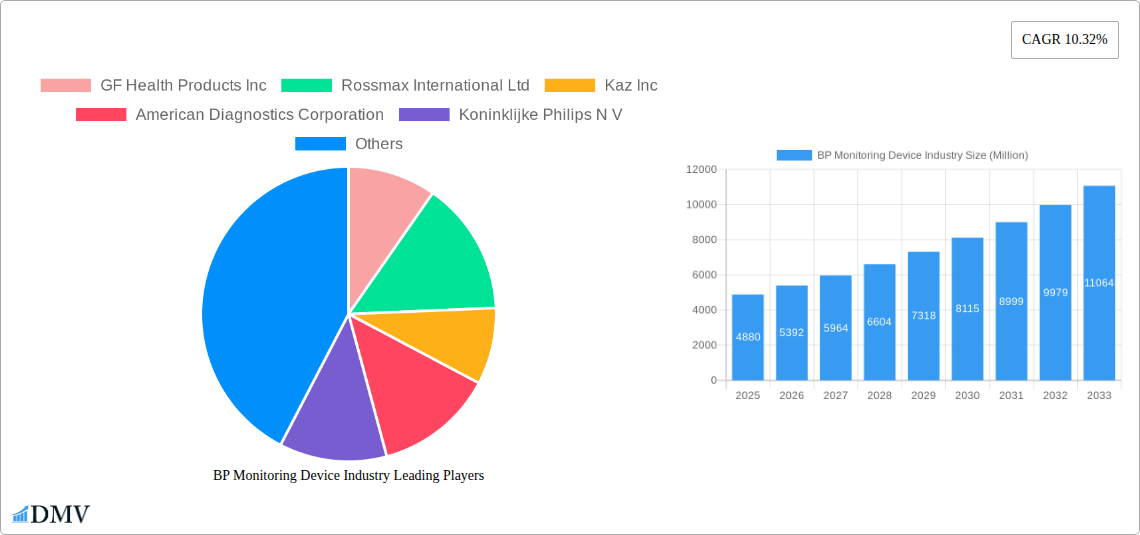
The global blood pressure (BP) monitoring device market, valued at $4.88 billion in 2025, is projected to experience robust growth, driven by several key factors. The increasing prevalence of hypertension and cardiovascular diseases globally fuels significant demand for accurate and convenient BP monitoring solutions. Technological advancements, such as the development of sophisticated digital and automated BP monitors with features like connectivity and data logging, are enhancing user experience and improving healthcare management. Furthermore, rising healthcare expenditure and growing awareness regarding self-health monitoring among consumers are contributing to market expansion. The home setting segment is expected to witness substantial growth due to the increasing preference for convenient at-home monitoring and telehealth initiatives. This segment benefits from the rising adoption of connected devices facilitating remote patient monitoring. Competition within the market is intense, with established players like Omron, Philips, and Microlife alongside emerging companies continually innovating to capture market share. The market is segmented by product type (sphygmomanometers, automated/digital monitors, and accessories) and end-user (hospitals, clinics, ambulatory surgical centers, and home settings). Geographical expansion is also expected, with developing economies witnessing notable growth fueled by increasing healthcare infrastructure development and rising disposable incomes.
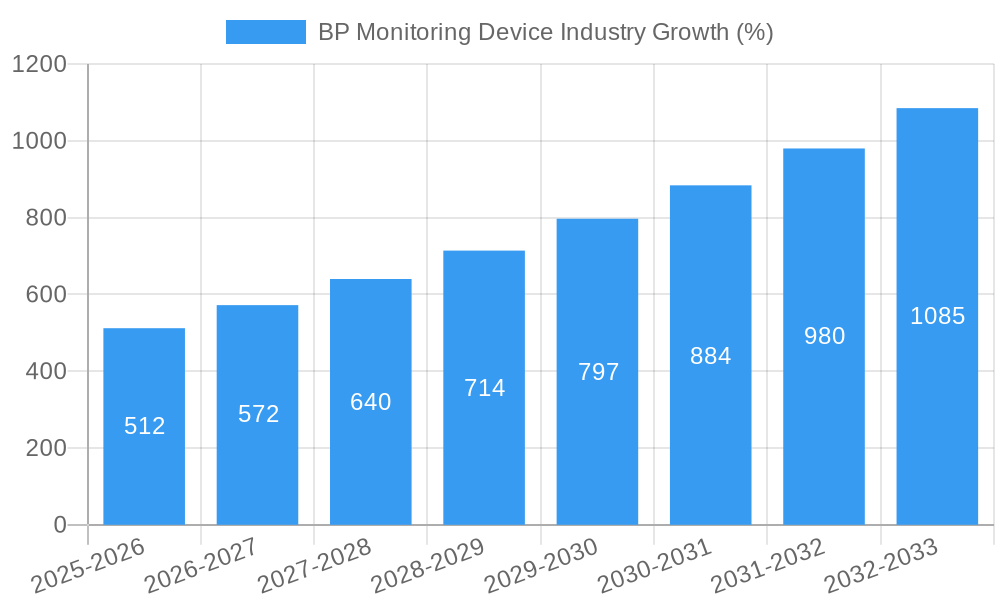
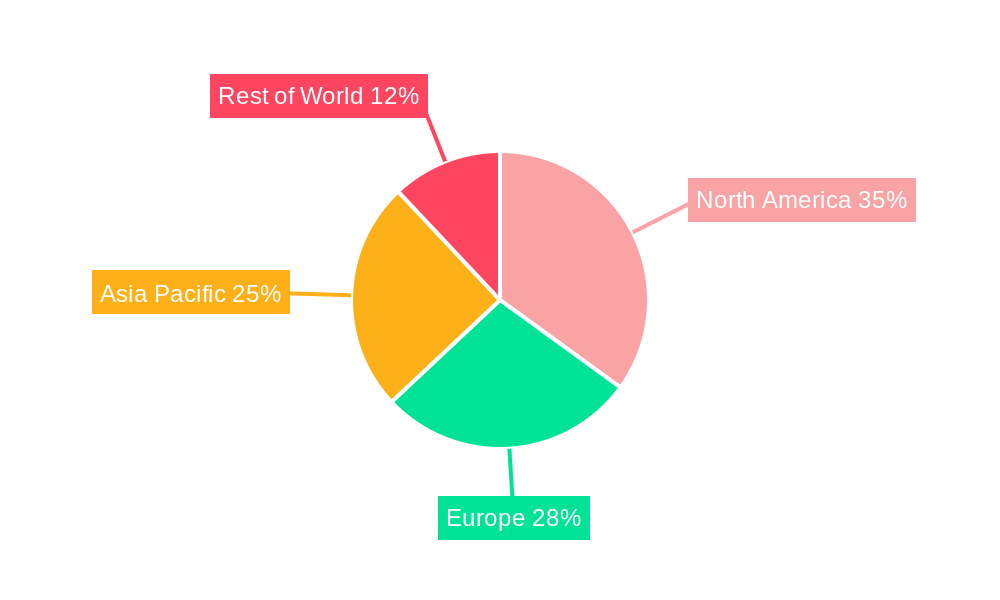
While North America currently holds a significant market share due to high healthcare expenditure and technological advancements, regions like Asia-Pacific are expected to witness faster growth rates driven by increasing awareness, rising incidence of hypertension, and expanding healthcare infrastructure. However, factors like high costs associated with advanced monitoring devices and the need for continuous calibration in some cases could potentially restrain market growth to some extent. The market is expected to maintain a Compound Annual Growth Rate (CAGR) of 10.32% throughout the forecast period (2025-2033), indicating substantial potential for continued expansion. Companies are strategically focusing on product innovation, partnerships, and acquisitions to enhance their market position and cater to the evolving needs of healthcare professionals and consumers.
BP Monitoring Device Industry: A Comprehensive Market Report (2019-2033)
This insightful report provides a detailed analysis of the global BP monitoring device industry, encompassing market size, segmentation, leading players, technological advancements, and future growth prospects. The study period covers 2019-2033, with 2025 as the base and estimated year. The forecast period spans 2025-2033, and the historical period encompasses 2019-2024. The report offers invaluable insights for stakeholders, investors, and industry professionals seeking to understand this dynamic market. The global market size is estimated at $XX Million in 2025 and is projected to reach $XX Million by 2033, exhibiting a CAGR of XX% during the forecast period.
BP Monitoring Device Industry Market Composition & Trends
This section delves into the competitive landscape of the BP monitoring device market, analyzing market concentration, innovation drivers, regulatory frameworks, substitute products, end-user profiles, and mergers & acquisitions (M&A) activities. The market is moderately fragmented, with key players such as GF Health Products Inc, Rossmax International Ltd, Kaz Inc, American Diagnostics Corporation, Koninklijke Philips N.V., Withings, A&D Medical Inc, Microlife AG, General Electric Company (GE Healthcare), and Omron Healthcare Inc vying for market share.
- Market Share Distribution: Omron Healthcare and Philips hold a significant portion of the market (approximately XX% combined in 2025), while other players contribute to the remaining share. The market share distribution is expected to see some shifts during the forecast period due to emerging technologies and new market entrants.
- Innovation Catalysts: The continuous demand for accurate, user-friendly, and technologically advanced BP monitoring devices is driving innovation. This includes the development of wearable and continuous ABPM devices, as well as improved accuracy and connectivity features.
- Regulatory Landscape: Stringent regulatory approvals and safety standards vary across geographies. Compliance is a critical factor for manufacturers to consider.
- Substitute Products: While no direct substitutes exist, advancements in alternative diagnostic methods could indirectly influence market growth.
- End-User Profiles: The primary end-users include hospitals and clinics, ambulatory surgical centers, and the home setting. The home setting segment is experiencing significant growth fueled by the rising prevalence of hypertension and increased consumer awareness.
- M&A Activities: The past five years have witnessed a moderate number of M&A activities, with deal values ranging from $XX Million to $XX Million, primarily focused on technological integration and market expansion.
BP Monitoring Device Industry Industry Evolution
This section examines the evolutionary trajectory of the BP monitoring device market, including market growth patterns, technological advancements, and changing consumer preferences. The market has shown steady growth over the historical period (2019-2024), driven by increasing prevalence of hypertension, technological advancements in device accuracy and features, and rising healthcare expenditure. The adoption rate of digital and automated BP monitors has significantly increased, surpassing that of traditional sphygmomanometers. Future growth will be largely influenced by the expanding adoption of wearable and continuous BP monitoring technologies, increased demand for remote patient monitoring systems, and the growing preference for convenient and user-friendly devices within the home setting. Technological advancements such as AI-powered diagnostic tools and improved connectivity features will play a significant role in market evolution. Consumer demand is shifting towards devices offering enhanced accuracy, ease of use, and data connectivity for efficient health management. The market experienced a growth rate of XX% from 2021 to 2024, indicating a robust upward trend.
Leading Regions, Countries, or Segments in BP Monitoring Device Industry
The North American region currently dominates the global BP monitoring device market, driven by high healthcare expenditure, technological advancements, and a significant elderly population. However, Asia-Pacific is projected to exhibit the fastest growth rate during the forecast period, spurred by rising healthcare awareness, expanding healthcare infrastructure, and a growing prevalence of hypertension.
By Product:
- Automated/Digital Blood Pressure Monitor: This segment holds the largest market share, propelled by its ease of use, accuracy, and data storage capabilities.
- Sphygmomanometer/Aneroid BP Monitor: This traditional method retains a market presence, particularly in lower-income regions and for basic home use.
- Non-Portable (Upper Arm): Instrument Accessories: This segment exhibits steady growth due to increased use of advanced BP monitoring systems in hospitals and clinics.
By End User:
- Home Setting: This segment shows significant growth potential due to increasing consumer preference for self-monitoring and the convenience of at-home testing.
- Hospitals and Clinics: This segment remains a substantial market, driven by the need for accurate and reliable BP measurement in healthcare settings.
- Ambulatory Surgical Centers: This niche segment is growing moderately, owing to increased demand for efficient BP monitoring in ambulatory surgical settings.
Key drivers for growth include increased investment in healthcare infrastructure, government initiatives to promote preventive healthcare, and rising awareness of cardiovascular diseases. Regulatory support for telehealth and remote patient monitoring is also boosting market growth.
BP Monitoring Device Industry Product Innovations
Recent innovations include wearable and continuous ABPM devices, offering real-time BP monitoring and enhanced patient convenience. These devices leverage advanced sensor technologies and sophisticated algorithms to ensure accurate measurements. Wireless connectivity features allow seamless data transfer to healthcare providers, enabling remote patient management and improved care. The integration of artificial intelligence (AI) is further improving diagnostic capabilities and enhancing the overall user experience.
Propelling Factors for BP Monitoring Device Industry Growth
Several factors drive the growth of the BP monitoring device industry. The increasing prevalence of hypertension globally is a significant factor, leading to higher demand for accurate and convenient BP monitoring solutions. Technological advancements, such as the development of wireless, wearable, and AI-powered devices, are increasing accessibility and improving accuracy. Favorable regulatory environments, such as supportive reimbursement policies and approvals for remote patient monitoring systems, are stimulating market expansion. Finally, rising consumer awareness regarding cardiovascular health is further boosting market growth.
Obstacles in the BP Monitoring Device Industry Market
The industry faces challenges such as stringent regulatory requirements for device approval and safety standards, which can increase development costs and timelines. Supply chain disruptions, particularly regarding critical components, can impact production and market availability. Intense competition from both established players and new entrants creates price pressure and requires continuous innovation to maintain a competitive edge.
Future Opportunities in BP Monitoring Device Industry
Emerging opportunities exist in developing and integrating AI-driven diagnostic features, which enhances accuracy and automates the interpretation of BP readings. Expanding into underserved markets with limited access to healthcare is another key opportunity, while leveraging advancements in telehealth and remote patient monitoring promises significant growth potential. The integration of BP monitoring devices with other wearable health trackers to provide comprehensive health insights represents another emerging trend.
Major Players in the BP Monitoring Device Industry Ecosystem
- GF Health Products Inc
- Rossmax International Ltd
- Kaz Inc
- American Diagnostics Corporation
- Koninklijke Philips N.V.
- Withings
- A&D Medical Inc
- Microlife AG
- General Electric Company (GE Healthcare)
- Omron Healthcare Inc
Key Developments in BP Monitoring Device Industry Industry
- May 2021: Biobeat launched a new wearable and continuous ambulatory blood pressure monitoring (ABPM) chest-monitoring device, expanding the market for continuous monitoring solutions.
- January 2020: SunTech Medical Inc. announced a collaboration to develop new blood pressure measurement solutions, potentially enhancing patient safety and market innovation.
Strategic BP Monitoring Device Industry Market Forecast
The future of the BP monitoring device market is bright, driven by the increasing prevalence of hypertension, the growing adoption of remote patient monitoring, and continuous technological innovations. The market is poised for significant growth, with substantial opportunities for players to capitalize on advancements in AI, wearable technology, and improved data connectivity. The market’s future trajectory will be shaped by the continuous development of accurate, user-friendly, and connected devices that seamlessly integrate into modern healthcare systems.
BP Monitoring Device Industry Segmentation
-
1. Product
- 1.1. Sphygmomanometer/Aneroid BP Monitor
-
1.2. Automated/Digital Blood Pressure Monitor
- 1.2.1. Portable (Wrist, Upper Arm, Finger)
- 1.2.2. Non-Portable (Upper Arm)
- 1.3. Instrument Accessories
-
2. End User
- 2.1. Hospitals and Clinics
- 2.2. Ambulatory Surgical Centers
- 2.3. Home Setting
BP Monitoring Device Industry Segmentation By Geography
-
1. North America
- 1.1. United States
- 1.2. Canada
- 1.3. Mexico
-
2. Europe
- 2.1. Germany
- 2.2. United Kingdom
- 2.3. France
- 2.4. Italy
- 2.5. Spain
- 2.6. Rest of Europe
-
3. Asia Pacific
- 3.1. China
- 3.2. Japan
- 3.3. India
- 3.4. Australia
- 3.5. South Korea
- 3.6. Rest of Asia Pacific
-
4. Middle East and Africa
- 4.1. GCC
- 4.2. South Africa
- 4.3. Rest of Middle East and Africa
-
5. South America
- 5.1. Brazil
- 5.2. Argentina
- 5.3. Rest of South America
BP Monitoring Device Industry REPORT HIGHLIGHTS
| Aspects | Details |
|---|---|
| Study Period | 2019-2033 |
| Base Year | 2024 |
| Estimated Year | 2025 |
| Forecast Period | 2025-2033 |
| Historical Period | 2019-2024 |
| Growth Rate | CAGR of 10.32% from 2019-2033 |
| Segmentation |
|
Table of Contents
- 1. Introduction
- 1.1. Research Scope
- 1.2. Market Segmentation
- 1.3. Research Methodology
- 1.4. Definitions and Assumptions
- 2. Executive Summary
- 2.1. Introduction
- 3. Market Dynamics
- 3.1. Introduction
- 3.2. Market Drivers
- 3.2.1. Surging Burden of Cardiovascular Disorders; Technological Advancements
- 3.3. Market Restrains
- 3.3.1. Excessive Cost for Technological Developments
- 3.4. Market Trends
- 3.4.1. Automated/Digital Blood Pressure Monitor is Expected to Witness a Growth Over the Forecast Period
- 4. Market Factor Analysis
- 4.1. Porters Five Forces
- 4.2. Supply/Value Chain
- 4.3. PESTEL analysis
- 4.4. Market Entropy
- 4.5. Patent/Trademark Analysis
- 5. Global BP Monitoring Device Industry Analysis, Insights and Forecast, 2019-2031
- 5.1. Market Analysis, Insights and Forecast - by Product
- 5.1.1. Sphygmomanometer/Aneroid BP Monitor
- 5.1.2. Automated/Digital Blood Pressure Monitor
- 5.1.2.1. Portable (Wrist, Upper Arm, Finger)
- 5.1.2.2. Non-Portable (Upper Arm)
- 5.1.3. Instrument Accessories
- 5.2. Market Analysis, Insights and Forecast - by End User
- 5.2.1. Hospitals and Clinics
- 5.2.2. Ambulatory Surgical Centers
- 5.2.3. Home Setting
- 5.3. Market Analysis, Insights and Forecast - by Region
- 5.3.1. North America
- 5.3.2. Europe
- 5.3.3. Asia Pacific
- 5.3.4. Middle East and Africa
- 5.3.5. South America
- 5.1. Market Analysis, Insights and Forecast - by Product
- 6. North America BP Monitoring Device Industry Analysis, Insights and Forecast, 2019-2031
- 6.1. Market Analysis, Insights and Forecast - by Product
- 6.1.1. Sphygmomanometer/Aneroid BP Monitor
- 6.1.2. Automated/Digital Blood Pressure Monitor
- 6.1.2.1. Portable (Wrist, Upper Arm, Finger)
- 6.1.2.2. Non-Portable (Upper Arm)
- 6.1.3. Instrument Accessories
- 6.2. Market Analysis, Insights and Forecast - by End User
- 6.2.1. Hospitals and Clinics
- 6.2.2. Ambulatory Surgical Centers
- 6.2.3. Home Setting
- 6.1. Market Analysis, Insights and Forecast - by Product
- 7. Europe BP Monitoring Device Industry Analysis, Insights and Forecast, 2019-2031
- 7.1. Market Analysis, Insights and Forecast - by Product
- 7.1.1. Sphygmomanometer/Aneroid BP Monitor
- 7.1.2. Automated/Digital Blood Pressure Monitor
- 7.1.2.1. Portable (Wrist, Upper Arm, Finger)
- 7.1.2.2. Non-Portable (Upper Arm)
- 7.1.3. Instrument Accessories
- 7.2. Market Analysis, Insights and Forecast - by End User
- 7.2.1. Hospitals and Clinics
- 7.2.2. Ambulatory Surgical Centers
- 7.2.3. Home Setting
- 7.1. Market Analysis, Insights and Forecast - by Product
- 8. Asia Pacific BP Monitoring Device Industry Analysis, Insights and Forecast, 2019-2031
- 8.1. Market Analysis, Insights and Forecast - by Product
- 8.1.1. Sphygmomanometer/Aneroid BP Monitor
- 8.1.2. Automated/Digital Blood Pressure Monitor
- 8.1.2.1. Portable (Wrist, Upper Arm, Finger)
- 8.1.2.2. Non-Portable (Upper Arm)
- 8.1.3. Instrument Accessories
- 8.2. Market Analysis, Insights and Forecast - by End User
- 8.2.1. Hospitals and Clinics
- 8.2.2. Ambulatory Surgical Centers
- 8.2.3. Home Setting
- 8.1. Market Analysis, Insights and Forecast - by Product
- 9. Middle East and Africa BP Monitoring Device Industry Analysis, Insights and Forecast, 2019-2031
- 9.1. Market Analysis, Insights and Forecast - by Product
- 9.1.1. Sphygmomanometer/Aneroid BP Monitor
- 9.1.2. Automated/Digital Blood Pressure Monitor
- 9.1.2.1. Portable (Wrist, Upper Arm, Finger)
- 9.1.2.2. Non-Portable (Upper Arm)
- 9.1.3. Instrument Accessories
- 9.2. Market Analysis, Insights and Forecast - by End User
- 9.2.1. Hospitals and Clinics
- 9.2.2. Ambulatory Surgical Centers
- 9.2.3. Home Setting
- 9.1. Market Analysis, Insights and Forecast - by Product
- 10. South America BP Monitoring Device Industry Analysis, Insights and Forecast, 2019-2031
- 10.1. Market Analysis, Insights and Forecast - by Product
- 10.1.1. Sphygmomanometer/Aneroid BP Monitor
- 10.1.2. Automated/Digital Blood Pressure Monitor
- 10.1.2.1. Portable (Wrist, Upper Arm, Finger)
- 10.1.2.2. Non-Portable (Upper Arm)
- 10.1.3. Instrument Accessories
- 10.2. Market Analysis, Insights and Forecast - by End User
- 10.2.1. Hospitals and Clinics
- 10.2.2. Ambulatory Surgical Centers
- 10.2.3. Home Setting
- 10.1. Market Analysis, Insights and Forecast - by Product
- 11. North America BP Monitoring Device Industry Analysis, Insights and Forecast, 2019-2031
- 11.1. Market Analysis, Insights and Forecast - By Country/Sub-region
- 11.1.1 United States
- 11.1.2 Canada
- 11.1.3 Mexico
- 12. South America BP Monitoring Device Industry Analysis, Insights and Forecast, 2019-2031
- 12.1. Market Analysis, Insights and Forecast - By Country/Sub-region
- 12.1.1 Brazil
- 12.1.2 Mexico
- 12.1.3 Rest of South America
- 13. Europe BP Monitoring Device Industry Analysis, Insights and Forecast, 2019-2031
- 13.1. Market Analysis, Insights and Forecast - By Country/Sub-region
- 13.1.1 United Kingdom
- 13.1.2 Germany
- 13.1.3 France
- 13.1.4 Italy
- 13.1.5 Spain
- 13.1.6 Russia
- 13.1.7 Rest of Europe
- 14. Asia Pacific BP Monitoring Device Industry Analysis, Insights and Forecast, 2019-2031
- 14.1. Market Analysis, Insights and Forecast - By Country/Sub-region
- 14.1.1 China
- 14.1.2 Japan
- 14.1.3 India
- 14.1.4 South Korea
- 14.1.5 Taiwan
- 14.1.6 Australia
- 14.1.7 Rest of Asia-Pacific
- 15. MEA BP Monitoring Device Industry Analysis, Insights and Forecast, 2019-2031
- 15.1. Market Analysis, Insights and Forecast - By Country/Sub-region
- 15.1.1 Middle East
- 15.1.2 Africa
- 16. Competitive Analysis
- 16.1. Global Market Share Analysis 2024
- 16.2. Company Profiles
- 16.2.1 GF Health Products Inc
- 16.2.1.1. Overview
- 16.2.1.2. Products
- 16.2.1.3. SWOT Analysis
- 16.2.1.4. Recent Developments
- 16.2.1.5. Financials (Based on Availability)
- 16.2.2 Rossmax International Ltd
- 16.2.2.1. Overview
- 16.2.2.2. Products
- 16.2.2.3. SWOT Analysis
- 16.2.2.4. Recent Developments
- 16.2.2.5. Financials (Based on Availability)
- 16.2.3 Kaz Inc
- 16.2.3.1. Overview
- 16.2.3.2. Products
- 16.2.3.3. SWOT Analysis
- 16.2.3.4. Recent Developments
- 16.2.3.5. Financials (Based on Availability)
- 16.2.4 American Diagnostics Corporation
- 16.2.4.1. Overview
- 16.2.4.2. Products
- 16.2.4.3. SWOT Analysis
- 16.2.4.4. Recent Developments
- 16.2.4.5. Financials (Based on Availability)
- 16.2.5 Koninklijke Philips N V
- 16.2.5.1. Overview
- 16.2.5.2. Products
- 16.2.5.3. SWOT Analysis
- 16.2.5.4. Recent Developments
- 16.2.5.5. Financials (Based on Availability)
- 16.2.6 Withings*List Not Exhaustive
- 16.2.6.1. Overview
- 16.2.6.2. Products
- 16.2.6.3. SWOT Analysis
- 16.2.6.4. Recent Developments
- 16.2.6.5. Financials (Based on Availability)
- 16.2.7 A&D Medical Inc
- 16.2.7.1. Overview
- 16.2.7.2. Products
- 16.2.7.3. SWOT Analysis
- 16.2.7.4. Recent Developments
- 16.2.7.5. Financials (Based on Availability)
- 16.2.8 Microlife AG
- 16.2.8.1. Overview
- 16.2.8.2. Products
- 16.2.8.3. SWOT Analysis
- 16.2.8.4. Recent Developments
- 16.2.8.5. Financials (Based on Availability)
- 16.2.9 General Electric Company (GE Healthcare)
- 16.2.9.1. Overview
- 16.2.9.2. Products
- 16.2.9.3. SWOT Analysis
- 16.2.9.4. Recent Developments
- 16.2.9.5. Financials (Based on Availability)
- 16.2.10 Omron Healthcare Inc
- 16.2.10.1. Overview
- 16.2.10.2. Products
- 16.2.10.3. SWOT Analysis
- 16.2.10.4. Recent Developments
- 16.2.10.5. Financials (Based on Availability)
- 16.2.1 GF Health Products Inc
List of Figures
- Figure 1: Global BP Monitoring Device Industry Revenue Breakdown (Million, %) by Region 2024 & 2032
- Figure 2: Global BP Monitoring Device Industry Volume Breakdown (K Units, %) by Region 2024 & 2032
- Figure 3: North America BP Monitoring Device Industry Revenue (Million), by Country 2024 & 2032
- Figure 4: North America BP Monitoring Device Industry Volume (K Units), by Country 2024 & 2032
- Figure 5: North America BP Monitoring Device Industry Revenue Share (%), by Country 2024 & 2032
- Figure 6: North America BP Monitoring Device Industry Volume Share (%), by Country 2024 & 2032
- Figure 7: South America BP Monitoring Device Industry Revenue (Million), by Country 2024 & 2032
- Figure 8: South America BP Monitoring Device Industry Volume (K Units), by Country 2024 & 2032
- Figure 9: South America BP Monitoring Device Industry Revenue Share (%), by Country 2024 & 2032
- Figure 10: South America BP Monitoring Device Industry Volume Share (%), by Country 2024 & 2032
- Figure 11: Europe BP Monitoring Device Industry Revenue (Million), by Country 2024 & 2032
- Figure 12: Europe BP Monitoring Device Industry Volume (K Units), by Country 2024 & 2032
- Figure 13: Europe BP Monitoring Device Industry Revenue Share (%), by Country 2024 & 2032
- Figure 14: Europe BP Monitoring Device Industry Volume Share (%), by Country 2024 & 2032
- Figure 15: Asia Pacific BP Monitoring Device Industry Revenue (Million), by Country 2024 & 2032
- Figure 16: Asia Pacific BP Monitoring Device Industry Volume (K Units), by Country 2024 & 2032
- Figure 17: Asia Pacific BP Monitoring Device Industry Revenue Share (%), by Country 2024 & 2032
- Figure 18: Asia Pacific BP Monitoring Device Industry Volume Share (%), by Country 2024 & 2032
- Figure 19: MEA BP Monitoring Device Industry Revenue (Million), by Country 2024 & 2032
- Figure 20: MEA BP Monitoring Device Industry Volume (K Units), by Country 2024 & 2032
- Figure 21: MEA BP Monitoring Device Industry Revenue Share (%), by Country 2024 & 2032
- Figure 22: MEA BP Monitoring Device Industry Volume Share (%), by Country 2024 & 2032
- Figure 23: North America BP Monitoring Device Industry Revenue (Million), by Product 2024 & 2032
- Figure 24: North America BP Monitoring Device Industry Volume (K Units), by Product 2024 & 2032
- Figure 25: North America BP Monitoring Device Industry Revenue Share (%), by Product 2024 & 2032
- Figure 26: North America BP Monitoring Device Industry Volume Share (%), by Product 2024 & 2032
- Figure 27: North America BP Monitoring Device Industry Revenue (Million), by End User 2024 & 2032
- Figure 28: North America BP Monitoring Device Industry Volume (K Units), by End User 2024 & 2032
- Figure 29: North America BP Monitoring Device Industry Revenue Share (%), by End User 2024 & 2032
- Figure 30: North America BP Monitoring Device Industry Volume Share (%), by End User 2024 & 2032
- Figure 31: North America BP Monitoring Device Industry Revenue (Million), by Country 2024 & 2032
- Figure 32: North America BP Monitoring Device Industry Volume (K Units), by Country 2024 & 2032
- Figure 33: North America BP Monitoring Device Industry Revenue Share (%), by Country 2024 & 2032
- Figure 34: North America BP Monitoring Device Industry Volume Share (%), by Country 2024 & 2032
- Figure 35: Europe BP Monitoring Device Industry Revenue (Million), by Product 2024 & 2032
- Figure 36: Europe BP Monitoring Device Industry Volume (K Units), by Product 2024 & 2032
- Figure 37: Europe BP Monitoring Device Industry Revenue Share (%), by Product 2024 & 2032
- Figure 38: Europe BP Monitoring Device Industry Volume Share (%), by Product 2024 & 2032
- Figure 39: Europe BP Monitoring Device Industry Revenue (Million), by End User 2024 & 2032
- Figure 40: Europe BP Monitoring Device Industry Volume (K Units), by End User 2024 & 2032
- Figure 41: Europe BP Monitoring Device Industry Revenue Share (%), by End User 2024 & 2032
- Figure 42: Europe BP Monitoring Device Industry Volume Share (%), by End User 2024 & 2032
- Figure 43: Europe BP Monitoring Device Industry Revenue (Million), by Country 2024 & 2032
- Figure 44: Europe BP Monitoring Device Industry Volume (K Units), by Country 2024 & 2032
- Figure 45: Europe BP Monitoring Device Industry Revenue Share (%), by Country 2024 & 2032
- Figure 46: Europe BP Monitoring Device Industry Volume Share (%), by Country 2024 & 2032
- Figure 47: Asia Pacific BP Monitoring Device Industry Revenue (Million), by Product 2024 & 2032
- Figure 48: Asia Pacific BP Monitoring Device Industry Volume (K Units), by Product 2024 & 2032
- Figure 49: Asia Pacific BP Monitoring Device Industry Revenue Share (%), by Product 2024 & 2032
- Figure 50: Asia Pacific BP Monitoring Device Industry Volume Share (%), by Product 2024 & 2032
- Figure 51: Asia Pacific BP Monitoring Device Industry Revenue (Million), by End User 2024 & 2032
- Figure 52: Asia Pacific BP Monitoring Device Industry Volume (K Units), by End User 2024 & 2032
- Figure 53: Asia Pacific BP Monitoring Device Industry Revenue Share (%), by End User 2024 & 2032
- Figure 54: Asia Pacific BP Monitoring Device Industry Volume Share (%), by End User 2024 & 2032
- Figure 55: Asia Pacific BP Monitoring Device Industry Revenue (Million), by Country 2024 & 2032
- Figure 56: Asia Pacific BP Monitoring Device Industry Volume (K Units), by Country 2024 & 2032
- Figure 57: Asia Pacific BP Monitoring Device Industry Revenue Share (%), by Country 2024 & 2032
- Figure 58: Asia Pacific BP Monitoring Device Industry Volume Share (%), by Country 2024 & 2032
- Figure 59: Middle East and Africa BP Monitoring Device Industry Revenue (Million), by Product 2024 & 2032
- Figure 60: Middle East and Africa BP Monitoring Device Industry Volume (K Units), by Product 2024 & 2032
- Figure 61: Middle East and Africa BP Monitoring Device Industry Revenue Share (%), by Product 2024 & 2032
- Figure 62: Middle East and Africa BP Monitoring Device Industry Volume Share (%), by Product 2024 & 2032
- Figure 63: Middle East and Africa BP Monitoring Device Industry Revenue (Million), by End User 2024 & 2032
- Figure 64: Middle East and Africa BP Monitoring Device Industry Volume (K Units), by End User 2024 & 2032
- Figure 65: Middle East and Africa BP Monitoring Device Industry Revenue Share (%), by End User 2024 & 2032
- Figure 66: Middle East and Africa BP Monitoring Device Industry Volume Share (%), by End User 2024 & 2032
- Figure 67: Middle East and Africa BP Monitoring Device Industry Revenue (Million), by Country 2024 & 2032
- Figure 68: Middle East and Africa BP Monitoring Device Industry Volume (K Units), by Country 2024 & 2032
- Figure 69: Middle East and Africa BP Monitoring Device Industry Revenue Share (%), by Country 2024 & 2032
- Figure 70: Middle East and Africa BP Monitoring Device Industry Volume Share (%), by Country 2024 & 2032
- Figure 71: South America BP Monitoring Device Industry Revenue (Million), by Product 2024 & 2032
- Figure 72: South America BP Monitoring Device Industry Volume (K Units), by Product 2024 & 2032
- Figure 73: South America BP Monitoring Device Industry Revenue Share (%), by Product 2024 & 2032
- Figure 74: South America BP Monitoring Device Industry Volume Share (%), by Product 2024 & 2032
- Figure 75: South America BP Monitoring Device Industry Revenue (Million), by End User 2024 & 2032
- Figure 76: South America BP Monitoring Device Industry Volume (K Units), by End User 2024 & 2032
- Figure 77: South America BP Monitoring Device Industry Revenue Share (%), by End User 2024 & 2032
- Figure 78: South America BP Monitoring Device Industry Volume Share (%), by End User 2024 & 2032
- Figure 79: South America BP Monitoring Device Industry Revenue (Million), by Country 2024 & 2032
- Figure 80: South America BP Monitoring Device Industry Volume (K Units), by Country 2024 & 2032
- Figure 81: South America BP Monitoring Device Industry Revenue Share (%), by Country 2024 & 2032
- Figure 82: South America BP Monitoring Device Industry Volume Share (%), by Country 2024 & 2032
List of Tables
- Table 1: Global BP Monitoring Device Industry Revenue Million Forecast, by Region 2019 & 2032
- Table 2: Global BP Monitoring Device Industry Volume K Units Forecast, by Region 2019 & 2032
- Table 3: Global BP Monitoring Device Industry Revenue Million Forecast, by Product 2019 & 2032
- Table 4: Global BP Monitoring Device Industry Volume K Units Forecast, by Product 2019 & 2032
- Table 5: Global BP Monitoring Device Industry Revenue Million Forecast, by End User 2019 & 2032
- Table 6: Global BP Monitoring Device Industry Volume K Units Forecast, by End User 2019 & 2032
- Table 7: Global BP Monitoring Device Industry Revenue Million Forecast, by Region 2019 & 2032
- Table 8: Global BP Monitoring Device Industry Volume K Units Forecast, by Region 2019 & 2032
- Table 9: Global BP Monitoring Device Industry Revenue Million Forecast, by Country 2019 & 2032
- Table 10: Global BP Monitoring Device Industry Volume K Units Forecast, by Country 2019 & 2032
- Table 11: United States BP Monitoring Device Industry Revenue (Million) Forecast, by Application 2019 & 2032
- Table 12: United States BP Monitoring Device Industry Volume (K Units) Forecast, by Application 2019 & 2032
- Table 13: Canada BP Monitoring Device Industry Revenue (Million) Forecast, by Application 2019 & 2032
- Table 14: Canada BP Monitoring Device Industry Volume (K Units) Forecast, by Application 2019 & 2032
- Table 15: Mexico BP Monitoring Device Industry Revenue (Million) Forecast, by Application 2019 & 2032
- Table 16: Mexico BP Monitoring Device Industry Volume (K Units) Forecast, by Application 2019 & 2032
- Table 17: Global BP Monitoring Device Industry Revenue Million Forecast, by Country 2019 & 2032
- Table 18: Global BP Monitoring Device Industry Volume K Units Forecast, by Country 2019 & 2032
- Table 19: Brazil BP Monitoring Device Industry Revenue (Million) Forecast, by Application 2019 & 2032
- Table 20: Brazil BP Monitoring Device Industry Volume (K Units) Forecast, by Application 2019 & 2032
- Table 21: Mexico BP Monitoring Device Industry Revenue (Million) Forecast, by Application 2019 & 2032
- Table 22: Mexico BP Monitoring Device Industry Volume (K Units) Forecast, by Application 2019 & 2032
- Table 23: Rest of South America BP Monitoring Device Industry Revenue (Million) Forecast, by Application 2019 & 2032
- Table 24: Rest of South America BP Monitoring Device Industry Volume (K Units) Forecast, by Application 2019 & 2032
- Table 25: Global BP Monitoring Device Industry Revenue Million Forecast, by Country 2019 & 2032
- Table 26: Global BP Monitoring Device Industry Volume K Units Forecast, by Country 2019 & 2032
- Table 27: United Kingdom BP Monitoring Device Industry Revenue (Million) Forecast, by Application 2019 & 2032
- Table 28: United Kingdom BP Monitoring Device Industry Volume (K Units) Forecast, by Application 2019 & 2032
- Table 29: Germany BP Monitoring Device Industry Revenue (Million) Forecast, by Application 2019 & 2032
- Table 30: Germany BP Monitoring Device Industry Volume (K Units) Forecast, by Application 2019 & 2032
- Table 31: France BP Monitoring Device Industry Revenue (Million) Forecast, by Application 2019 & 2032
- Table 32: France BP Monitoring Device Industry Volume (K Units) Forecast, by Application 2019 & 2032
- Table 33: Italy BP Monitoring Device Industry Revenue (Million) Forecast, by Application 2019 & 2032
- Table 34: Italy BP Monitoring Device Industry Volume (K Units) Forecast, by Application 2019 & 2032
- Table 35: Spain BP Monitoring Device Industry Revenue (Million) Forecast, by Application 2019 & 2032
- Table 36: Spain BP Monitoring Device Industry Volume (K Units) Forecast, by Application 2019 & 2032
- Table 37: Russia BP Monitoring Device Industry Revenue (Million) Forecast, by Application 2019 & 2032
- Table 38: Russia BP Monitoring Device Industry Volume (K Units) Forecast, by Application 2019 & 2032
- Table 39: Rest of Europe BP Monitoring Device Industry Revenue (Million) Forecast, by Application 2019 & 2032
- Table 40: Rest of Europe BP Monitoring Device Industry Volume (K Units) Forecast, by Application 2019 & 2032
- Table 41: Global BP Monitoring Device Industry Revenue Million Forecast, by Country 2019 & 2032
- Table 42: Global BP Monitoring Device Industry Volume K Units Forecast, by Country 2019 & 2032
- Table 43: China BP Monitoring Device Industry Revenue (Million) Forecast, by Application 2019 & 2032
- Table 44: China BP Monitoring Device Industry Volume (K Units) Forecast, by Application 2019 & 2032
- Table 45: Japan BP Monitoring Device Industry Revenue (Million) Forecast, by Application 2019 & 2032
- Table 46: Japan BP Monitoring Device Industry Volume (K Units) Forecast, by Application 2019 & 2032
- Table 47: India BP Monitoring Device Industry Revenue (Million) Forecast, by Application 2019 & 2032
- Table 48: India BP Monitoring Device Industry Volume (K Units) Forecast, by Application 2019 & 2032
- Table 49: South Korea BP Monitoring Device Industry Revenue (Million) Forecast, by Application 2019 & 2032
- Table 50: South Korea BP Monitoring Device Industry Volume (K Units) Forecast, by Application 2019 & 2032
- Table 51: Taiwan BP Monitoring Device Industry Revenue (Million) Forecast, by Application 2019 & 2032
- Table 52: Taiwan BP Monitoring Device Industry Volume (K Units) Forecast, by Application 2019 & 2032
- Table 53: Australia BP Monitoring Device Industry Revenue (Million) Forecast, by Application 2019 & 2032
- Table 54: Australia BP Monitoring Device Industry Volume (K Units) Forecast, by Application 2019 & 2032
- Table 55: Rest of Asia-Pacific BP Monitoring Device Industry Revenue (Million) Forecast, by Application 2019 & 2032
- Table 56: Rest of Asia-Pacific BP Monitoring Device Industry Volume (K Units) Forecast, by Application 2019 & 2032
- Table 57: Global BP Monitoring Device Industry Revenue Million Forecast, by Country 2019 & 2032
- Table 58: Global BP Monitoring Device Industry Volume K Units Forecast, by Country 2019 & 2032
- Table 59: Middle East BP Monitoring Device Industry Revenue (Million) Forecast, by Application 2019 & 2032
- Table 60: Middle East BP Monitoring Device Industry Volume (K Units) Forecast, by Application 2019 & 2032
- Table 61: Africa BP Monitoring Device Industry Revenue (Million) Forecast, by Application 2019 & 2032
- Table 62: Africa BP Monitoring Device Industry Volume (K Units) Forecast, by Application 2019 & 2032
- Table 63: Global BP Monitoring Device Industry Revenue Million Forecast, by Product 2019 & 2032
- Table 64: Global BP Monitoring Device Industry Volume K Units Forecast, by Product 2019 & 2032
- Table 65: Global BP Monitoring Device Industry Revenue Million Forecast, by End User 2019 & 2032
- Table 66: Global BP Monitoring Device Industry Volume K Units Forecast, by End User 2019 & 2032
- Table 67: Global BP Monitoring Device Industry Revenue Million Forecast, by Country 2019 & 2032
- Table 68: Global BP Monitoring Device Industry Volume K Units Forecast, by Country 2019 & 2032
- Table 69: United States BP Monitoring Device Industry Revenue (Million) Forecast, by Application 2019 & 2032
- Table 70: United States BP Monitoring Device Industry Volume (K Units) Forecast, by Application 2019 & 2032
- Table 71: Canada BP Monitoring Device Industry Revenue (Million) Forecast, by Application 2019 & 2032
- Table 72: Canada BP Monitoring Device Industry Volume (K Units) Forecast, by Application 2019 & 2032
- Table 73: Mexico BP Monitoring Device Industry Revenue (Million) Forecast, by Application 2019 & 2032
- Table 74: Mexico BP Monitoring Device Industry Volume (K Units) Forecast, by Application 2019 & 2032
- Table 75: Global BP Monitoring Device Industry Revenue Million Forecast, by Product 2019 & 2032
- Table 76: Global BP Monitoring Device Industry Volume K Units Forecast, by Product 2019 & 2032
- Table 77: Global BP Monitoring Device Industry Revenue Million Forecast, by End User 2019 & 2032
- Table 78: Global BP Monitoring Device Industry Volume K Units Forecast, by End User 2019 & 2032
- Table 79: Global BP Monitoring Device Industry Revenue Million Forecast, by Country 2019 & 2032
- Table 80: Global BP Monitoring Device Industry Volume K Units Forecast, by Country 2019 & 2032
- Table 81: Germany BP Monitoring Device Industry Revenue (Million) Forecast, by Application 2019 & 2032
- Table 82: Germany BP Monitoring Device Industry Volume (K Units) Forecast, by Application 2019 & 2032
- Table 83: United Kingdom BP Monitoring Device Industry Revenue (Million) Forecast, by Application 2019 & 2032
- Table 84: United Kingdom BP Monitoring Device Industry Volume (K Units) Forecast, by Application 2019 & 2032
- Table 85: France BP Monitoring Device Industry Revenue (Million) Forecast, by Application 2019 & 2032
- Table 86: France BP Monitoring Device Industry Volume (K Units) Forecast, by Application 2019 & 2032
- Table 87: Italy BP Monitoring Device Industry Revenue (Million) Forecast, by Application 2019 & 2032
- Table 88: Italy BP Monitoring Device Industry Volume (K Units) Forecast, by Application 2019 & 2032
- Table 89: Spain BP Monitoring Device Industry Revenue (Million) Forecast, by Application 2019 & 2032
- Table 90: Spain BP Monitoring Device Industry Volume (K Units) Forecast, by Application 2019 & 2032
- Table 91: Rest of Europe BP Monitoring Device Industry Revenue (Million) Forecast, by Application 2019 & 2032
- Table 92: Rest of Europe BP Monitoring Device Industry Volume (K Units) Forecast, by Application 2019 & 2032
- Table 93: Global BP Monitoring Device Industry Revenue Million Forecast, by Product 2019 & 2032
- Table 94: Global BP Monitoring Device Industry Volume K Units Forecast, by Product 2019 & 2032
- Table 95: Global BP Monitoring Device Industry Revenue Million Forecast, by End User 2019 & 2032
- Table 96: Global BP Monitoring Device Industry Volume K Units Forecast, by End User 2019 & 2032
- Table 97: Global BP Monitoring Device Industry Revenue Million Forecast, by Country 2019 & 2032
- Table 98: Global BP Monitoring Device Industry Volume K Units Forecast, by Country 2019 & 2032
- Table 99: China BP Monitoring Device Industry Revenue (Million) Forecast, by Application 2019 & 2032
- Table 100: China BP Monitoring Device Industry Volume (K Units) Forecast, by Application 2019 & 2032
- Table 101: Japan BP Monitoring Device Industry Revenue (Million) Forecast, by Application 2019 & 2032
- Table 102: Japan BP Monitoring Device Industry Volume (K Units) Forecast, by Application 2019 & 2032
- Table 103: India BP Monitoring Device Industry Revenue (Million) Forecast, by Application 2019 & 2032
- Table 104: India BP Monitoring Device Industry Volume (K Units) Forecast, by Application 2019 & 2032
- Table 105: Australia BP Monitoring Device Industry Revenue (Million) Forecast, by Application 2019 & 2032
- Table 106: Australia BP Monitoring Device Industry Volume (K Units) Forecast, by Application 2019 & 2032
- Table 107: South Korea BP Monitoring Device Industry Revenue (Million) Forecast, by Application 2019 & 2032
- Table 108: South Korea BP Monitoring Device Industry Volume (K Units) Forecast, by Application 2019 & 2032
- Table 109: Rest of Asia Pacific BP Monitoring Device Industry Revenue (Million) Forecast, by Application 2019 & 2032
- Table 110: Rest of Asia Pacific BP Monitoring Device Industry Volume (K Units) Forecast, by Application 2019 & 2032
- Table 111: Global BP Monitoring Device Industry Revenue Million Forecast, by Product 2019 & 2032
- Table 112: Global BP Monitoring Device Industry Volume K Units Forecast, by Product 2019 & 2032
- Table 113: Global BP Monitoring Device Industry Revenue Million Forecast, by End User 2019 & 2032
- Table 114: Global BP Monitoring Device Industry Volume K Units Forecast, by End User 2019 & 2032
- Table 115: Global BP Monitoring Device Industry Revenue Million Forecast, by Country 2019 & 2032
- Table 116: Global BP Monitoring Device Industry Volume K Units Forecast, by Country 2019 & 2032
- Table 117: GCC BP Monitoring Device Industry Revenue (Million) Forecast, by Application 2019 & 2032
- Table 118: GCC BP Monitoring Device Industry Volume (K Units) Forecast, by Application 2019 & 2032
- Table 119: South Africa BP Monitoring Device Industry Revenue (Million) Forecast, by Application 2019 & 2032
- Table 120: South Africa BP Monitoring Device Industry Volume (K Units) Forecast, by Application 2019 & 2032
- Table 121: Rest of Middle East and Africa BP Monitoring Device Industry Revenue (Million) Forecast, by Application 2019 & 2032
- Table 122: Rest of Middle East and Africa BP Monitoring Device Industry Volume (K Units) Forecast, by Application 2019 & 2032
- Table 123: Global BP Monitoring Device Industry Revenue Million Forecast, by Product 2019 & 2032
- Table 124: Global BP Monitoring Device Industry Volume K Units Forecast, by Product 2019 & 2032
- Table 125: Global BP Monitoring Device Industry Revenue Million Forecast, by End User 2019 & 2032
- Table 126: Global BP Monitoring Device Industry Volume K Units Forecast, by End User 2019 & 2032
- Table 127: Global BP Monitoring Device Industry Revenue Million Forecast, by Country 2019 & 2032
- Table 128: Global BP Monitoring Device Industry Volume K Units Forecast, by Country 2019 & 2032
- Table 129: Brazil BP Monitoring Device Industry Revenue (Million) Forecast, by Application 2019 & 2032
- Table 130: Brazil BP Monitoring Device Industry Volume (K Units) Forecast, by Application 2019 & 2032
- Table 131: Argentina BP Monitoring Device Industry Revenue (Million) Forecast, by Application 2019 & 2032
- Table 132: Argentina BP Monitoring Device Industry Volume (K Units) Forecast, by Application 2019 & 2032
- Table 133: Rest of South America BP Monitoring Device Industry Revenue (Million) Forecast, by Application 2019 & 2032
- Table 134: Rest of South America BP Monitoring Device Industry Volume (K Units) Forecast, by Application 2019 & 2032
Frequently Asked Questions
1. What is the projected Compound Annual Growth Rate (CAGR) of the BP Monitoring Device Industry?
The projected CAGR is approximately 10.32%.
2. Which companies are prominent players in the BP Monitoring Device Industry?
Key companies in the market include GF Health Products Inc, Rossmax International Ltd, Kaz Inc, American Diagnostics Corporation, Koninklijke Philips N V, Withings*List Not Exhaustive, A&D Medical Inc, Microlife AG, General Electric Company (GE Healthcare), Omron Healthcare Inc.
3. What are the main segments of the BP Monitoring Device Industry?
The market segments include Product, End User.
4. Can you provide details about the market size?
The market size is estimated to be USD 4.88 Million as of 2022.
5. What are some drivers contributing to market growth?
Surging Burden of Cardiovascular Disorders; Technological Advancements.
6. What are the notable trends driving market growth?
Automated/Digital Blood Pressure Monitor is Expected to Witness a Growth Over the Forecast Period.
7. Are there any restraints impacting market growth?
Excessive Cost for Technological Developments.
8. Can you provide examples of recent developments in the market?
In May 2021, Biobeat announced the launch of its new wearable and continuous ambulatory blood pressure monitoring (ABPM) chest-monitoring device.
9. What pricing options are available for accessing the report?
Pricing options include single-user, multi-user, and enterprise licenses priced at USD 4750, USD 5250, and USD 8750 respectively.
10. Is the market size provided in terms of value or volume?
The market size is provided in terms of value, measured in Million and volume, measured in K Units.
11. Are there any specific market keywords associated with the report?
Yes, the market keyword associated with the report is "BP Monitoring Device Industry," which aids in identifying and referencing the specific market segment covered.
12. How do I determine which pricing option suits my needs best?
The pricing options vary based on user requirements and access needs. Individual users may opt for single-user licenses, while businesses requiring broader access may choose multi-user or enterprise licenses for cost-effective access to the report.
13. Are there any additional resources or data provided in the BP Monitoring Device Industry report?
While the report offers comprehensive insights, it's advisable to review the specific contents or supplementary materials provided to ascertain if additional resources or data are available.
14. How can I stay updated on further developments or reports in the BP Monitoring Device Industry?
To stay informed about further developments, trends, and reports in the BP Monitoring Device Industry, consider subscribing to industry newsletters, following relevant companies and organizations, or regularly checking reputable industry news sources and publications.
Methodology
Step 1 - Identification of Relevant Samples Size from Population Database


Step 2 - Approaches for Defining Global Market Size (Value, Volume* & Price*)

Note*: In applicable scenarios
Step 3 - Data Sources
Primary Research
- Web Analytics
- Survey Reports
- Research Institute
- Latest Research Reports
- Opinion Leaders
Secondary Research
- Annual Reports
- White Paper
- Latest Press Release
- Industry Association
- Paid Database
- Investor Presentations

Step 4 - Data Triangulation
Involves using different sources of information in order to increase the validity of a study
These sources are likely to be stakeholders in a program - participants, other researchers, program staff, other community members, and so on.
Then we put all data in single framework & apply various statistical tools to find out the dynamic on the market.
During the analysis stage, feedback from the stakeholder groups would be compared to determine areas of agreement as well as areas of divergence
