

Key Insights
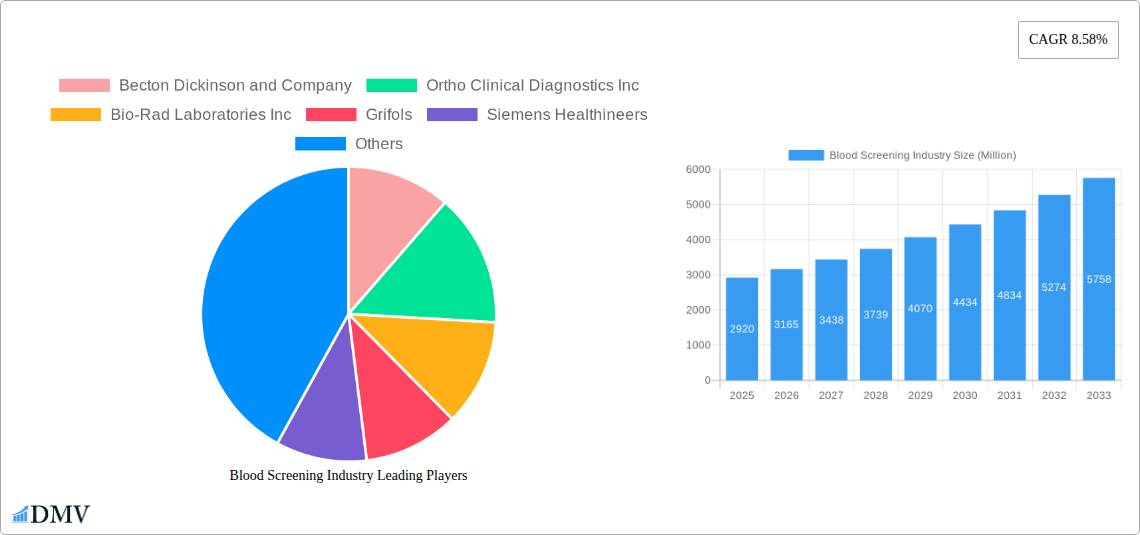
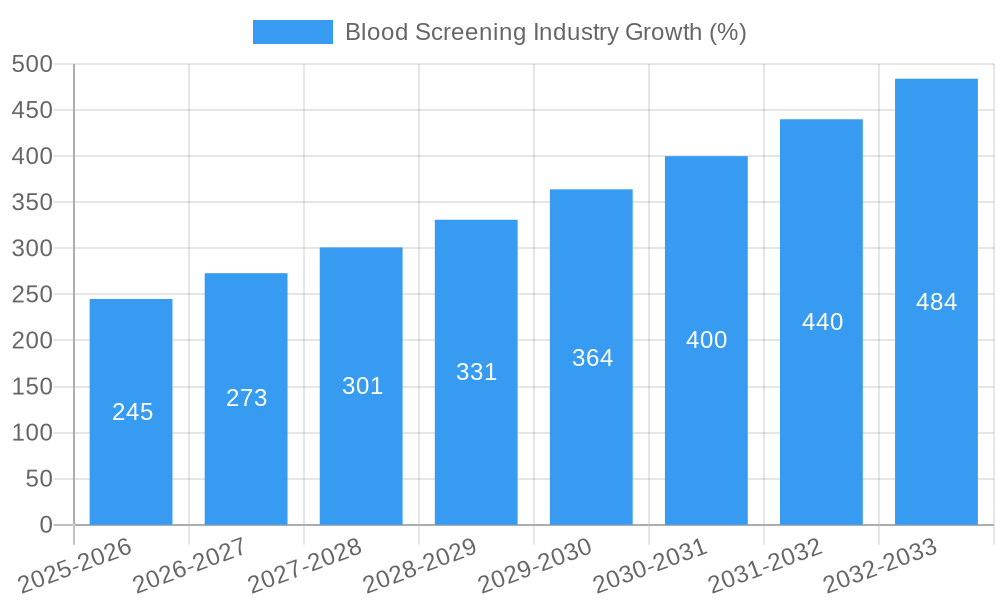
The global blood screening market, valued at $2.92 billion in 2025, is poised for robust growth, projected to expand at a compound annual growth rate (CAGR) of 8.58% from 2025 to 2033. This expansion is driven by several key factors. Rising prevalence of infectious diseases like HIV, Hepatitis B and C, and Zika virus necessitates comprehensive blood screening programs globally. Increasing awareness about blood safety and the consequent demand for stringent screening protocols in blood banks and hospitals are major contributors to market growth. Technological advancements, such as the adoption of highly sensitive and automated Next-Generation Sequencing (NGS) and Nucleic Acid Amplification Tests (NAT), are improving detection accuracy and efficiency, further fueling market expansion. The shift towards point-of-care testing (POCT) is also expected to contribute to market growth, offering faster results and improved patient outcomes. Furthermore, government initiatives promoting blood safety and disease surveillance programs are creating a favorable regulatory environment stimulating market growth.
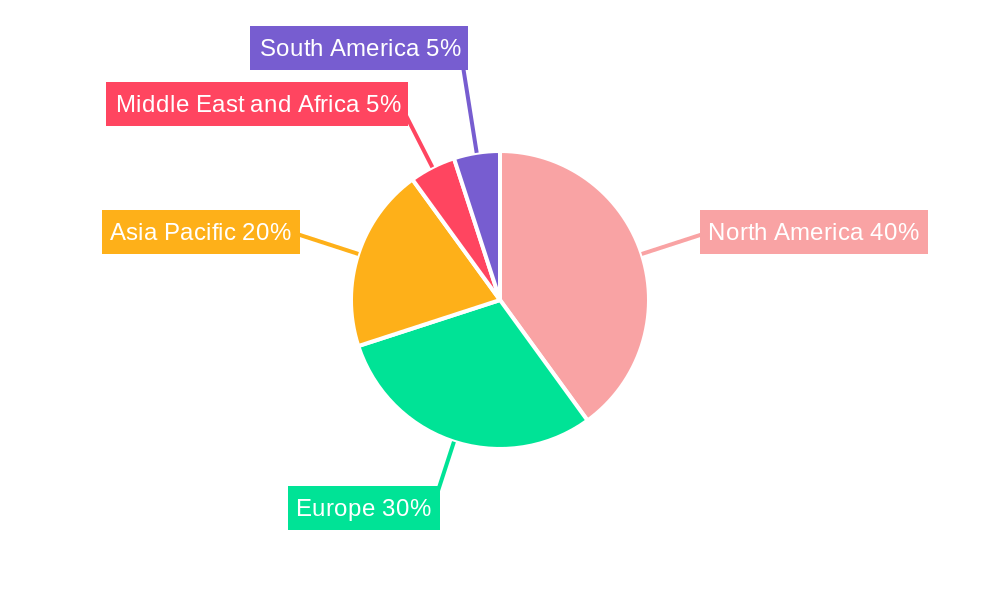
The market segmentation reveals significant opportunities across different product types, technologies, and end-users. Reagents constitute a substantial portion of the market due to their essential role in various blood screening assays. Among technologies, NAT and ELISA remain dominant, although NGS is gaining traction due to its ability to detect a broader range of pathogens. Hospitals and clinical laboratories are the major end-users, reflecting the significant role of blood screening in routine diagnostic procedures. Geographically, North America and Europe currently hold significant market shares, driven by advanced healthcare infrastructure and high disease prevalence. However, rapidly developing economies in Asia-Pacific are expected to witness substantial growth in the coming years, driven by increasing healthcare expenditure and rising awareness about blood-borne diseases. Competitive dynamics are shaped by the presence of established players like Becton Dickinson, Ortho Clinical Diagnostics, and Thermo Fisher Scientific, alongside emerging companies offering innovative solutions.
Blood Screening Industry Market Report: 2019-2033
This comprehensive report provides an in-depth analysis of the global blood screening industry, projecting a market value of $XX Billion by 2033. We analyze market dynamics, key players, technological advancements, and future opportunities across various segments, offering valuable insights for stakeholders across the blood screening ecosystem. The study period covers 2019-2033, with 2025 as the base and estimated year. This report is indispensable for strategic decision-making within this rapidly evolving sector.
Blood Screening Industry Market Composition & Trends
The global blood screening market is characterized by a moderately concentrated landscape, with key players like Becton Dickinson and Company, Ortho Clinical Diagnostics Inc, and Abbott Laboratories Inc holding significant market share. The market’s competitive intensity is influenced by factors like continuous product innovation, stringent regulatory requirements, and the emergence of substitute technologies. Market share distribution fluctuates based on technological advancements and strategic M&A activities. For instance, recent M&A deal values have totaled approximately $XX Billion, driving consolidation and shaping market dynamics.
- Market Concentration: High, with top 10 players accounting for approximately 70% of the global market.
- Innovation Catalysts: Growing demand for faster, more accurate, and cost-effective screening technologies.
- Regulatory Landscape: Stringent regulations and certifications (e.g., FDA clearances in the US) significantly impacting market access and product development.
- Substitute Products: The presence of alternative diagnostic methods creates competitive pressure, impacting market penetration.
- End-User Profiles: Hospitals, clinical laboratories, and blood banks are the primary end-users, with varying needs and procurement practices.
- M&A Activities: Significant M&A activity over the past five years, reflecting consolidation and expansion strategies among major players.
Blood Screening Industry Industry Evolution
The blood screening industry has witnessed substantial growth driven by several factors including the rising prevalence of infectious diseases, increasing demand for point-of-care diagnostics, and technological advancements in diagnostic techniques. The historical period (2019-2024) saw a CAGR of XX%, while the forecast period (2025-2033) projects a CAGR of XX%. This growth trajectory is primarily propelled by the adoption of advanced technologies like Next-Generation Sequencing (NGS) and Nucleic Acid Amplification Tests (NAT), enabling faster and more accurate detection of pathogens. Furthermore, the shift toward personalized medicine and proactive health management is further enhancing market growth, with specific advancements in areas such as early cancer detection and personalized therapeutics driving significant uptake. Consumer demand is also focused on improved patient experiences, including faster turnaround times and convenient access to testing.
Leading Regions, Countries, or Segments in Blood Screening Industry
North America currently dominates the global blood screening market, driven by factors such as high healthcare expenditure, robust regulatory support for innovative technologies, and the concentration of major industry players in the region.
- By Product: Instruments currently hold a larger market share compared to reagents, driven by demand for automated and high-throughput systems.
- By Technology: ELISA and CLIA currently dominate due to established use and widespread availability, however, NGS and NAT are growing rapidly due to higher accuracy and faster results.
- By End-User: Hospitals and clinical laboratories constitute the largest segment, given their significant testing volumes.
Key Drivers:
- High healthcare expenditure in developed countries
- Rising prevalence of infectious diseases and chronic conditions.
- Stringent regulatory frameworks driving the adoption of advanced technologies.
- Favorable reimbursement policies supporting increased accessibility.
Blood Screening Industry Product Innovations
Recent innovations center around improved speed and accuracy of results, with point-of-care devices offering rapid diagnostics, reducing turnaround times. Technological advancements in immunoassays, such as Chemiluminescence Immunoassay (CLIA) and Enzyme Immunoassay (EIA) coupled with miniaturization and automation have improved efficiency and reduced costs. Unique selling propositions now include enhanced sensitivity and specificity, seamless integration with laboratory information systems (LIS), and reduced human error through automation. The incorporation of artificial intelligence (AI) and machine learning (ML) into diagnostic tools offers potential for even greater efficiency and accuracy in the future.
Propelling Factors for Blood Screening Industry Growth
Technological advancements such as the development of highly sensitive and specific assays, automation, and point-of-care testing devices are key growth drivers. Increased government funding for research and development in diagnostics and growing awareness of infectious diseases further fuel market expansion. Furthermore, the favorable reimbursement policies in many countries and the rising prevalence of chronic diseases contribute significantly to market growth.
Obstacles in the Blood Screening Industry Market
High costs associated with advanced technologies can limit adoption, particularly in resource-constrained settings. Supply chain disruptions due to global events can cause shortages of critical reagents and instruments, impacting testing capabilities. Stringent regulatory approvals and certifications necessitate significant investments in product development and validation, potentially delaying market entry. Intense competition among established players and the emergence of new entrants further complicate market dynamics, particularly affecting pricing.
Future Opportunities in Blood Screening Industry
Emerging markets in developing countries offer substantial growth potential as healthcare infrastructure improves and awareness of infectious diseases increases. The integration of AI and ML in diagnostic tools holds promise for improved accuracy and efficiency. Advancements in liquid biopsy and early disease detection technologies present lucrative opportunities for market expansion. Point-of-care diagnostics continue to gain traction, offering convenient and timely screening solutions.
Major Players in the Blood Screening Industry Ecosystem
- Becton Dickinson and Company
- Ortho Clinical Diagnostics Inc
- Bio-Rad Laboratories Inc
- Grifols
- Siemens Healthineers
- F Hoffmann-La Roche Ltd
- Thermo Fisher Scientific Inc
- bioMerieux Inc
- Danaher Corporation
- DiaSorin S P A
- Abbott Laboratories Inc
- PerkinElmer Inc
Key Developments in Blood Screening Industry Industry
- March 2023: H.U. Group Holdings Inc. and Fujirebio launched Lumipulse G NfL CSF and Lumipulse G NfL Blood assays, enabling rapid Neurofilament light (NfL) measurement. This development expands diagnostic capabilities for neurological conditions.
- March 2022: Accelerate Diagnostics launched the Accelerate Arc system for rapid microbial identification in blood cultures, improving the speed and accuracy of infectious disease diagnosis.
Strategic Blood Screening Industry Market Forecast
The blood screening market is poised for robust growth, driven by technological innovation, increasing disease prevalence, and expanding healthcare infrastructure globally. Future opportunities lie in developing personalized diagnostic solutions, enhancing point-of-care technologies, and exploring new applications for advanced molecular diagnostic tools. The market's potential is substantial, with continued growth projected across all major segments, driven by the increasing need for rapid, accurate, and cost-effective blood screening solutions worldwide.
Blood Screening Industry Segmentation
-
1. Product
- 1.1. Reagents
- 1.2. Instruments
-
2. Technology
- 2.1. Nucleic Acid Amplification Test (NAT)
- 2.2. Enzyme-linked Immunosorbent Assay (ELISA)
- 2.3. Chemilum
- 2.4. Next-Generation Sequencing (NGS)
- 2.5. Western Blotting
-
3. End-User
- 3.1. Blood Banks
- 3.2. Hospitals
- 3.3. Clinical laboratories
Blood Screening Industry Segmentation By Geography
-
1. North America
- 1.1. United states
- 1.2. Canada
- 1.3. Mexico
-
2. Europe
- 2.1. Germany
- 2.2. United Kingdom
- 2.3. France
- 2.4. Italy
- 2.5. Spain
- 2.6. Rest of Europe
-
3. Asia Pacific
- 3.1. China
- 3.2. Japan
- 3.3. India
- 3.4. Australia
- 3.5. South Korea
- 3.6. Rest of Asia Pacific
-
4. Middle East and Africa
- 4.1. GCC
- 4.2. South Africa
- 4.3. Rest of Middle East and Africa
-
5. South America
- 5.1. Brazil
- 5.2. Argentina
- 5.3. Rest of South America
Blood Screening Industry REPORT HIGHLIGHTS
| Aspects | Details |
|---|---|
| Study Period | 2019-2033 |
| Base Year | 2024 |
| Estimated Year | 2025 |
| Forecast Period | 2025-2033 |
| Historical Period | 2019-2024 |
| Growth Rate | CAGR of 8.58% from 2019-2033 |
| Segmentation |
|
Table of Contents
- 1. Introduction
- 1.1. Research Scope
- 1.2. Market Segmentation
- 1.3. Research Methodology
- 1.4. Definitions and Assumptions
- 2. Executive Summary
- 2.1. Introduction
- 3. Market Dynamics
- 3.1. Introduction
- 3.2. Market Drivers
- 3.2.1. Increasing Number of Blood Donations and Transfusion Related Screenings; Growing Prevalence of Infectious Diseases; Increasing Government Initiatives
- 3.3. Market Restrains
- 3.3.1 Development of Alternative Technologies; Lack of Legislation
- 3.3.2 Regulations
- 3.3.3 and Policies
- 3.4. Market Trends
- 3.4.1. Reagent Segment is Expected to Hold Significant Market Share Over the Forecast Period
- 4. Market Factor Analysis
- 4.1. Porters Five Forces
- 4.2. Supply/Value Chain
- 4.3. PESTEL analysis
- 4.4. Market Entropy
- 4.5. Patent/Trademark Analysis
- 5. Global Blood Screening Industry Analysis, Insights and Forecast, 2019-2031
- 5.1. Market Analysis, Insights and Forecast - by Product
- 5.1.1. Reagents
- 5.1.2. Instruments
- 5.2. Market Analysis, Insights and Forecast - by Technology
- 5.2.1. Nucleic Acid Amplification Test (NAT)
- 5.2.2. Enzyme-linked Immunosorbent Assay (ELISA)
- 5.2.3. Chemilum
- 5.2.4. Next-Generation Sequencing (NGS)
- 5.2.5. Western Blotting
- 5.3. Market Analysis, Insights and Forecast - by End-User
- 5.3.1. Blood Banks
- 5.3.2. Hospitals
- 5.3.3. Clinical laboratories
- 5.4. Market Analysis, Insights and Forecast - by Region
- 5.4.1. North America
- 5.4.2. Europe
- 5.4.3. Asia Pacific
- 5.4.4. Middle East and Africa
- 5.4.5. South America
- 5.1. Market Analysis, Insights and Forecast - by Product
- 6. North America Blood Screening Industry Analysis, Insights and Forecast, 2019-2031
- 6.1. Market Analysis, Insights and Forecast - by Product
- 6.1.1. Reagents
- 6.1.2. Instruments
- 6.2. Market Analysis, Insights and Forecast - by Technology
- 6.2.1. Nucleic Acid Amplification Test (NAT)
- 6.2.2. Enzyme-linked Immunosorbent Assay (ELISA)
- 6.2.3. Chemilum
- 6.2.4. Next-Generation Sequencing (NGS)
- 6.2.5. Western Blotting
- 6.3. Market Analysis, Insights and Forecast - by End-User
- 6.3.1. Blood Banks
- 6.3.2. Hospitals
- 6.3.3. Clinical laboratories
- 6.1. Market Analysis, Insights and Forecast - by Product
- 7. Europe Blood Screening Industry Analysis, Insights and Forecast, 2019-2031
- 7.1. Market Analysis, Insights and Forecast - by Product
- 7.1.1. Reagents
- 7.1.2. Instruments
- 7.2. Market Analysis, Insights and Forecast - by Technology
- 7.2.1. Nucleic Acid Amplification Test (NAT)
- 7.2.2. Enzyme-linked Immunosorbent Assay (ELISA)
- 7.2.3. Chemilum
- 7.2.4. Next-Generation Sequencing (NGS)
- 7.2.5. Western Blotting
- 7.3. Market Analysis, Insights and Forecast - by End-User
- 7.3.1. Blood Banks
- 7.3.2. Hospitals
- 7.3.3. Clinical laboratories
- 7.1. Market Analysis, Insights and Forecast - by Product
- 8. Asia Pacific Blood Screening Industry Analysis, Insights and Forecast, 2019-2031
- 8.1. Market Analysis, Insights and Forecast - by Product
- 8.1.1. Reagents
- 8.1.2. Instruments
- 8.2. Market Analysis, Insights and Forecast - by Technology
- 8.2.1. Nucleic Acid Amplification Test (NAT)
- 8.2.2. Enzyme-linked Immunosorbent Assay (ELISA)
- 8.2.3. Chemilum
- 8.2.4. Next-Generation Sequencing (NGS)
- 8.2.5. Western Blotting
- 8.3. Market Analysis, Insights and Forecast - by End-User
- 8.3.1. Blood Banks
- 8.3.2. Hospitals
- 8.3.3. Clinical laboratories
- 8.1. Market Analysis, Insights and Forecast - by Product
- 9. Middle East and Africa Blood Screening Industry Analysis, Insights and Forecast, 2019-2031
- 9.1. Market Analysis, Insights and Forecast - by Product
- 9.1.1. Reagents
- 9.1.2. Instruments
- 9.2. Market Analysis, Insights and Forecast - by Technology
- 9.2.1. Nucleic Acid Amplification Test (NAT)
- 9.2.2. Enzyme-linked Immunosorbent Assay (ELISA)
- 9.2.3. Chemilum
- 9.2.4. Next-Generation Sequencing (NGS)
- 9.2.5. Western Blotting
- 9.3. Market Analysis, Insights and Forecast - by End-User
- 9.3.1. Blood Banks
- 9.3.2. Hospitals
- 9.3.3. Clinical laboratories
- 9.1. Market Analysis, Insights and Forecast - by Product
- 10. South America Blood Screening Industry Analysis, Insights and Forecast, 2019-2031
- 10.1. Market Analysis, Insights and Forecast - by Product
- 10.1.1. Reagents
- 10.1.2. Instruments
- 10.2. Market Analysis, Insights and Forecast - by Technology
- 10.2.1. Nucleic Acid Amplification Test (NAT)
- 10.2.2. Enzyme-linked Immunosorbent Assay (ELISA)
- 10.2.3. Chemilum
- 10.2.4. Next-Generation Sequencing (NGS)
- 10.2.5. Western Blotting
- 10.3. Market Analysis, Insights and Forecast - by End-User
- 10.3.1. Blood Banks
- 10.3.2. Hospitals
- 10.3.3. Clinical laboratories
- 10.1. Market Analysis, Insights and Forecast - by Product
- 11. North America Blood Screening Industry Analysis, Insights and Forecast, 2019-2031
- 11.1. Market Analysis, Insights and Forecast - By Country/Sub-region
- 11.1.1 United states
- 11.1.2 Canada
- 11.1.3 Mexico
- 12. Europe Blood Screening Industry Analysis, Insights and Forecast, 2019-2031
- 12.1. Market Analysis, Insights and Forecast - By Country/Sub-region
- 12.1.1 Germany
- 12.1.2 United Kingdom
- 12.1.3 France
- 12.1.4 Italy
- 12.1.5 Spain
- 12.1.6 Rest of Europe
- 13. Asia Pacific Blood Screening Industry Analysis, Insights and Forecast, 2019-2031
- 13.1. Market Analysis, Insights and Forecast - By Country/Sub-region
- 13.1.1 China
- 13.1.2 Japan
- 13.1.3 India
- 13.1.4 Australia
- 13.1.5 South Korea
- 13.1.6 Rest of Asia Pacific
- 14. Middle East and Africa Blood Screening Industry Analysis, Insights and Forecast, 2019-2031
- 14.1. Market Analysis, Insights and Forecast - By Country/Sub-region
- 14.1.1 GCC
- 14.1.2 South Africa
- 14.1.3 Rest of Middle East and Africa
- 15. South America Blood Screening Industry Analysis, Insights and Forecast, 2019-2031
- 15.1. Market Analysis, Insights and Forecast - By Country/Sub-region
- 15.1.1 Brazil
- 15.1.2 Argentina
- 15.1.3 Rest of South America
- 16. Competitive Analysis
- 16.1. Global Market Share Analysis 2024
- 16.2. Company Profiles
- 16.2.1 Becton Dickinson and Company
- 16.2.1.1. Overview
- 16.2.1.2. Products
- 16.2.1.3. SWOT Analysis
- 16.2.1.4. Recent Developments
- 16.2.1.5. Financials (Based on Availability)
- 16.2.2 Ortho Clinical Diagnostics Inc
- 16.2.2.1. Overview
- 16.2.2.2. Products
- 16.2.2.3. SWOT Analysis
- 16.2.2.4. Recent Developments
- 16.2.2.5. Financials (Based on Availability)
- 16.2.3 Bio-Rad Laboratories Inc
- 16.2.3.1. Overview
- 16.2.3.2. Products
- 16.2.3.3. SWOT Analysis
- 16.2.3.4. Recent Developments
- 16.2.3.5. Financials (Based on Availability)
- 16.2.4 Grifols
- 16.2.4.1. Overview
- 16.2.4.2. Products
- 16.2.4.3. SWOT Analysis
- 16.2.4.4. Recent Developments
- 16.2.4.5. Financials (Based on Availability)
- 16.2.5 Siemens Healthineers
- 16.2.5.1. Overview
- 16.2.5.2. Products
- 16.2.5.3. SWOT Analysis
- 16.2.5.4. Recent Developments
- 16.2.5.5. Financials (Based on Availability)
- 16.2.6 F Hoffmann-La Roche Ltd
- 16.2.6.1. Overview
- 16.2.6.2. Products
- 16.2.6.3. SWOT Analysis
- 16.2.6.4. Recent Developments
- 16.2.6.5. Financials (Based on Availability)
- 16.2.7 Thermo Fisher Scientific Inc
- 16.2.7.1. Overview
- 16.2.7.2. Products
- 16.2.7.3. SWOT Analysis
- 16.2.7.4. Recent Developments
- 16.2.7.5. Financials (Based on Availability)
- 16.2.8 bioMerieux Inc
- 16.2.8.1. Overview
- 16.2.8.2. Products
- 16.2.8.3. SWOT Analysis
- 16.2.8.4. Recent Developments
- 16.2.8.5. Financials (Based on Availability)
- 16.2.9 Danaher Corporation
- 16.2.9.1. Overview
- 16.2.9.2. Products
- 16.2.9.3. SWOT Analysis
- 16.2.9.4. Recent Developments
- 16.2.9.5. Financials (Based on Availability)
- 16.2.10 DiaSorin S P A
- 16.2.10.1. Overview
- 16.2.10.2. Products
- 16.2.10.3. SWOT Analysis
- 16.2.10.4. Recent Developments
- 16.2.10.5. Financials (Based on Availability)
- 16.2.11 Abbott Laboratories Inc
- 16.2.11.1. Overview
- 16.2.11.2. Products
- 16.2.11.3. SWOT Analysis
- 16.2.11.4. Recent Developments
- 16.2.11.5. Financials (Based on Availability)
- 16.2.12 PerkinElmer Inc
- 16.2.12.1. Overview
- 16.2.12.2. Products
- 16.2.12.3. SWOT Analysis
- 16.2.12.4. Recent Developments
- 16.2.12.5. Financials (Based on Availability)
- 16.2.1 Becton Dickinson and Company
List of Figures
- Figure 1: Global Blood Screening Industry Revenue Breakdown (Million, %) by Region 2024 & 2032
- Figure 2: Global Blood Screening Industry Volume Breakdown (K Unit, %) by Region 2024 & 2032
- Figure 3: North America Blood Screening Industry Revenue (Million), by Country 2024 & 2032
- Figure 4: North America Blood Screening Industry Volume (K Unit), by Country 2024 & 2032
- Figure 5: North America Blood Screening Industry Revenue Share (%), by Country 2024 & 2032
- Figure 6: North America Blood Screening Industry Volume Share (%), by Country 2024 & 2032
- Figure 7: Europe Blood Screening Industry Revenue (Million), by Country 2024 & 2032
- Figure 8: Europe Blood Screening Industry Volume (K Unit), by Country 2024 & 2032
- Figure 9: Europe Blood Screening Industry Revenue Share (%), by Country 2024 & 2032
- Figure 10: Europe Blood Screening Industry Volume Share (%), by Country 2024 & 2032
- Figure 11: Asia Pacific Blood Screening Industry Revenue (Million), by Country 2024 & 2032
- Figure 12: Asia Pacific Blood Screening Industry Volume (K Unit), by Country 2024 & 2032
- Figure 13: Asia Pacific Blood Screening Industry Revenue Share (%), by Country 2024 & 2032
- Figure 14: Asia Pacific Blood Screening Industry Volume Share (%), by Country 2024 & 2032
- Figure 15: Middle East and Africa Blood Screening Industry Revenue (Million), by Country 2024 & 2032
- Figure 16: Middle East and Africa Blood Screening Industry Volume (K Unit), by Country 2024 & 2032
- Figure 17: Middle East and Africa Blood Screening Industry Revenue Share (%), by Country 2024 & 2032
- Figure 18: Middle East and Africa Blood Screening Industry Volume Share (%), by Country 2024 & 2032
- Figure 19: South America Blood Screening Industry Revenue (Million), by Country 2024 & 2032
- Figure 20: South America Blood Screening Industry Volume (K Unit), by Country 2024 & 2032
- Figure 21: South America Blood Screening Industry Revenue Share (%), by Country 2024 & 2032
- Figure 22: South America Blood Screening Industry Volume Share (%), by Country 2024 & 2032
- Figure 23: North America Blood Screening Industry Revenue (Million), by Product 2024 & 2032
- Figure 24: North America Blood Screening Industry Volume (K Unit), by Product 2024 & 2032
- Figure 25: North America Blood Screening Industry Revenue Share (%), by Product 2024 & 2032
- Figure 26: North America Blood Screening Industry Volume Share (%), by Product 2024 & 2032
- Figure 27: North America Blood Screening Industry Revenue (Million), by Technology 2024 & 2032
- Figure 28: North America Blood Screening Industry Volume (K Unit), by Technology 2024 & 2032
- Figure 29: North America Blood Screening Industry Revenue Share (%), by Technology 2024 & 2032
- Figure 30: North America Blood Screening Industry Volume Share (%), by Technology 2024 & 2032
- Figure 31: North America Blood Screening Industry Revenue (Million), by End-User 2024 & 2032
- Figure 32: North America Blood Screening Industry Volume (K Unit), by End-User 2024 & 2032
- Figure 33: North America Blood Screening Industry Revenue Share (%), by End-User 2024 & 2032
- Figure 34: North America Blood Screening Industry Volume Share (%), by End-User 2024 & 2032
- Figure 35: North America Blood Screening Industry Revenue (Million), by Country 2024 & 2032
- Figure 36: North America Blood Screening Industry Volume (K Unit), by Country 2024 & 2032
- Figure 37: North America Blood Screening Industry Revenue Share (%), by Country 2024 & 2032
- Figure 38: North America Blood Screening Industry Volume Share (%), by Country 2024 & 2032
- Figure 39: Europe Blood Screening Industry Revenue (Million), by Product 2024 & 2032
- Figure 40: Europe Blood Screening Industry Volume (K Unit), by Product 2024 & 2032
- Figure 41: Europe Blood Screening Industry Revenue Share (%), by Product 2024 & 2032
- Figure 42: Europe Blood Screening Industry Volume Share (%), by Product 2024 & 2032
- Figure 43: Europe Blood Screening Industry Revenue (Million), by Technology 2024 & 2032
- Figure 44: Europe Blood Screening Industry Volume (K Unit), by Technology 2024 & 2032
- Figure 45: Europe Blood Screening Industry Revenue Share (%), by Technology 2024 & 2032
- Figure 46: Europe Blood Screening Industry Volume Share (%), by Technology 2024 & 2032
- Figure 47: Europe Blood Screening Industry Revenue (Million), by End-User 2024 & 2032
- Figure 48: Europe Blood Screening Industry Volume (K Unit), by End-User 2024 & 2032
- Figure 49: Europe Blood Screening Industry Revenue Share (%), by End-User 2024 & 2032
- Figure 50: Europe Blood Screening Industry Volume Share (%), by End-User 2024 & 2032
- Figure 51: Europe Blood Screening Industry Revenue (Million), by Country 2024 & 2032
- Figure 52: Europe Blood Screening Industry Volume (K Unit), by Country 2024 & 2032
- Figure 53: Europe Blood Screening Industry Revenue Share (%), by Country 2024 & 2032
- Figure 54: Europe Blood Screening Industry Volume Share (%), by Country 2024 & 2032
- Figure 55: Asia Pacific Blood Screening Industry Revenue (Million), by Product 2024 & 2032
- Figure 56: Asia Pacific Blood Screening Industry Volume (K Unit), by Product 2024 & 2032
- Figure 57: Asia Pacific Blood Screening Industry Revenue Share (%), by Product 2024 & 2032
- Figure 58: Asia Pacific Blood Screening Industry Volume Share (%), by Product 2024 & 2032
- Figure 59: Asia Pacific Blood Screening Industry Revenue (Million), by Technology 2024 & 2032
- Figure 60: Asia Pacific Blood Screening Industry Volume (K Unit), by Technology 2024 & 2032
- Figure 61: Asia Pacific Blood Screening Industry Revenue Share (%), by Technology 2024 & 2032
- Figure 62: Asia Pacific Blood Screening Industry Volume Share (%), by Technology 2024 & 2032
- Figure 63: Asia Pacific Blood Screening Industry Revenue (Million), by End-User 2024 & 2032
- Figure 64: Asia Pacific Blood Screening Industry Volume (K Unit), by End-User 2024 & 2032
- Figure 65: Asia Pacific Blood Screening Industry Revenue Share (%), by End-User 2024 & 2032
- Figure 66: Asia Pacific Blood Screening Industry Volume Share (%), by End-User 2024 & 2032
- Figure 67: Asia Pacific Blood Screening Industry Revenue (Million), by Country 2024 & 2032
- Figure 68: Asia Pacific Blood Screening Industry Volume (K Unit), by Country 2024 & 2032
- Figure 69: Asia Pacific Blood Screening Industry Revenue Share (%), by Country 2024 & 2032
- Figure 70: Asia Pacific Blood Screening Industry Volume Share (%), by Country 2024 & 2032
- Figure 71: Middle East and Africa Blood Screening Industry Revenue (Million), by Product 2024 & 2032
- Figure 72: Middle East and Africa Blood Screening Industry Volume (K Unit), by Product 2024 & 2032
- Figure 73: Middle East and Africa Blood Screening Industry Revenue Share (%), by Product 2024 & 2032
- Figure 74: Middle East and Africa Blood Screening Industry Volume Share (%), by Product 2024 & 2032
- Figure 75: Middle East and Africa Blood Screening Industry Revenue (Million), by Technology 2024 & 2032
- Figure 76: Middle East and Africa Blood Screening Industry Volume (K Unit), by Technology 2024 & 2032
- Figure 77: Middle East and Africa Blood Screening Industry Revenue Share (%), by Technology 2024 & 2032
- Figure 78: Middle East and Africa Blood Screening Industry Volume Share (%), by Technology 2024 & 2032
- Figure 79: Middle East and Africa Blood Screening Industry Revenue (Million), by End-User 2024 & 2032
- Figure 80: Middle East and Africa Blood Screening Industry Volume (K Unit), by End-User 2024 & 2032
- Figure 81: Middle East and Africa Blood Screening Industry Revenue Share (%), by End-User 2024 & 2032
- Figure 82: Middle East and Africa Blood Screening Industry Volume Share (%), by End-User 2024 & 2032
- Figure 83: Middle East and Africa Blood Screening Industry Revenue (Million), by Country 2024 & 2032
- Figure 84: Middle East and Africa Blood Screening Industry Volume (K Unit), by Country 2024 & 2032
- Figure 85: Middle East and Africa Blood Screening Industry Revenue Share (%), by Country 2024 & 2032
- Figure 86: Middle East and Africa Blood Screening Industry Volume Share (%), by Country 2024 & 2032
- Figure 87: South America Blood Screening Industry Revenue (Million), by Product 2024 & 2032
- Figure 88: South America Blood Screening Industry Volume (K Unit), by Product 2024 & 2032
- Figure 89: South America Blood Screening Industry Revenue Share (%), by Product 2024 & 2032
- Figure 90: South America Blood Screening Industry Volume Share (%), by Product 2024 & 2032
- Figure 91: South America Blood Screening Industry Revenue (Million), by Technology 2024 & 2032
- Figure 92: South America Blood Screening Industry Volume (K Unit), by Technology 2024 & 2032
- Figure 93: South America Blood Screening Industry Revenue Share (%), by Technology 2024 & 2032
- Figure 94: South America Blood Screening Industry Volume Share (%), by Technology 2024 & 2032
- Figure 95: South America Blood Screening Industry Revenue (Million), by End-User 2024 & 2032
- Figure 96: South America Blood Screening Industry Volume (K Unit), by End-User 2024 & 2032
- Figure 97: South America Blood Screening Industry Revenue Share (%), by End-User 2024 & 2032
- Figure 98: South America Blood Screening Industry Volume Share (%), by End-User 2024 & 2032
- Figure 99: South America Blood Screening Industry Revenue (Million), by Country 2024 & 2032
- Figure 100: South America Blood Screening Industry Volume (K Unit), by Country 2024 & 2032
- Figure 101: South America Blood Screening Industry Revenue Share (%), by Country 2024 & 2032
- Figure 102: South America Blood Screening Industry Volume Share (%), by Country 2024 & 2032
List of Tables
- Table 1: Global Blood Screening Industry Revenue Million Forecast, by Region 2019 & 2032
- Table 2: Global Blood Screening Industry Volume K Unit Forecast, by Region 2019 & 2032
- Table 3: Global Blood Screening Industry Revenue Million Forecast, by Product 2019 & 2032
- Table 4: Global Blood Screening Industry Volume K Unit Forecast, by Product 2019 & 2032
- Table 5: Global Blood Screening Industry Revenue Million Forecast, by Technology 2019 & 2032
- Table 6: Global Blood Screening Industry Volume K Unit Forecast, by Technology 2019 & 2032
- Table 7: Global Blood Screening Industry Revenue Million Forecast, by End-User 2019 & 2032
- Table 8: Global Blood Screening Industry Volume K Unit Forecast, by End-User 2019 & 2032
- Table 9: Global Blood Screening Industry Revenue Million Forecast, by Region 2019 & 2032
- Table 10: Global Blood Screening Industry Volume K Unit Forecast, by Region 2019 & 2032
- Table 11: Global Blood Screening Industry Revenue Million Forecast, by Country 2019 & 2032
- Table 12: Global Blood Screening Industry Volume K Unit Forecast, by Country 2019 & 2032
- Table 13: United states Blood Screening Industry Revenue (Million) Forecast, by Application 2019 & 2032
- Table 14: United states Blood Screening Industry Volume (K Unit) Forecast, by Application 2019 & 2032
- Table 15: Canada Blood Screening Industry Revenue (Million) Forecast, by Application 2019 & 2032
- Table 16: Canada Blood Screening Industry Volume (K Unit) Forecast, by Application 2019 & 2032
- Table 17: Mexico Blood Screening Industry Revenue (Million) Forecast, by Application 2019 & 2032
- Table 18: Mexico Blood Screening Industry Volume (K Unit) Forecast, by Application 2019 & 2032
- Table 19: Global Blood Screening Industry Revenue Million Forecast, by Country 2019 & 2032
- Table 20: Global Blood Screening Industry Volume K Unit Forecast, by Country 2019 & 2032
- Table 21: Germany Blood Screening Industry Revenue (Million) Forecast, by Application 2019 & 2032
- Table 22: Germany Blood Screening Industry Volume (K Unit) Forecast, by Application 2019 & 2032
- Table 23: United Kingdom Blood Screening Industry Revenue (Million) Forecast, by Application 2019 & 2032
- Table 24: United Kingdom Blood Screening Industry Volume (K Unit) Forecast, by Application 2019 & 2032
- Table 25: France Blood Screening Industry Revenue (Million) Forecast, by Application 2019 & 2032
- Table 26: France Blood Screening Industry Volume (K Unit) Forecast, by Application 2019 & 2032
- Table 27: Italy Blood Screening Industry Revenue (Million) Forecast, by Application 2019 & 2032
- Table 28: Italy Blood Screening Industry Volume (K Unit) Forecast, by Application 2019 & 2032
- Table 29: Spain Blood Screening Industry Revenue (Million) Forecast, by Application 2019 & 2032
- Table 30: Spain Blood Screening Industry Volume (K Unit) Forecast, by Application 2019 & 2032
- Table 31: Rest of Europe Blood Screening Industry Revenue (Million) Forecast, by Application 2019 & 2032
- Table 32: Rest of Europe Blood Screening Industry Volume (K Unit) Forecast, by Application 2019 & 2032
- Table 33: Global Blood Screening Industry Revenue Million Forecast, by Country 2019 & 2032
- Table 34: Global Blood Screening Industry Volume K Unit Forecast, by Country 2019 & 2032
- Table 35: China Blood Screening Industry Revenue (Million) Forecast, by Application 2019 & 2032
- Table 36: China Blood Screening Industry Volume (K Unit) Forecast, by Application 2019 & 2032
- Table 37: Japan Blood Screening Industry Revenue (Million) Forecast, by Application 2019 & 2032
- Table 38: Japan Blood Screening Industry Volume (K Unit) Forecast, by Application 2019 & 2032
- Table 39: India Blood Screening Industry Revenue (Million) Forecast, by Application 2019 & 2032
- Table 40: India Blood Screening Industry Volume (K Unit) Forecast, by Application 2019 & 2032
- Table 41: Australia Blood Screening Industry Revenue (Million) Forecast, by Application 2019 & 2032
- Table 42: Australia Blood Screening Industry Volume (K Unit) Forecast, by Application 2019 & 2032
- Table 43: South Korea Blood Screening Industry Revenue (Million) Forecast, by Application 2019 & 2032
- Table 44: South Korea Blood Screening Industry Volume (K Unit) Forecast, by Application 2019 & 2032
- Table 45: Rest of Asia Pacific Blood Screening Industry Revenue (Million) Forecast, by Application 2019 & 2032
- Table 46: Rest of Asia Pacific Blood Screening Industry Volume (K Unit) Forecast, by Application 2019 & 2032
- Table 47: Global Blood Screening Industry Revenue Million Forecast, by Country 2019 & 2032
- Table 48: Global Blood Screening Industry Volume K Unit Forecast, by Country 2019 & 2032
- Table 49: GCC Blood Screening Industry Revenue (Million) Forecast, by Application 2019 & 2032
- Table 50: GCC Blood Screening Industry Volume (K Unit) Forecast, by Application 2019 & 2032
- Table 51: South Africa Blood Screening Industry Revenue (Million) Forecast, by Application 2019 & 2032
- Table 52: South Africa Blood Screening Industry Volume (K Unit) Forecast, by Application 2019 & 2032
- Table 53: Rest of Middle East and Africa Blood Screening Industry Revenue (Million) Forecast, by Application 2019 & 2032
- Table 54: Rest of Middle East and Africa Blood Screening Industry Volume (K Unit) Forecast, by Application 2019 & 2032
- Table 55: Global Blood Screening Industry Revenue Million Forecast, by Country 2019 & 2032
- Table 56: Global Blood Screening Industry Volume K Unit Forecast, by Country 2019 & 2032
- Table 57: Brazil Blood Screening Industry Revenue (Million) Forecast, by Application 2019 & 2032
- Table 58: Brazil Blood Screening Industry Volume (K Unit) Forecast, by Application 2019 & 2032
- Table 59: Argentina Blood Screening Industry Revenue (Million) Forecast, by Application 2019 & 2032
- Table 60: Argentina Blood Screening Industry Volume (K Unit) Forecast, by Application 2019 & 2032
- Table 61: Rest of South America Blood Screening Industry Revenue (Million) Forecast, by Application 2019 & 2032
- Table 62: Rest of South America Blood Screening Industry Volume (K Unit) Forecast, by Application 2019 & 2032
- Table 63: Global Blood Screening Industry Revenue Million Forecast, by Product 2019 & 2032
- Table 64: Global Blood Screening Industry Volume K Unit Forecast, by Product 2019 & 2032
- Table 65: Global Blood Screening Industry Revenue Million Forecast, by Technology 2019 & 2032
- Table 66: Global Blood Screening Industry Volume K Unit Forecast, by Technology 2019 & 2032
- Table 67: Global Blood Screening Industry Revenue Million Forecast, by End-User 2019 & 2032
- Table 68: Global Blood Screening Industry Volume K Unit Forecast, by End-User 2019 & 2032
- Table 69: Global Blood Screening Industry Revenue Million Forecast, by Country 2019 & 2032
- Table 70: Global Blood Screening Industry Volume K Unit Forecast, by Country 2019 & 2032
- Table 71: United states Blood Screening Industry Revenue (Million) Forecast, by Application 2019 & 2032
- Table 72: United states Blood Screening Industry Volume (K Unit) Forecast, by Application 2019 & 2032
- Table 73: Canada Blood Screening Industry Revenue (Million) Forecast, by Application 2019 & 2032
- Table 74: Canada Blood Screening Industry Volume (K Unit) Forecast, by Application 2019 & 2032
- Table 75: Mexico Blood Screening Industry Revenue (Million) Forecast, by Application 2019 & 2032
- Table 76: Mexico Blood Screening Industry Volume (K Unit) Forecast, by Application 2019 & 2032
- Table 77: Global Blood Screening Industry Revenue Million Forecast, by Product 2019 & 2032
- Table 78: Global Blood Screening Industry Volume K Unit Forecast, by Product 2019 & 2032
- Table 79: Global Blood Screening Industry Revenue Million Forecast, by Technology 2019 & 2032
- Table 80: Global Blood Screening Industry Volume K Unit Forecast, by Technology 2019 & 2032
- Table 81: Global Blood Screening Industry Revenue Million Forecast, by End-User 2019 & 2032
- Table 82: Global Blood Screening Industry Volume K Unit Forecast, by End-User 2019 & 2032
- Table 83: Global Blood Screening Industry Revenue Million Forecast, by Country 2019 & 2032
- Table 84: Global Blood Screening Industry Volume K Unit Forecast, by Country 2019 & 2032
- Table 85: Germany Blood Screening Industry Revenue (Million) Forecast, by Application 2019 & 2032
- Table 86: Germany Blood Screening Industry Volume (K Unit) Forecast, by Application 2019 & 2032
- Table 87: United Kingdom Blood Screening Industry Revenue (Million) Forecast, by Application 2019 & 2032
- Table 88: United Kingdom Blood Screening Industry Volume (K Unit) Forecast, by Application 2019 & 2032
- Table 89: France Blood Screening Industry Revenue (Million) Forecast, by Application 2019 & 2032
- Table 90: France Blood Screening Industry Volume (K Unit) Forecast, by Application 2019 & 2032
- Table 91: Italy Blood Screening Industry Revenue (Million) Forecast, by Application 2019 & 2032
- Table 92: Italy Blood Screening Industry Volume (K Unit) Forecast, by Application 2019 & 2032
- Table 93: Spain Blood Screening Industry Revenue (Million) Forecast, by Application 2019 & 2032
- Table 94: Spain Blood Screening Industry Volume (K Unit) Forecast, by Application 2019 & 2032
- Table 95: Rest of Europe Blood Screening Industry Revenue (Million) Forecast, by Application 2019 & 2032
- Table 96: Rest of Europe Blood Screening Industry Volume (K Unit) Forecast, by Application 2019 & 2032
- Table 97: Global Blood Screening Industry Revenue Million Forecast, by Product 2019 & 2032
- Table 98: Global Blood Screening Industry Volume K Unit Forecast, by Product 2019 & 2032
- Table 99: Global Blood Screening Industry Revenue Million Forecast, by Technology 2019 & 2032
- Table 100: Global Blood Screening Industry Volume K Unit Forecast, by Technology 2019 & 2032
- Table 101: Global Blood Screening Industry Revenue Million Forecast, by End-User 2019 & 2032
- Table 102: Global Blood Screening Industry Volume K Unit Forecast, by End-User 2019 & 2032
- Table 103: Global Blood Screening Industry Revenue Million Forecast, by Country 2019 & 2032
- Table 104: Global Blood Screening Industry Volume K Unit Forecast, by Country 2019 & 2032
- Table 105: China Blood Screening Industry Revenue (Million) Forecast, by Application 2019 & 2032
- Table 106: China Blood Screening Industry Volume (K Unit) Forecast, by Application 2019 & 2032
- Table 107: Japan Blood Screening Industry Revenue (Million) Forecast, by Application 2019 & 2032
- Table 108: Japan Blood Screening Industry Volume (K Unit) Forecast, by Application 2019 & 2032
- Table 109: India Blood Screening Industry Revenue (Million) Forecast, by Application 2019 & 2032
- Table 110: India Blood Screening Industry Volume (K Unit) Forecast, by Application 2019 & 2032
- Table 111: Australia Blood Screening Industry Revenue (Million) Forecast, by Application 2019 & 2032
- Table 112: Australia Blood Screening Industry Volume (K Unit) Forecast, by Application 2019 & 2032
- Table 113: South Korea Blood Screening Industry Revenue (Million) Forecast, by Application 2019 & 2032
- Table 114: South Korea Blood Screening Industry Volume (K Unit) Forecast, by Application 2019 & 2032
- Table 115: Rest of Asia Pacific Blood Screening Industry Revenue (Million) Forecast, by Application 2019 & 2032
- Table 116: Rest of Asia Pacific Blood Screening Industry Volume (K Unit) Forecast, by Application 2019 & 2032
- Table 117: Global Blood Screening Industry Revenue Million Forecast, by Product 2019 & 2032
- Table 118: Global Blood Screening Industry Volume K Unit Forecast, by Product 2019 & 2032
- Table 119: Global Blood Screening Industry Revenue Million Forecast, by Technology 2019 & 2032
- Table 120: Global Blood Screening Industry Volume K Unit Forecast, by Technology 2019 & 2032
- Table 121: Global Blood Screening Industry Revenue Million Forecast, by End-User 2019 & 2032
- Table 122: Global Blood Screening Industry Volume K Unit Forecast, by End-User 2019 & 2032
- Table 123: Global Blood Screening Industry Revenue Million Forecast, by Country 2019 & 2032
- Table 124: Global Blood Screening Industry Volume K Unit Forecast, by Country 2019 & 2032
- Table 125: GCC Blood Screening Industry Revenue (Million) Forecast, by Application 2019 & 2032
- Table 126: GCC Blood Screening Industry Volume (K Unit) Forecast, by Application 2019 & 2032
- Table 127: South Africa Blood Screening Industry Revenue (Million) Forecast, by Application 2019 & 2032
- Table 128: South Africa Blood Screening Industry Volume (K Unit) Forecast, by Application 2019 & 2032
- Table 129: Rest of Middle East and Africa Blood Screening Industry Revenue (Million) Forecast, by Application 2019 & 2032
- Table 130: Rest of Middle East and Africa Blood Screening Industry Volume (K Unit) Forecast, by Application 2019 & 2032
- Table 131: Global Blood Screening Industry Revenue Million Forecast, by Product 2019 & 2032
- Table 132: Global Blood Screening Industry Volume K Unit Forecast, by Product 2019 & 2032
- Table 133: Global Blood Screening Industry Revenue Million Forecast, by Technology 2019 & 2032
- Table 134: Global Blood Screening Industry Volume K Unit Forecast, by Technology 2019 & 2032
- Table 135: Global Blood Screening Industry Revenue Million Forecast, by End-User 2019 & 2032
- Table 136: Global Blood Screening Industry Volume K Unit Forecast, by End-User 2019 & 2032
- Table 137: Global Blood Screening Industry Revenue Million Forecast, by Country 2019 & 2032
- Table 138: Global Blood Screening Industry Volume K Unit Forecast, by Country 2019 & 2032
- Table 139: Brazil Blood Screening Industry Revenue (Million) Forecast, by Application 2019 & 2032
- Table 140: Brazil Blood Screening Industry Volume (K Unit) Forecast, by Application 2019 & 2032
- Table 141: Argentina Blood Screening Industry Revenue (Million) Forecast, by Application 2019 & 2032
- Table 142: Argentina Blood Screening Industry Volume (K Unit) Forecast, by Application 2019 & 2032
- Table 143: Rest of South America Blood Screening Industry Revenue (Million) Forecast, by Application 2019 & 2032
- Table 144: Rest of South America Blood Screening Industry Volume (K Unit) Forecast, by Application 2019 & 2032
Frequently Asked Questions
1. What is the projected Compound Annual Growth Rate (CAGR) of the Blood Screening Industry?
The projected CAGR is approximately 8.58%.
2. Which companies are prominent players in the Blood Screening Industry?
Key companies in the market include Becton Dickinson and Company, Ortho Clinical Diagnostics Inc, Bio-Rad Laboratories Inc, Grifols, Siemens Healthineers, F Hoffmann-La Roche Ltd, Thermo Fisher Scientific Inc, bioMerieux Inc, Danaher Corporation, DiaSorin S P A, Abbott Laboratories Inc, PerkinElmer Inc .
3. What are the main segments of the Blood Screening Industry?
The market segments include Product, Technology, End-User.
4. Can you provide details about the market size?
The market size is estimated to be USD 2.92 Million as of 2022.
5. What are some drivers contributing to market growth?
Increasing Number of Blood Donations and Transfusion Related Screenings; Growing Prevalence of Infectious Diseases; Increasing Government Initiatives.
6. What are the notable trends driving market growth?
Reagent Segment is Expected to Hold Significant Market Share Over the Forecast Period.
7. Are there any restraints impacting market growth?
Development of Alternative Technologies; Lack of Legislation. Regulations. and Policies.
8. Can you provide examples of recent developments in the market?
March 2023: H.U. Group Holdings Inc. and its wholly-owned subsidiary Fujirebio today announced the availability of the Lumipulse G NfL CSF and Lumipulse G NfL Blood assays for the fully automated random-access LUMIPULSE G immunoassay systems. These CLEIA (chemiluminescent enzyme immunoassay) assays allow for the quantitative measurement of Neurofilament light (NfL) in human Cerebrospinal fluid (CSF) and plasma/serum, respectively, within just 35 minutes.
9. What pricing options are available for accessing the report?
Pricing options include single-user, multi-user, and enterprise licenses priced at USD 4750, USD 5250, and USD 8750 respectively.
10. Is the market size provided in terms of value or volume?
The market size is provided in terms of value, measured in Million and volume, measured in K Unit.
11. Are there any specific market keywords associated with the report?
Yes, the market keyword associated with the report is "Blood Screening Industry," which aids in identifying and referencing the specific market segment covered.
12. How do I determine which pricing option suits my needs best?
The pricing options vary based on user requirements and access needs. Individual users may opt for single-user licenses, while businesses requiring broader access may choose multi-user or enterprise licenses for cost-effective access to the report.
13. Are there any additional resources or data provided in the Blood Screening Industry report?
While the report offers comprehensive insights, it's advisable to review the specific contents or supplementary materials provided to ascertain if additional resources or data are available.
14. How can I stay updated on further developments or reports in the Blood Screening Industry?
To stay informed about further developments, trends, and reports in the Blood Screening Industry, consider subscribing to industry newsletters, following relevant companies and organizations, or regularly checking reputable industry news sources and publications.
Methodology
Step 1 - Identification of Relevant Samples Size from Population Database


Step 2 - Approaches for Defining Global Market Size (Value, Volume* & Price*)

Note*: In applicable scenarios
Step 3 - Data Sources
Primary Research
- Web Analytics
- Survey Reports
- Research Institute
- Latest Research Reports
- Opinion Leaders
Secondary Research
- Annual Reports
- White Paper
- Latest Press Release
- Industry Association
- Paid Database
- Investor Presentations

Step 4 - Data Triangulation
Involves using different sources of information in order to increase the validity of a study
These sources are likely to be stakeholders in a program - participants, other researchers, program staff, other community members, and so on.
Then we put all data in single framework & apply various statistical tools to find out the dynamic on the market.
During the analysis stage, feedback from the stakeholder groups would be compared to determine areas of agreement as well as areas of divergence
