

Key Insights
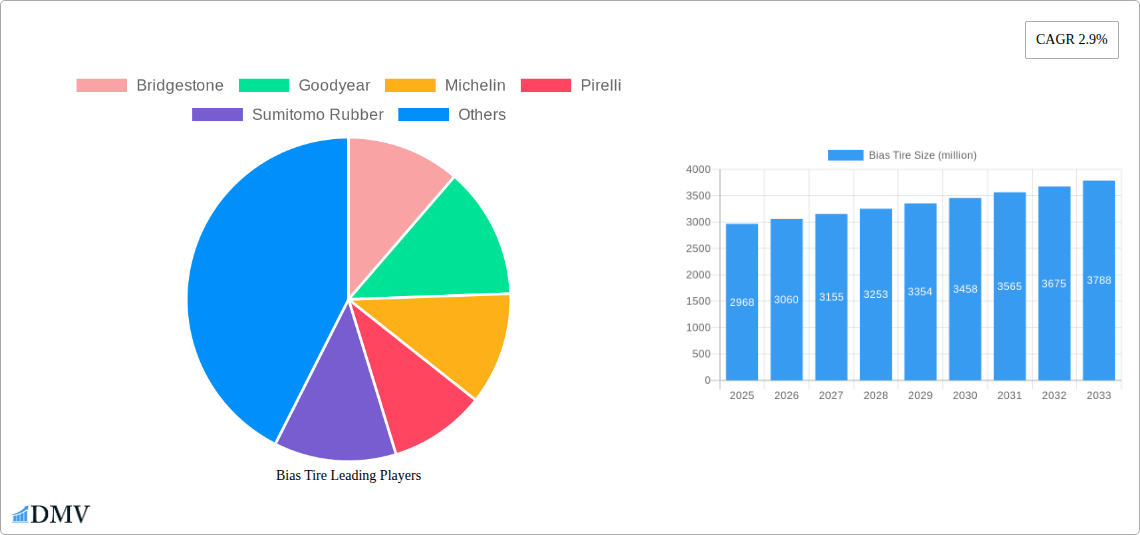
The bias tire market, valued at $2,968 million in 2025, is projected to experience steady growth, driven primarily by its cost-effectiveness and suitability for specific applications in agricultural and industrial sectors. The relatively low cost of bias tires compared to radial tires makes them a compelling option for price-sensitive consumers, particularly in developing economies where affordability is a significant factor in purchasing decisions. Further growth is anticipated due to increasing demand from the agricultural sector for heavy-duty applications requiring robust tire construction. While the 2.9% CAGR suggests moderate growth, this figure may underrepresent the market's potential in niche segments. Continued infrastructure development in emerging markets, particularly in regions with less-developed road networks, could contribute to sustained demand. However, the market faces challenges from the increasing adoption of radial tires in various segments, offering superior performance attributes such as better fuel efficiency and handling. Technological advancements in radial tire manufacturing and a push for improved vehicle performance could put downward pressure on bias tire market share in the long term. The competitive landscape is dominated by major players like Bridgestone, Goodyear, and Michelin, which constantly strive to optimize their bias tire offerings to meet diverse consumer needs and maintain a strong presence within this niche market.
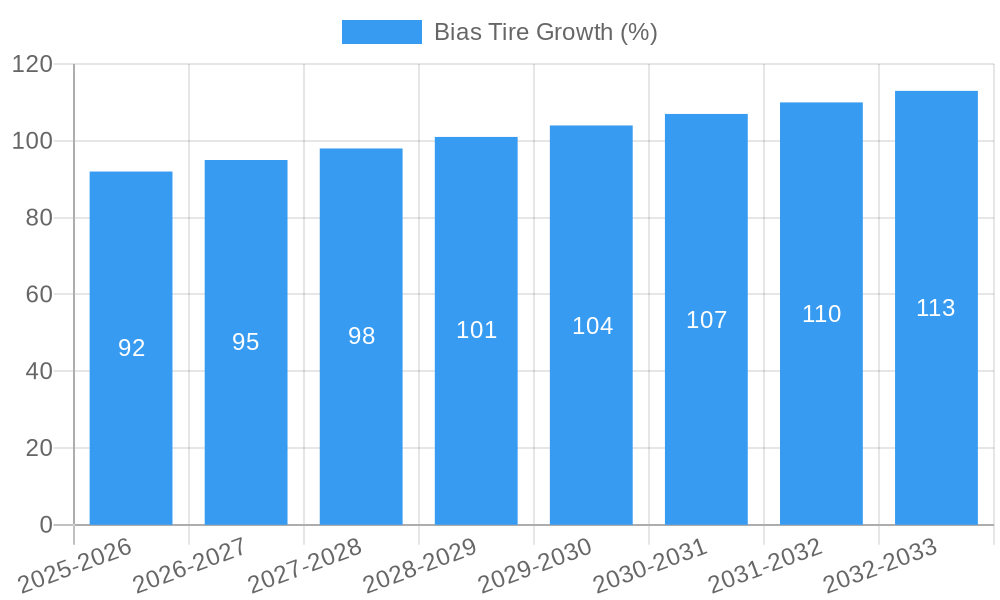
The forecast period (2025-2033) anticipates a gradual expansion of the bias tire market, driven by its continued relevance in specific applications. The market’s growth trajectory will likely be influenced by several factors including raw material costs, evolving technological advancements in tire manufacturing, and regulatory changes related to tire safety and performance. Competitive strategies adopted by leading manufacturers will play a significant role in shaping market dynamics. Companies are expected to focus on innovation to enhance bias tire performance and explore opportunities in emerging markets. Meanwhile, the challenge of maintaining market share in the face of increasing radial tire adoption remains a key factor in determining the long-term trajectory of the bias tire market. While a precise market size projection for 2033 requires more granular data, a conservative estimate, factoring in the CAGR, suggests a value significantly above the 2025 figure.
Bias Tire Market Report: A Comprehensive Analysis (2019-2033)
This insightful report provides a comprehensive analysis of the global bias tire market, projecting a robust growth trajectory over the forecast period (2025-2033). Leveraging extensive market research and data analysis spanning the historical period (2019-2024) and the base year (2025), this report offers invaluable insights for stakeholders seeking to navigate the complexities of this dynamic industry. The report values the global bias tire market at millions of dollars and projects its future growth, providing critical information for strategic decision-making.
Bias Tire Market Composition & Trends
This section delves into the intricate structure of the bias tire market, analyzing its concentration, innovation drivers, regulatory environment, substitute products, end-user profiles, and mergers and acquisitions (M&A) activities. The report evaluates market share distribution amongst key players, including Bridgestone, Goodyear, Michelin, Pirelli, Sumitomo Rubber, Yokohama Rubber, Continental, Cooper Tire & Rubber, KUMHO Tire, Hankook, and Giti Tire, providing a detailed understanding of the competitive landscape. The estimated market share for 2025 is xx million dollars.
- Market Concentration: The bias tire market exhibits a moderately concentrated structure, with the top five players holding an estimated xx% market share in 2025.
- Innovation Catalysts: Ongoing research into material science and manufacturing processes drives innovation, leading to improved tire performance and durability.
- Regulatory Landscape: Stringent safety and environmental regulations influence product design and manufacturing processes. Compliance costs and evolving standards are key considerations.
- Substitute Products: Radial tires pose the primary competitive threat, but bias tires maintain a niche in specific applications due to their cost-effectiveness and durability in certain conditions.
- End-User Profiles: The report segments end-users across various sectors, including agriculture, construction, and off-highway vehicles, each with specific bias tire requirements.
- M&A Activities: The report analyzes significant M&A activities during the study period (2019-2024), highlighting deal values totaling xx million dollars and their impact on market dynamics.
Bias Tire Industry Evolution
This section charts the evolutionary path of the bias tire industry, focusing on market growth trajectories, technological advancements, and evolving consumer demands. The report analyzes historical growth rates and projects future expansion, considering factors like technological innovations, shifts in end-user preferences, and global economic conditions. The report projects a Compound Annual Growth Rate (CAGR) of xx% during the forecast period (2025-2033).
The industry has witnessed a period of consolidation, with increased focus on efficiency and technology. Technological advancements such as improved rubber compounds and tread designs have enhanced the performance and lifespan of bias tires. Simultaneously, changes in consumer preferences and regulatory mandates are driving manufacturers to develop more fuel-efficient and environmentally friendly products.
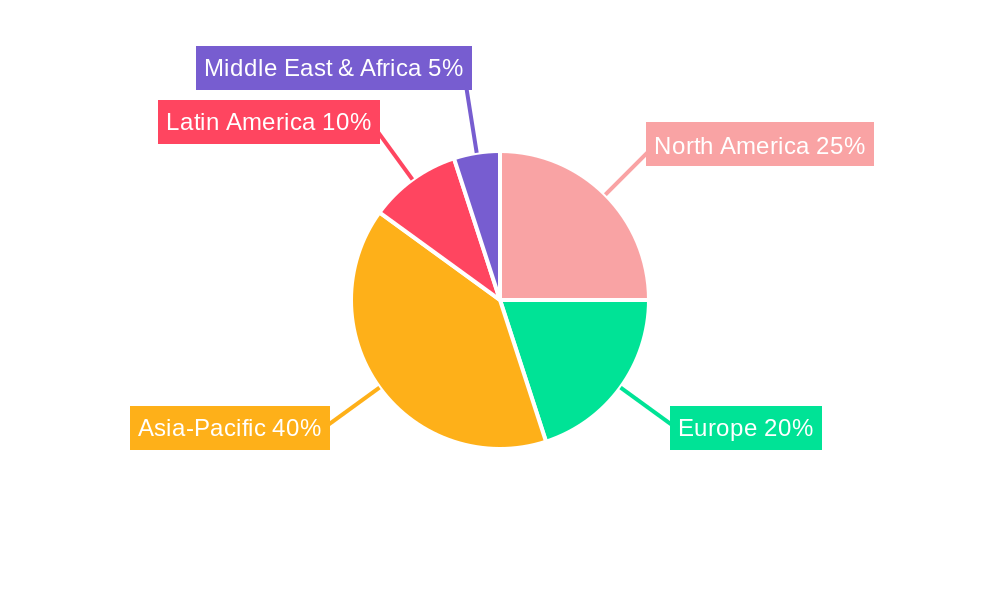
Leading Regions, Countries, or Segments in Bias Tire
This section identifies the dominant regions and countries within the bias tire market, analyzing the factors contributing to their leadership. Specific regions with significant growth potential are highlighted.
- Key Drivers in Dominant Regions:
- High Demand from specific sectors: Strong demand from the agricultural sector in [Specific Region/Country], driven by increasing agricultural activities and government investment.
- Favorable Regulatory environment: Supportive policies and infrastructure development in [Specific Region/Country] foster market expansion.
- Investment in infrastructure: Significant investments in infrastructure projects across [Specific Region/Country] are driving demand for bias tires in construction and transportation.
[Detailed paragraph analysis explaining the dominance factors of the leading regions and countries, including specific market size data in millions of dollars].
Bias Tire Product Innovations
Recent advancements in bias tire technology have focused on enhancing durability, fuel efficiency, and load-bearing capacity while mitigating negative environmental impacts. New materials and manufacturing processes are leading to the development of bias tires with improved traction, resistance to wear and tear, and extended lifespan. These innovations cater to specific end-user requirements, offering unique selling propositions that drive market penetration.
Propelling Factors for Bias Tire Growth
Several factors contribute to the projected growth of the bias tire market. The increasing demand for bias tires in developing economies and their cost-effectiveness compared to radial tires in specific applications are key drivers. Technological advancements, leading to improved performance and durability, are also contributing to market expansion. Moreover, supportive government policies and increasing infrastructure investments in various regions are expected to further propel market growth.
Obstacles in the Bias Tire Market
Despite its growth potential, the bias tire market faces several challenges. The increasing preference for radial tires in several applications constitutes a major obstacle. Fluctuations in raw material prices, particularly natural rubber, impact production costs and profitability. Furthermore, stringent environmental regulations and increasing competition from other tire manufacturers pose significant challenges to the industry. Supply chain disruptions resulting in production bottlenecks could also impact market performance by an estimated xx million dollars annually.
Future Opportunities in Bias Tire
The bias tire market presents several future opportunities. Expanding into niche markets, such as specialized agricultural and industrial applications, could unlock new revenue streams. Technological advancements, such as improved rubber compounds and tread designs, will continue to drive innovation and product differentiation. Furthermore, strategic partnerships and collaborations could expand market reach and facilitate innovation.
Major Players in the Bias Tire Ecosystem
- Bridgestone
- Goodyear
- Michelin
- Pirelli
- Sumitomo Rubber
- Yokohama Rubber
- Continental
- Cooper Tire & Rubber
- KUMHO Tire
- Hankook
- Giti Tire
Key Developments in Bias Tire Industry
- 2022 Q3: Bridgestone launched a new bias tire designed for improved fuel efficiency in agricultural applications.
- 2023 Q1: Goodyear announced a strategic partnership with a raw material supplier to secure long-term supply chain stability.
- 2024 Q2: Michelin invested xx million dollars in a new bias tire manufacturing facility in [Location].
- [Add more developments with year/month and their impact.]
Strategic Bias Tire Market Forecast
The global bias tire market is poised for continued growth, driven by sustained demand from specific sectors and ongoing product innovation. While challenges remain, strategic investments in research and development, along with effective supply chain management, will be crucial for achieving future market potential. The market is anticipated to reach xx million dollars by 2033, presenting significant opportunities for established players and new entrants alike.
Bias Tire Segmentation
-
1. Application
- 1.1. Passenger Car
- 1.2. Truck
- 1.3. Others
-
2. Type
- 2.1. General Bias Tire
- 2.2. Bias Belted Tire
Bias Tire Segmentation By Geography
-
1. North America
- 1.1. United States
- 1.2. Canada
- 1.3. Mexico
-
2. South America
- 2.1. Brazil
- 2.2. Argentina
- 2.3. Rest of South America
-
3. Europe
- 3.1. United Kingdom
- 3.2. Germany
- 3.3. France
- 3.4. Italy
- 3.5. Spain
- 3.6. Russia
- 3.7. Benelux
- 3.8. Nordics
- 3.9. Rest of Europe
-
4. Middle East & Africa
- 4.1. Turkey
- 4.2. Israel
- 4.3. GCC
- 4.4. North Africa
- 4.5. South Africa
- 4.6. Rest of Middle East & Africa
-
5. Asia Pacific
- 5.1. China
- 5.2. India
- 5.3. Japan
- 5.4. South Korea
- 5.5. ASEAN
- 5.6. Oceania
- 5.7. Rest of Asia Pacific
Bias Tire REPORT HIGHLIGHTS
| Aspects | Details |
|---|---|
| Study Period | 2019-2033 |
| Base Year | 2024 |
| Estimated Year | 2025 |
| Forecast Period | 2025-2033 |
| Historical Period | 2019-2024 |
| Growth Rate | CAGR of 2.9% from 2019-2033 |
| Segmentation |
|
Table of Contents
- 1. Introduction
- 1.1. Research Scope
- 1.2. Market Segmentation
- 1.3. Research Methodology
- 1.4. Definitions and Assumptions
- 2. Executive Summary
- 2.1. Introduction
- 3. Market Dynamics
- 3.1. Introduction
- 3.2. Market Drivers
- 3.3. Market Restrains
- 3.4. Market Trends
- 4. Market Factor Analysis
- 4.1. Porters Five Forces
- 4.2. Supply/Value Chain
- 4.3. PESTEL analysis
- 4.4. Market Entropy
- 4.5. Patent/Trademark Analysis
- 5. Global Bias Tire Analysis, Insights and Forecast, 2019-2031
- 5.1. Market Analysis, Insights and Forecast - by Application
- 5.1.1. Passenger Car
- 5.1.2. Truck
- 5.1.3. Others
- 5.2. Market Analysis, Insights and Forecast - by Type
- 5.2.1. General Bias Tire
- 5.2.2. Bias Belted Tire
- 5.3. Market Analysis, Insights and Forecast - by Region
- 5.3.1. North America
- 5.3.2. South America
- 5.3.3. Europe
- 5.3.4. Middle East & Africa
- 5.3.5. Asia Pacific
- 5.1. Market Analysis, Insights and Forecast - by Application
- 6. North America Bias Tire Analysis, Insights and Forecast, 2019-2031
- 6.1. Market Analysis, Insights and Forecast - by Application
- 6.1.1. Passenger Car
- 6.1.2. Truck
- 6.1.3. Others
- 6.2. Market Analysis, Insights and Forecast - by Type
- 6.2.1. General Bias Tire
- 6.2.2. Bias Belted Tire
- 6.1. Market Analysis, Insights and Forecast - by Application
- 7. South America Bias Tire Analysis, Insights and Forecast, 2019-2031
- 7.1. Market Analysis, Insights and Forecast - by Application
- 7.1.1. Passenger Car
- 7.1.2. Truck
- 7.1.3. Others
- 7.2. Market Analysis, Insights and Forecast - by Type
- 7.2.1. General Bias Tire
- 7.2.2. Bias Belted Tire
- 7.1. Market Analysis, Insights and Forecast - by Application
- 8. Europe Bias Tire Analysis, Insights and Forecast, 2019-2031
- 8.1. Market Analysis, Insights and Forecast - by Application
- 8.1.1. Passenger Car
- 8.1.2. Truck
- 8.1.3. Others
- 8.2. Market Analysis, Insights and Forecast - by Type
- 8.2.1. General Bias Tire
- 8.2.2. Bias Belted Tire
- 8.1. Market Analysis, Insights and Forecast - by Application
- 9. Middle East & Africa Bias Tire Analysis, Insights and Forecast, 2019-2031
- 9.1. Market Analysis, Insights and Forecast - by Application
- 9.1.1. Passenger Car
- 9.1.2. Truck
- 9.1.3. Others
- 9.2. Market Analysis, Insights and Forecast - by Type
- 9.2.1. General Bias Tire
- 9.2.2. Bias Belted Tire
- 9.1. Market Analysis, Insights and Forecast - by Application
- 10. Asia Pacific Bias Tire Analysis, Insights and Forecast, 2019-2031
- 10.1. Market Analysis, Insights and Forecast - by Application
- 10.1.1. Passenger Car
- 10.1.2. Truck
- 10.1.3. Others
- 10.2. Market Analysis, Insights and Forecast - by Type
- 10.2.1. General Bias Tire
- 10.2.2. Bias Belted Tire
- 10.1. Market Analysis, Insights and Forecast - by Application
- 11. Competitive Analysis
- 11.1. Global Market Share Analysis 2024
- 11.2. Company Profiles
- 11.2.1 Bridgestone
- 11.2.1.1. Overview
- 11.2.1.2. Products
- 11.2.1.3. SWOT Analysis
- 11.2.1.4. Recent Developments
- 11.2.1.5. Financials (Based on Availability)
- 11.2.2 Goodyear
- 11.2.2.1. Overview
- 11.2.2.2. Products
- 11.2.2.3. SWOT Analysis
- 11.2.2.4. Recent Developments
- 11.2.2.5. Financials (Based on Availability)
- 11.2.3 Michelin
- 11.2.3.1. Overview
- 11.2.3.2. Products
- 11.2.3.3. SWOT Analysis
- 11.2.3.4. Recent Developments
- 11.2.3.5. Financials (Based on Availability)
- 11.2.4 Pirelli
- 11.2.4.1. Overview
- 11.2.4.2. Products
- 11.2.4.3. SWOT Analysis
- 11.2.4.4. Recent Developments
- 11.2.4.5. Financials (Based on Availability)
- 11.2.5 Sumitomo Rubber
- 11.2.5.1. Overview
- 11.2.5.2. Products
- 11.2.5.3. SWOT Analysis
- 11.2.5.4. Recent Developments
- 11.2.5.5. Financials (Based on Availability)
- 11.2.6 Yokohama Rubber
- 11.2.6.1. Overview
- 11.2.6.2. Products
- 11.2.6.3. SWOT Analysis
- 11.2.6.4. Recent Developments
- 11.2.6.5. Financials (Based on Availability)
- 11.2.7 Continental
- 11.2.7.1. Overview
- 11.2.7.2. Products
- 11.2.7.3. SWOT Analysis
- 11.2.7.4. Recent Developments
- 11.2.7.5. Financials (Based on Availability)
- 11.2.8 Cooper Tire & Rubber
- 11.2.8.1. Overview
- 11.2.8.2. Products
- 11.2.8.3. SWOT Analysis
- 11.2.8.4. Recent Developments
- 11.2.8.5. Financials (Based on Availability)
- 11.2.9 KUMHO Tire
- 11.2.9.1. Overview
- 11.2.9.2. Products
- 11.2.9.3. SWOT Analysis
- 11.2.9.4. Recent Developments
- 11.2.9.5. Financials (Based on Availability)
- 11.2.10 Hankook
- 11.2.10.1. Overview
- 11.2.10.2. Products
- 11.2.10.3. SWOT Analysis
- 11.2.10.4. Recent Developments
- 11.2.10.5. Financials (Based on Availability)
- 11.2.11 Giti Tire
- 11.2.11.1. Overview
- 11.2.11.2. Products
- 11.2.11.3. SWOT Analysis
- 11.2.11.4. Recent Developments
- 11.2.11.5. Financials (Based on Availability)
- 11.2.1 Bridgestone
List of Figures
- Figure 1: Global Bias Tire Revenue Breakdown (million, %) by Region 2024 & 2032
- Figure 2: North America Bias Tire Revenue (million), by Application 2024 & 2032
- Figure 3: North America Bias Tire Revenue Share (%), by Application 2024 & 2032
- Figure 4: North America Bias Tire Revenue (million), by Type 2024 & 2032
- Figure 5: North America Bias Tire Revenue Share (%), by Type 2024 & 2032
- Figure 6: North America Bias Tire Revenue (million), by Country 2024 & 2032
- Figure 7: North America Bias Tire Revenue Share (%), by Country 2024 & 2032
- Figure 8: South America Bias Tire Revenue (million), by Application 2024 & 2032
- Figure 9: South America Bias Tire Revenue Share (%), by Application 2024 & 2032
- Figure 10: South America Bias Tire Revenue (million), by Type 2024 & 2032
- Figure 11: South America Bias Tire Revenue Share (%), by Type 2024 & 2032
- Figure 12: South America Bias Tire Revenue (million), by Country 2024 & 2032
- Figure 13: South America Bias Tire Revenue Share (%), by Country 2024 & 2032
- Figure 14: Europe Bias Tire Revenue (million), by Application 2024 & 2032
- Figure 15: Europe Bias Tire Revenue Share (%), by Application 2024 & 2032
- Figure 16: Europe Bias Tire Revenue (million), by Type 2024 & 2032
- Figure 17: Europe Bias Tire Revenue Share (%), by Type 2024 & 2032
- Figure 18: Europe Bias Tire Revenue (million), by Country 2024 & 2032
- Figure 19: Europe Bias Tire Revenue Share (%), by Country 2024 & 2032
- Figure 20: Middle East & Africa Bias Tire Revenue (million), by Application 2024 & 2032
- Figure 21: Middle East & Africa Bias Tire Revenue Share (%), by Application 2024 & 2032
- Figure 22: Middle East & Africa Bias Tire Revenue (million), by Type 2024 & 2032
- Figure 23: Middle East & Africa Bias Tire Revenue Share (%), by Type 2024 & 2032
- Figure 24: Middle East & Africa Bias Tire Revenue (million), by Country 2024 & 2032
- Figure 25: Middle East & Africa Bias Tire Revenue Share (%), by Country 2024 & 2032
- Figure 26: Asia Pacific Bias Tire Revenue (million), by Application 2024 & 2032
- Figure 27: Asia Pacific Bias Tire Revenue Share (%), by Application 2024 & 2032
- Figure 28: Asia Pacific Bias Tire Revenue (million), by Type 2024 & 2032
- Figure 29: Asia Pacific Bias Tire Revenue Share (%), by Type 2024 & 2032
- Figure 30: Asia Pacific Bias Tire Revenue (million), by Country 2024 & 2032
- Figure 31: Asia Pacific Bias Tire Revenue Share (%), by Country 2024 & 2032
List of Tables
- Table 1: Global Bias Tire Revenue million Forecast, by Region 2019 & 2032
- Table 2: Global Bias Tire Revenue million Forecast, by Application 2019 & 2032
- Table 3: Global Bias Tire Revenue million Forecast, by Type 2019 & 2032
- Table 4: Global Bias Tire Revenue million Forecast, by Region 2019 & 2032
- Table 5: Global Bias Tire Revenue million Forecast, by Application 2019 & 2032
- Table 6: Global Bias Tire Revenue million Forecast, by Type 2019 & 2032
- Table 7: Global Bias Tire Revenue million Forecast, by Country 2019 & 2032
- Table 8: United States Bias Tire Revenue (million) Forecast, by Application 2019 & 2032
- Table 9: Canada Bias Tire Revenue (million) Forecast, by Application 2019 & 2032
- Table 10: Mexico Bias Tire Revenue (million) Forecast, by Application 2019 & 2032
- Table 11: Global Bias Tire Revenue million Forecast, by Application 2019 & 2032
- Table 12: Global Bias Tire Revenue million Forecast, by Type 2019 & 2032
- Table 13: Global Bias Tire Revenue million Forecast, by Country 2019 & 2032
- Table 14: Brazil Bias Tire Revenue (million) Forecast, by Application 2019 & 2032
- Table 15: Argentina Bias Tire Revenue (million) Forecast, by Application 2019 & 2032
- Table 16: Rest of South America Bias Tire Revenue (million) Forecast, by Application 2019 & 2032
- Table 17: Global Bias Tire Revenue million Forecast, by Application 2019 & 2032
- Table 18: Global Bias Tire Revenue million Forecast, by Type 2019 & 2032
- Table 19: Global Bias Tire Revenue million Forecast, by Country 2019 & 2032
- Table 20: United Kingdom Bias Tire Revenue (million) Forecast, by Application 2019 & 2032
- Table 21: Germany Bias Tire Revenue (million) Forecast, by Application 2019 & 2032
- Table 22: France Bias Tire Revenue (million) Forecast, by Application 2019 & 2032
- Table 23: Italy Bias Tire Revenue (million) Forecast, by Application 2019 & 2032
- Table 24: Spain Bias Tire Revenue (million) Forecast, by Application 2019 & 2032
- Table 25: Russia Bias Tire Revenue (million) Forecast, by Application 2019 & 2032
- Table 26: Benelux Bias Tire Revenue (million) Forecast, by Application 2019 & 2032
- Table 27: Nordics Bias Tire Revenue (million) Forecast, by Application 2019 & 2032
- Table 28: Rest of Europe Bias Tire Revenue (million) Forecast, by Application 2019 & 2032
- Table 29: Global Bias Tire Revenue million Forecast, by Application 2019 & 2032
- Table 30: Global Bias Tire Revenue million Forecast, by Type 2019 & 2032
- Table 31: Global Bias Tire Revenue million Forecast, by Country 2019 & 2032
- Table 32: Turkey Bias Tire Revenue (million) Forecast, by Application 2019 & 2032
- Table 33: Israel Bias Tire Revenue (million) Forecast, by Application 2019 & 2032
- Table 34: GCC Bias Tire Revenue (million) Forecast, by Application 2019 & 2032
- Table 35: North Africa Bias Tire Revenue (million) Forecast, by Application 2019 & 2032
- Table 36: South Africa Bias Tire Revenue (million) Forecast, by Application 2019 & 2032
- Table 37: Rest of Middle East & Africa Bias Tire Revenue (million) Forecast, by Application 2019 & 2032
- Table 38: Global Bias Tire Revenue million Forecast, by Application 2019 & 2032
- Table 39: Global Bias Tire Revenue million Forecast, by Type 2019 & 2032
- Table 40: Global Bias Tire Revenue million Forecast, by Country 2019 & 2032
- Table 41: China Bias Tire Revenue (million) Forecast, by Application 2019 & 2032
- Table 42: India Bias Tire Revenue (million) Forecast, by Application 2019 & 2032
- Table 43: Japan Bias Tire Revenue (million) Forecast, by Application 2019 & 2032
- Table 44: South Korea Bias Tire Revenue (million) Forecast, by Application 2019 & 2032
- Table 45: ASEAN Bias Tire Revenue (million) Forecast, by Application 2019 & 2032
- Table 46: Oceania Bias Tire Revenue (million) Forecast, by Application 2019 & 2032
- Table 47: Rest of Asia Pacific Bias Tire Revenue (million) Forecast, by Application 2019 & 2032
Frequently Asked Questions
1. What is the projected Compound Annual Growth Rate (CAGR) of the Bias Tire?
The projected CAGR is approximately 2.9%.
2. Which companies are prominent players in the Bias Tire?
Key companies in the market include Bridgestone, Goodyear, Michelin, Pirelli, Sumitomo Rubber, Yokohama Rubber, Continental, Cooper Tire & Rubber, KUMHO Tire, Hankook, Giti Tire.
3. What are the main segments of the Bias Tire?
The market segments include Application, Type.
4. Can you provide details about the market size?
The market size is estimated to be USD 2968 million as of 2022.
5. What are some drivers contributing to market growth?
N/A
6. What are the notable trends driving market growth?
N/A
7. Are there any restraints impacting market growth?
N/A
8. Can you provide examples of recent developments in the market?
N/A
9. What pricing options are available for accessing the report?
Pricing options include single-user, multi-user, and enterprise licenses priced at USD 5900.00, USD 8850.00, and USD 11800.00 respectively.
10. Is the market size provided in terms of value or volume?
The market size is provided in terms of value, measured in million.
11. Are there any specific market keywords associated with the report?
Yes, the market keyword associated with the report is "Bias Tire," which aids in identifying and referencing the specific market segment covered.
12. How do I determine which pricing option suits my needs best?
The pricing options vary based on user requirements and access needs. Individual users may opt for single-user licenses, while businesses requiring broader access may choose multi-user or enterprise licenses for cost-effective access to the report.
13. Are there any additional resources or data provided in the Bias Tire report?
While the report offers comprehensive insights, it's advisable to review the specific contents or supplementary materials provided to ascertain if additional resources or data are available.
14. How can I stay updated on further developments or reports in the Bias Tire?
To stay informed about further developments, trends, and reports in the Bias Tire, consider subscribing to industry newsletters, following relevant companies and organizations, or regularly checking reputable industry news sources and publications.
Methodology
Step 1 - Identification of Relevant Samples Size from Population Database


Step 2 - Approaches for Defining Global Market Size (Value, Volume* & Price*)

Note*: In applicable scenarios
Step 3 - Data Sources
Primary Research
- Web Analytics
- Survey Reports
- Research Institute
- Latest Research Reports
- Opinion Leaders
Secondary Research
- Annual Reports
- White Paper
- Latest Press Release
- Industry Association
- Paid Database
- Investor Presentations

Step 4 - Data Triangulation
Involves using different sources of information in order to increase the validity of a study
These sources are likely to be stakeholders in a program - participants, other researchers, program staff, other community members, and so on.
Then we put all data in single framework & apply various statistical tools to find out the dynamic on the market.
During the analysis stage, feedback from the stakeholder groups would be compared to determine areas of agreement as well as areas of divergence
