

Key Insights
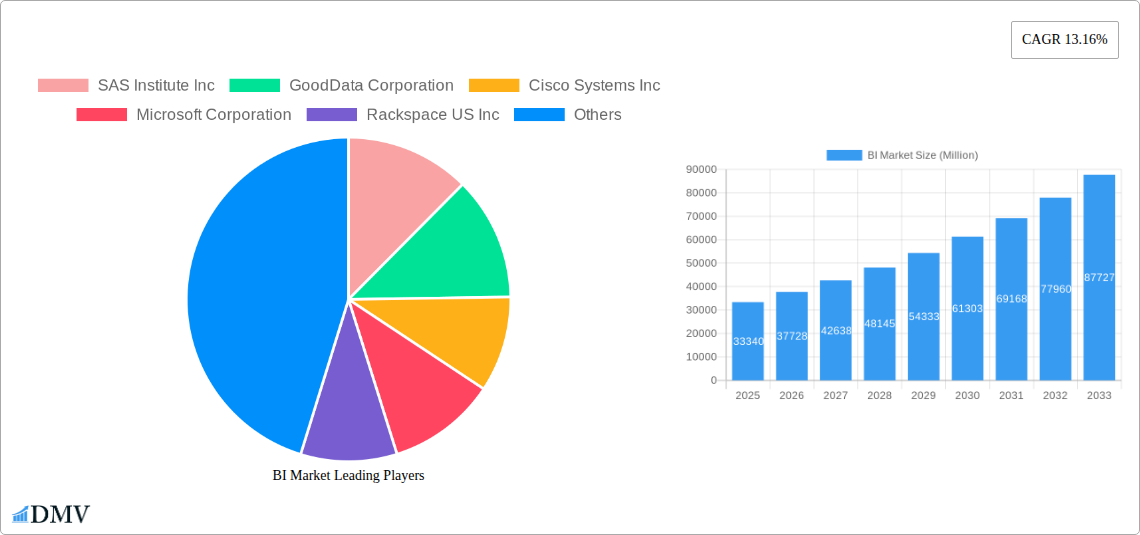
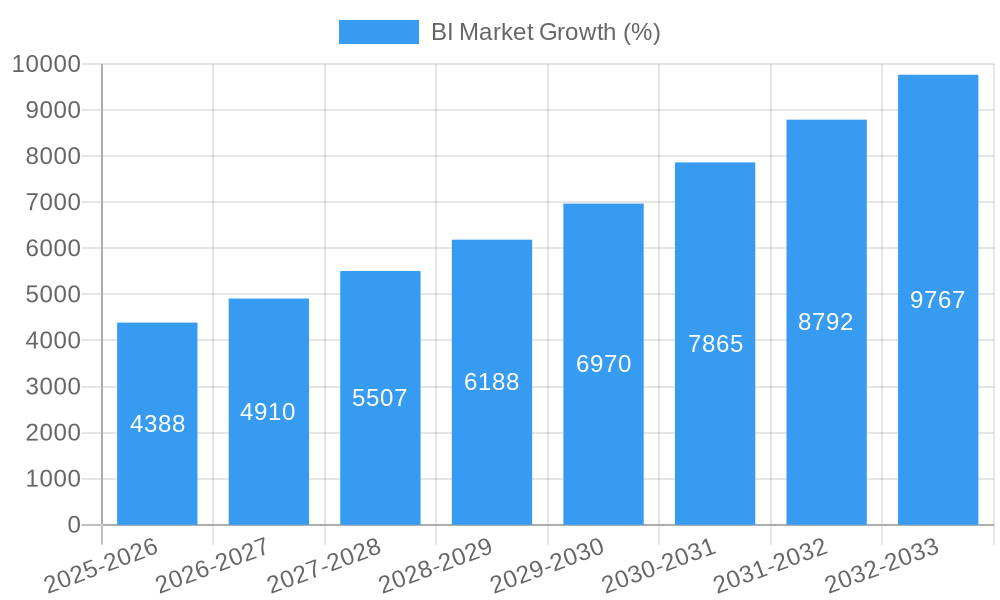
The Business Intelligence (BI) market is experiencing robust growth, projected to reach \$33.34 billion in 2025 and maintain a Compound Annual Growth Rate (CAGR) of 13.16% from 2025 to 2033. This expansion is fueled by several key factors. The increasing need for data-driven decision-making across diverse industries, particularly in BFSI (Banking, Financial Services, and Insurance), IT and Telecommunications, and Retail, is a primary driver. Organizations are increasingly adopting cloud-based BI solutions for enhanced scalability, accessibility, and cost-effectiveness, contributing significantly to market growth. Furthermore, advancements in data visualization techniques, the rise of big data analytics, and the growing adoption of artificial intelligence (AI) and machine learning (ML) within BI platforms are accelerating market expansion. The software and platform segment currently holds a dominant market share, although the services segment is expected to witness significant growth due to the rising demand for implementation, integration, and support services.
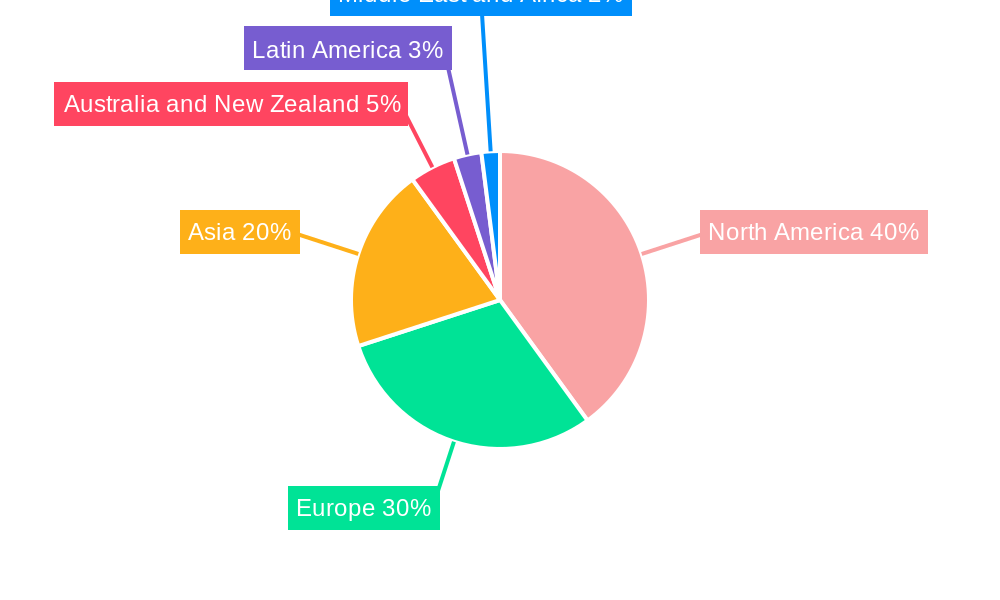
While the market demonstrates strong potential, certain restraints exist. These include the high initial investment costs associated with implementing BI solutions, the complexity involved in data integration and management, and the need for skilled professionals to effectively utilize and interpret BI insights. However, the growing availability of user-friendly BI tools and the decreasing cost of cloud-based solutions are gradually mitigating these challenges. Regional variations exist, with North America and Europe currently holding significant market shares, but the Asia-Pacific region is anticipated to exhibit the highest growth rate due to rapid digitalization and increasing adoption of advanced technologies. Key players like SAS Institute, GoodData, Cisco, Microsoft, and Salesforce (through Tableau) are actively shaping the market landscape through continuous innovation and strategic partnerships. The competitive nature of the market is likely to intensify further, driven by ongoing technological advancements and a growing demand for sophisticated BI solutions.
Business Intelligence (BI) Market Report: 2019-2033
This comprehensive report provides an in-depth analysis of the Business Intelligence (BI) market, offering valuable insights for stakeholders seeking to understand its current state, future trajectory, and key players. With a study period spanning 2019-2033, a base year of 2025, and a forecast period of 2025-2033, this report offers a detailed historical perspective (2019-2024) and reliable future predictions. The market is projected to reach xx Million by 2033, exhibiting significant growth opportunities.
BI Market Market Composition & Trends
This section delves into the intricate structure of the BI market, analyzing its concentration, innovation drivers, regulatory environment, substitute products, end-user profiles, and mergers and acquisitions (M&A) activities. The market is characterized by a moderate level of concentration, with several major players holding significant market share. However, the emergence of niche players and innovative solutions is fostering increased competition.
- Market Share Distribution: Microsoft Corporation, Tableau Software Inc (Salesforce), and SAS Institute Inc currently hold a combined market share of approximately xx%, while other players like Oracle Corporation and SAP SE contribute significantly. The remaining share is distributed amongst smaller companies and niche players.
- Innovation Catalysts: The increasing availability of big data, advancements in artificial intelligence (AI) and machine learning (ML), and the growing demand for data-driven decision-making are key drivers of innovation.
- Regulatory Landscape: Data privacy regulations (e.g., GDPR, CCPA) are significantly shaping the BI market, influencing data security practices and vendor strategies.
- Substitute Products: Traditional reporting methods and spreadsheets pose some level of competition, though the advanced analytical capabilities of BI solutions are driving market growth.
- End-User Profiles: The BI market caters to a diverse range of industries, including BFSI, IT and Telecommunications, Retail, Healthcare, and others, each with unique data analysis needs.
- M&A Activities: Recent years have witnessed several M&A deals in the BI market, with deal values exceeding xx Million in total. These activities reflect the consolidation and strategic positioning within the industry. For instance, the acquisition of Tableau Software by Salesforce significantly impacted market dynamics.
BI Market Industry Evolution
This section traces the evolution of the BI market, examining growth trajectories, technological advancements, and shifts in consumer demands. The market has experienced substantial growth over the past five years, with a CAGR of approximately xx% during the historical period (2019-2024). This growth is projected to continue during the forecast period (2025-2033), driven by factors such as increasing cloud adoption, the rise of self-service BI tools, and expanding demand for advanced analytics across various sectors. The adoption rate of cloud-based BI solutions has also witnessed a significant increase, surpassing xx% in 2024. This trend is expected to further accelerate, driven by cost-effectiveness, scalability, and accessibility. Furthermore, the increasing demand for real-time analytics and predictive modeling is pushing the boundaries of BI technology. The integration of AI and ML into BI platforms is enhancing decision-making capabilities and fostering the adoption of more sophisticated analytical techniques.
Leading Regions, Countries, or Segments in BI Market
North America currently holds the dominant position in the BI market, driven by high technological adoption rates, strong economic conditions, and the presence of major BI vendors. However, the Asia-Pacific region is expected to witness the fastest growth during the forecast period, fueled by increasing digitalization and investment in data analytics infrastructure.
- By Component: The Software and Platform segment currently holds the largest market share, followed by Services. This is driven by the increasing demand for sophisticated BI solutions and related services, such as implementation, integration, and support.
- By Deployment: Cloud deployment is gaining traction, surpassing On-Premise deployment due to its scalability, cost-effectiveness, and accessibility.
- By End-User Industry: The BFSI sector is a major adopter of BI solutions, followed by IT and Telecommunications. These sectors' reliance on data-driven insights contributes to their high market share. However, other end-user industries are witnessing increasing adoption rates as well.
- Key Drivers: Investment in data analytics infrastructure, regulatory support for data-driven decision-making, and the growing need for real-time insights are key growth drivers across all segments.
BI Market Product Innovations
Recent innovations in the BI market have focused on enhancing user experience, improving data visualization capabilities, and integrating advanced analytical techniques such as AI and ML. The emergence of self-service BI tools has democratized access to data analysis, empowering business users to conduct their own analyses without requiring extensive technical expertise. Furthermore, advancements in cloud computing have enabled scalable and cost-effective BI solutions, fostering wider adoption across various organizations.
Propelling Factors for BI Market Growth
Technological advancements, economic growth, and supportive regulatory frameworks are driving the BI market's growth. The increasing availability of big data, coupled with advancements in AI and ML, is significantly enhancing the analytical capabilities of BI solutions. Economic expansion across various sectors is also fueling the demand for data-driven decision-making, resulting in higher investment in BI technologies. Furthermore, government initiatives promoting data analytics and digital transformation are creating a conducive environment for market growth.
Obstacles in the BI Market Market
The BI market faces challenges such as data security concerns, the complexity of implementing and integrating BI solutions, and the high cost of advanced analytical tools. Data breaches and privacy violations can significantly impact organizations' adoption of BI technologies. The complexity of implementing and integrating BI solutions requires specialized expertise, which can increase implementation costs and time. Furthermore, the high cost of advanced analytical tools can limit access for smaller organizations.
Future Opportunities in BI Market
Emerging opportunities lie in the expanding adoption of cloud-based BI solutions, the integration of AI and ML into BI platforms, and the growing demand for real-time analytics and predictive modeling. New markets in developing economies present significant growth potential. Furthermore, the increasing focus on data governance and data security will open up opportunities for specialized solutions and services.
Major Players in the BI Market Ecosystem
- SAS Institute Inc
- GoodData Corporation
- Cisco Systems Inc
- Microsoft Corporation
- Rackspace US Inc
- International Business Machines Corporation
- Tableau Software Inc (Salesforce)
- Oracle Corporation
- Targit AS
- VMware Inc
- SAP SE
Key Developments in BI Market Industry
- May 2023: Rackspace US Inc. announced Object Storage, significantly reducing cloud storage costs for multi-cloud customers. This development enhances competitiveness in the market by providing cost-effective storage solutions.
- May 2023: GoodData Corporation launched its Last Mile ETL feature, streamlining data management and improving data velocity for its customers. This improves efficiency and reduces time to insights.
Strategic BI Market Market Forecast
The BI market is poised for continued growth, driven by technological advancements, increasing data volumes, and the expanding need for data-driven decision-making across various industries. The market's future potential is significant, with opportunities for innovation and expansion in both established and emerging markets. The adoption of cloud-based BI solutions and the integration of advanced analytics will continue to shape the market landscape, creating further opportunities for growth and innovation.
BI Market Segmentation
-
1. Component
- 1.1. Software and Platform
- 1.2. Services
-
2. Deployment
- 2.1. On-Premise
- 2.2. Cloud
-
3. End-User Industry
- 3.1. BFSI
- 3.2. IT and Telecommunication
- 3.3. Retail
- 3.4. Healthcare
- 3.5. Other End-User Industries
BI Market Segmentation By Geography
- 1. North America
- 2. Europe
- 3. Asia
- 4. Australia and New Zealand
- 5. Latin America
- 6. Middle East and Africa
BI Market REPORT HIGHLIGHTS
| Aspects | Details |
|---|---|
| Study Period | 2019-2033 |
| Base Year | 2024 |
| Estimated Year | 2025 |
| Forecast Period | 2025-2033 |
| Historical Period | 2019-2024 |
| Growth Rate | CAGR of 13.16% from 2019-2033 |
| Segmentation |
|
Table of Contents
- 1. Introduction
- 1.1. Research Scope
- 1.2. Market Segmentation
- 1.3. Research Methodology
- 1.4. Definitions and Assumptions
- 2. Executive Summary
- 2.1. Introduction
- 3. Market Dynamics
- 3.1. Introduction
- 3.2. Market Drivers
- 3.2.1. Increasing Adoption of Data Analytics by Enterprises; Emergence of IoT-Enabled Technologies
- 3.3. Market Restrains
- 3.3.1. High Investment Costs for On-Premise Solutions; Lack of Skilled Professionals
- 3.4. Market Trends
- 3.4.1. BFSI Industry is Expected to Drive the Market Growth
- 4. Market Factor Analysis
- 4.1. Porters Five Forces
- 4.2. Supply/Value Chain
- 4.3. PESTEL analysis
- 4.4. Market Entropy
- 4.5. Patent/Trademark Analysis
- 5. Global BI Market Analysis, Insights and Forecast, 2019-2031
- 5.1. Market Analysis, Insights and Forecast - by Component
- 5.1.1. Software and Platform
- 5.1.2. Services
- 5.2. Market Analysis, Insights and Forecast - by Deployment
- 5.2.1. On-Premise
- 5.2.2. Cloud
- 5.3. Market Analysis, Insights and Forecast - by End-User Industry
- 5.3.1. BFSI
- 5.3.2. IT and Telecommunication
- 5.3.3. Retail
- 5.3.4. Healthcare
- 5.3.5. Other End-User Industries
- 5.4. Market Analysis, Insights and Forecast - by Region
- 5.4.1. North America
- 5.4.2. Europe
- 5.4.3. Asia
- 5.4.4. Australia and New Zealand
- 5.4.5. Latin America
- 5.4.6. Middle East and Africa
- 5.1. Market Analysis, Insights and Forecast - by Component
- 6. North America BI Market Analysis, Insights and Forecast, 2019-2031
- 6.1. Market Analysis, Insights and Forecast - by Component
- 6.1.1. Software and Platform
- 6.1.2. Services
- 6.2. Market Analysis, Insights and Forecast - by Deployment
- 6.2.1. On-Premise
- 6.2.2. Cloud
- 6.3. Market Analysis, Insights and Forecast - by End-User Industry
- 6.3.1. BFSI
- 6.3.2. IT and Telecommunication
- 6.3.3. Retail
- 6.3.4. Healthcare
- 6.3.5. Other End-User Industries
- 6.1. Market Analysis, Insights and Forecast - by Component
- 7. Europe BI Market Analysis, Insights and Forecast, 2019-2031
- 7.1. Market Analysis, Insights and Forecast - by Component
- 7.1.1. Software and Platform
- 7.1.2. Services
- 7.2. Market Analysis, Insights and Forecast - by Deployment
- 7.2.1. On-Premise
- 7.2.2. Cloud
- 7.3. Market Analysis, Insights and Forecast - by End-User Industry
- 7.3.1. BFSI
- 7.3.2. IT and Telecommunication
- 7.3.3. Retail
- 7.3.4. Healthcare
- 7.3.5. Other End-User Industries
- 7.1. Market Analysis, Insights and Forecast - by Component
- 8. Asia BI Market Analysis, Insights and Forecast, 2019-2031
- 8.1. Market Analysis, Insights and Forecast - by Component
- 8.1.1. Software and Platform
- 8.1.2. Services
- 8.2. Market Analysis, Insights and Forecast - by Deployment
- 8.2.1. On-Premise
- 8.2.2. Cloud
- 8.3. Market Analysis, Insights and Forecast - by End-User Industry
- 8.3.1. BFSI
- 8.3.2. IT and Telecommunication
- 8.3.3. Retail
- 8.3.4. Healthcare
- 8.3.5. Other End-User Industries
- 8.1. Market Analysis, Insights and Forecast - by Component
- 9. Australia and New Zealand BI Market Analysis, Insights and Forecast, 2019-2031
- 9.1. Market Analysis, Insights and Forecast - by Component
- 9.1.1. Software and Platform
- 9.1.2. Services
- 9.2. Market Analysis, Insights and Forecast - by Deployment
- 9.2.1. On-Premise
- 9.2.2. Cloud
- 9.3. Market Analysis, Insights and Forecast - by End-User Industry
- 9.3.1. BFSI
- 9.3.2. IT and Telecommunication
- 9.3.3. Retail
- 9.3.4. Healthcare
- 9.3.5. Other End-User Industries
- 9.1. Market Analysis, Insights and Forecast - by Component
- 10. Latin America BI Market Analysis, Insights and Forecast, 2019-2031
- 10.1. Market Analysis, Insights and Forecast - by Component
- 10.1.1. Software and Platform
- 10.1.2. Services
- 10.2. Market Analysis, Insights and Forecast - by Deployment
- 10.2.1. On-Premise
- 10.2.2. Cloud
- 10.3. Market Analysis, Insights and Forecast - by End-User Industry
- 10.3.1. BFSI
- 10.3.2. IT and Telecommunication
- 10.3.3. Retail
- 10.3.4. Healthcare
- 10.3.5. Other End-User Industries
- 10.1. Market Analysis, Insights and Forecast - by Component
- 11. Middle East and Africa BI Market Analysis, Insights and Forecast, 2019-2031
- 11.1. Market Analysis, Insights and Forecast - by Component
- 11.1.1. Software and Platform
- 11.1.2. Services
- 11.2. Market Analysis, Insights and Forecast - by Deployment
- 11.2.1. On-Premise
- 11.2.2. Cloud
- 11.3. Market Analysis, Insights and Forecast - by End-User Industry
- 11.3.1. BFSI
- 11.3.2. IT and Telecommunication
- 11.3.3. Retail
- 11.3.4. Healthcare
- 11.3.5. Other End-User Industries
- 11.1. Market Analysis, Insights and Forecast - by Component
- 12. North America BI Market Analysis, Insights and Forecast, 2019-2031
- 12.1. Market Analysis, Insights and Forecast - By Country/Sub-region
- 12.1.1.
- 13. Europe BI Market Analysis, Insights and Forecast, 2019-2031
- 13.1. Market Analysis, Insights and Forecast - By Country/Sub-region
- 13.1.1.
- 14. Asia BI Market Analysis, Insights and Forecast, 2019-2031
- 14.1. Market Analysis, Insights and Forecast - By Country/Sub-region
- 14.1.1.
- 15. Australia and New Zealand BI Market Analysis, Insights and Forecast, 2019-2031
- 15.1. Market Analysis, Insights and Forecast - By Country/Sub-region
- 15.1.1.
- 16. Latin America BI Market Analysis, Insights and Forecast, 2019-2031
- 16.1. Market Analysis, Insights and Forecast - By Country/Sub-region
- 16.1.1.
- 17. Middle East and Africa BI Market Analysis, Insights and Forecast, 2019-2031
- 17.1. Market Analysis, Insights and Forecast - By Country/Sub-region
- 17.1.1.
- 18. Competitive Analysis
- 18.1. Global Market Share Analysis 2024
- 18.2. Company Profiles
- 18.2.1 SAS Institute Inc
- 18.2.1.1. Overview
- 18.2.1.2. Products
- 18.2.1.3. SWOT Analysis
- 18.2.1.4. Recent Developments
- 18.2.1.5. Financials (Based on Availability)
- 18.2.2 GoodData Corporation
- 18.2.2.1. Overview
- 18.2.2.2. Products
- 18.2.2.3. SWOT Analysis
- 18.2.2.4. Recent Developments
- 18.2.2.5. Financials (Based on Availability)
- 18.2.3 Cisco Systems Inc
- 18.2.3.1. Overview
- 18.2.3.2. Products
- 18.2.3.3. SWOT Analysis
- 18.2.3.4. Recent Developments
- 18.2.3.5. Financials (Based on Availability)
- 18.2.4 Microsoft Corporation
- 18.2.4.1. Overview
- 18.2.4.2. Products
- 18.2.4.3. SWOT Analysis
- 18.2.4.4. Recent Developments
- 18.2.4.5. Financials (Based on Availability)
- 18.2.5 Rackspace US Inc
- 18.2.5.1. Overview
- 18.2.5.2. Products
- 18.2.5.3. SWOT Analysis
- 18.2.5.4. Recent Developments
- 18.2.5.5. Financials (Based on Availability)
- 18.2.6 International Business Machines Corporation
- 18.2.6.1. Overview
- 18.2.6.2. Products
- 18.2.6.3. SWOT Analysis
- 18.2.6.4. Recent Developments
- 18.2.6.5. Financials (Based on Availability)
- 18.2.7 Tableau Software Inc (Salesforce)*List Not Exhaustive
- 18.2.7.1. Overview
- 18.2.7.2. Products
- 18.2.7.3. SWOT Analysis
- 18.2.7.4. Recent Developments
- 18.2.7.5. Financials (Based on Availability)
- 18.2.8 Oracle Corporation
- 18.2.8.1. Overview
- 18.2.8.2. Products
- 18.2.8.3. SWOT Analysis
- 18.2.8.4. Recent Developments
- 18.2.8.5. Financials (Based on Availability)
- 18.2.9 Targit AS
- 18.2.9.1. Overview
- 18.2.9.2. Products
- 18.2.9.3. SWOT Analysis
- 18.2.9.4. Recent Developments
- 18.2.9.5. Financials (Based on Availability)
- 18.2.10 VMware Inc
- 18.2.10.1. Overview
- 18.2.10.2. Products
- 18.2.10.3. SWOT Analysis
- 18.2.10.4. Recent Developments
- 18.2.10.5. Financials (Based on Availability)
- 18.2.11 SAP SE
- 18.2.11.1. Overview
- 18.2.11.2. Products
- 18.2.11.3. SWOT Analysis
- 18.2.11.4. Recent Developments
- 18.2.11.5. Financials (Based on Availability)
- 18.2.1 SAS Institute Inc
List of Figures
- Figure 1: Global BI Market Revenue Breakdown (Million, %) by Region 2024 & 2032
- Figure 2: North America BI Market Revenue (Million), by Country 2024 & 2032
- Figure 3: North America BI Market Revenue Share (%), by Country 2024 & 2032
- Figure 4: Europe BI Market Revenue (Million), by Country 2024 & 2032
- Figure 5: Europe BI Market Revenue Share (%), by Country 2024 & 2032
- Figure 6: Asia BI Market Revenue (Million), by Country 2024 & 2032
- Figure 7: Asia BI Market Revenue Share (%), by Country 2024 & 2032
- Figure 8: Australia and New Zealand BI Market Revenue (Million), by Country 2024 & 2032
- Figure 9: Australia and New Zealand BI Market Revenue Share (%), by Country 2024 & 2032
- Figure 10: Latin America BI Market Revenue (Million), by Country 2024 & 2032
- Figure 11: Latin America BI Market Revenue Share (%), by Country 2024 & 2032
- Figure 12: Middle East and Africa BI Market Revenue (Million), by Country 2024 & 2032
- Figure 13: Middle East and Africa BI Market Revenue Share (%), by Country 2024 & 2032
- Figure 14: North America BI Market Revenue (Million), by Component 2024 & 2032
- Figure 15: North America BI Market Revenue Share (%), by Component 2024 & 2032
- Figure 16: North America BI Market Revenue (Million), by Deployment 2024 & 2032
- Figure 17: North America BI Market Revenue Share (%), by Deployment 2024 & 2032
- Figure 18: North America BI Market Revenue (Million), by End-User Industry 2024 & 2032
- Figure 19: North America BI Market Revenue Share (%), by End-User Industry 2024 & 2032
- Figure 20: North America BI Market Revenue (Million), by Country 2024 & 2032
- Figure 21: North America BI Market Revenue Share (%), by Country 2024 & 2032
- Figure 22: Europe BI Market Revenue (Million), by Component 2024 & 2032
- Figure 23: Europe BI Market Revenue Share (%), by Component 2024 & 2032
- Figure 24: Europe BI Market Revenue (Million), by Deployment 2024 & 2032
- Figure 25: Europe BI Market Revenue Share (%), by Deployment 2024 & 2032
- Figure 26: Europe BI Market Revenue (Million), by End-User Industry 2024 & 2032
- Figure 27: Europe BI Market Revenue Share (%), by End-User Industry 2024 & 2032
- Figure 28: Europe BI Market Revenue (Million), by Country 2024 & 2032
- Figure 29: Europe BI Market Revenue Share (%), by Country 2024 & 2032
- Figure 30: Asia BI Market Revenue (Million), by Component 2024 & 2032
- Figure 31: Asia BI Market Revenue Share (%), by Component 2024 & 2032
- Figure 32: Asia BI Market Revenue (Million), by Deployment 2024 & 2032
- Figure 33: Asia BI Market Revenue Share (%), by Deployment 2024 & 2032
- Figure 34: Asia BI Market Revenue (Million), by End-User Industry 2024 & 2032
- Figure 35: Asia BI Market Revenue Share (%), by End-User Industry 2024 & 2032
- Figure 36: Asia BI Market Revenue (Million), by Country 2024 & 2032
- Figure 37: Asia BI Market Revenue Share (%), by Country 2024 & 2032
- Figure 38: Australia and New Zealand BI Market Revenue (Million), by Component 2024 & 2032
- Figure 39: Australia and New Zealand BI Market Revenue Share (%), by Component 2024 & 2032
- Figure 40: Australia and New Zealand BI Market Revenue (Million), by Deployment 2024 & 2032
- Figure 41: Australia and New Zealand BI Market Revenue Share (%), by Deployment 2024 & 2032
- Figure 42: Australia and New Zealand BI Market Revenue (Million), by End-User Industry 2024 & 2032
- Figure 43: Australia and New Zealand BI Market Revenue Share (%), by End-User Industry 2024 & 2032
- Figure 44: Australia and New Zealand BI Market Revenue (Million), by Country 2024 & 2032
- Figure 45: Australia and New Zealand BI Market Revenue Share (%), by Country 2024 & 2032
- Figure 46: Latin America BI Market Revenue (Million), by Component 2024 & 2032
- Figure 47: Latin America BI Market Revenue Share (%), by Component 2024 & 2032
- Figure 48: Latin America BI Market Revenue (Million), by Deployment 2024 & 2032
- Figure 49: Latin America BI Market Revenue Share (%), by Deployment 2024 & 2032
- Figure 50: Latin America BI Market Revenue (Million), by End-User Industry 2024 & 2032
- Figure 51: Latin America BI Market Revenue Share (%), by End-User Industry 2024 & 2032
- Figure 52: Latin America BI Market Revenue (Million), by Country 2024 & 2032
- Figure 53: Latin America BI Market Revenue Share (%), by Country 2024 & 2032
- Figure 54: Middle East and Africa BI Market Revenue (Million), by Component 2024 & 2032
- Figure 55: Middle East and Africa BI Market Revenue Share (%), by Component 2024 & 2032
- Figure 56: Middle East and Africa BI Market Revenue (Million), by Deployment 2024 & 2032
- Figure 57: Middle East and Africa BI Market Revenue Share (%), by Deployment 2024 & 2032
- Figure 58: Middle East and Africa BI Market Revenue (Million), by End-User Industry 2024 & 2032
- Figure 59: Middle East and Africa BI Market Revenue Share (%), by End-User Industry 2024 & 2032
- Figure 60: Middle East and Africa BI Market Revenue (Million), by Country 2024 & 2032
- Figure 61: Middle East and Africa BI Market Revenue Share (%), by Country 2024 & 2032
List of Tables
- Table 1: Global BI Market Revenue Million Forecast, by Region 2019 & 2032
- Table 2: Global BI Market Revenue Million Forecast, by Component 2019 & 2032
- Table 3: Global BI Market Revenue Million Forecast, by Deployment 2019 & 2032
- Table 4: Global BI Market Revenue Million Forecast, by End-User Industry 2019 & 2032
- Table 5: Global BI Market Revenue Million Forecast, by Region 2019 & 2032
- Table 6: Global BI Market Revenue Million Forecast, by Country 2019 & 2032
- Table 7: BI Market Revenue (Million) Forecast, by Application 2019 & 2032
- Table 8: Global BI Market Revenue Million Forecast, by Country 2019 & 2032
- Table 9: BI Market Revenue (Million) Forecast, by Application 2019 & 2032
- Table 10: Global BI Market Revenue Million Forecast, by Country 2019 & 2032
- Table 11: BI Market Revenue (Million) Forecast, by Application 2019 & 2032
- Table 12: Global BI Market Revenue Million Forecast, by Country 2019 & 2032
- Table 13: BI Market Revenue (Million) Forecast, by Application 2019 & 2032
- Table 14: Global BI Market Revenue Million Forecast, by Country 2019 & 2032
- Table 15: BI Market Revenue (Million) Forecast, by Application 2019 & 2032
- Table 16: Global BI Market Revenue Million Forecast, by Country 2019 & 2032
- Table 17: BI Market Revenue (Million) Forecast, by Application 2019 & 2032
- Table 18: Global BI Market Revenue Million Forecast, by Component 2019 & 2032
- Table 19: Global BI Market Revenue Million Forecast, by Deployment 2019 & 2032
- Table 20: Global BI Market Revenue Million Forecast, by End-User Industry 2019 & 2032
- Table 21: Global BI Market Revenue Million Forecast, by Country 2019 & 2032
- Table 22: Global BI Market Revenue Million Forecast, by Component 2019 & 2032
- Table 23: Global BI Market Revenue Million Forecast, by Deployment 2019 & 2032
- Table 24: Global BI Market Revenue Million Forecast, by End-User Industry 2019 & 2032
- Table 25: Global BI Market Revenue Million Forecast, by Country 2019 & 2032
- Table 26: Global BI Market Revenue Million Forecast, by Component 2019 & 2032
- Table 27: Global BI Market Revenue Million Forecast, by Deployment 2019 & 2032
- Table 28: Global BI Market Revenue Million Forecast, by End-User Industry 2019 & 2032
- Table 29: Global BI Market Revenue Million Forecast, by Country 2019 & 2032
- Table 30: Global BI Market Revenue Million Forecast, by Component 2019 & 2032
- Table 31: Global BI Market Revenue Million Forecast, by Deployment 2019 & 2032
- Table 32: Global BI Market Revenue Million Forecast, by End-User Industry 2019 & 2032
- Table 33: Global BI Market Revenue Million Forecast, by Country 2019 & 2032
- Table 34: Global BI Market Revenue Million Forecast, by Component 2019 & 2032
- Table 35: Global BI Market Revenue Million Forecast, by Deployment 2019 & 2032
- Table 36: Global BI Market Revenue Million Forecast, by End-User Industry 2019 & 2032
- Table 37: Global BI Market Revenue Million Forecast, by Country 2019 & 2032
- Table 38: Global BI Market Revenue Million Forecast, by Component 2019 & 2032
- Table 39: Global BI Market Revenue Million Forecast, by Deployment 2019 & 2032
- Table 40: Global BI Market Revenue Million Forecast, by End-User Industry 2019 & 2032
- Table 41: Global BI Market Revenue Million Forecast, by Country 2019 & 2032
Frequently Asked Questions
1. What is the projected Compound Annual Growth Rate (CAGR) of the BI Market?
The projected CAGR is approximately 13.16%.
2. Which companies are prominent players in the BI Market?
Key companies in the market include SAS Institute Inc, GoodData Corporation, Cisco Systems Inc, Microsoft Corporation, Rackspace US Inc, International Business Machines Corporation, Tableau Software Inc (Salesforce)*List Not Exhaustive, Oracle Corporation, Targit AS, VMware Inc, SAP SE.
3. What are the main segments of the BI Market?
The market segments include Component, Deployment, End-User Industry.
4. Can you provide details about the market size?
The market size is estimated to be USD 33.34 Million as of 2022.
5. What are some drivers contributing to market growth?
Increasing Adoption of Data Analytics by Enterprises; Emergence of IoT-Enabled Technologies.
6. What are the notable trends driving market growth?
BFSI Industry is Expected to Drive the Market Growth.
7. Are there any restraints impacting market growth?
High Investment Costs for On-Premise Solutions; Lack of Skilled Professionals.
8. Can you provide examples of recent developments in the market?
May 2023: Rackspace US Inc announced Object Storage which enables organizations securely store and utilize large pools of unstructured data, where Rackspace Object Storage saves substantial costs by eliminating data egress, retrieval, and transaction charges. In many cases, the Rackspace Object Storage solution can save more than 80% over hyper-scale cloud storage options. For multi-cloud customers operating modern S3-enabled applications, this is a new paradigm that facilitates better performance and lower costs, even as data-intensive applications continue to drive up the need for storage,
9. What pricing options are available for accessing the report?
Pricing options include single-user, multi-user, and enterprise licenses priced at USD 4750, USD 5250, and USD 8750 respectively.
10. Is the market size provided in terms of value or volume?
The market size is provided in terms of value, measured in Million.
11. Are there any specific market keywords associated with the report?
Yes, the market keyword associated with the report is "BI Market," which aids in identifying and referencing the specific market segment covered.
12. How do I determine which pricing option suits my needs best?
The pricing options vary based on user requirements and access needs. Individual users may opt for single-user licenses, while businesses requiring broader access may choose multi-user or enterprise licenses for cost-effective access to the report.
13. Are there any additional resources or data provided in the BI Market report?
While the report offers comprehensive insights, it's advisable to review the specific contents or supplementary materials provided to ascertain if additional resources or data are available.
14. How can I stay updated on further developments or reports in the BI Market?
To stay informed about further developments, trends, and reports in the BI Market, consider subscribing to industry newsletters, following relevant companies and organizations, or regularly checking reputable industry news sources and publications.
Methodology
Step 1 - Identification of Relevant Samples Size from Population Database


Step 2 - Approaches for Defining Global Market Size (Value, Volume* & Price*)

Note*: In applicable scenarios
Step 3 - Data Sources
Primary Research
- Web Analytics
- Survey Reports
- Research Institute
- Latest Research Reports
- Opinion Leaders
Secondary Research
- Annual Reports
- White Paper
- Latest Press Release
- Industry Association
- Paid Database
- Investor Presentations

Step 4 - Data Triangulation
Involves using different sources of information in order to increase the validity of a study
These sources are likely to be stakeholders in a program - participants, other researchers, program staff, other community members, and so on.
Then we put all data in single framework & apply various statistical tools to find out the dynamic on the market.
During the analysis stage, feedback from the stakeholder groups would be compared to determine areas of agreement as well as areas of divergence
