

Key Insights
The global automotive hydraulic systems market is experiencing robust growth, driven by increasing demand for advanced driver-assistance systems (ADAS) and the rising adoption of electric and hybrid vehicles. The market's expansion is fueled by the need for efficient and reliable braking, steering, and suspension systems, particularly in commercial vehicles and heavy-duty applications. Technological advancements, such as the integration of electro-hydraulic systems and the development of more efficient and compact hydraulic components, are further propelling market growth. Key players like Bosch, ZF Friedrichshafen, and Continental are investing heavily in research and development to improve system performance, reduce energy consumption, and enhance safety features. The market is segmented by vehicle type (passenger cars, commercial vehicles), system type (braking, steering, suspension), and geographical region. While the market faces some restraints, such as the increasing adoption of alternative braking technologies like electromechanical systems in certain vehicle segments, the overall growth trajectory remains positive, with a projected CAGR of approximately 5-7% between 2025 and 2033. This growth is largely attributed to the continuous expansion of the automotive industry and the ongoing demand for advanced safety and performance features in vehicles globally.
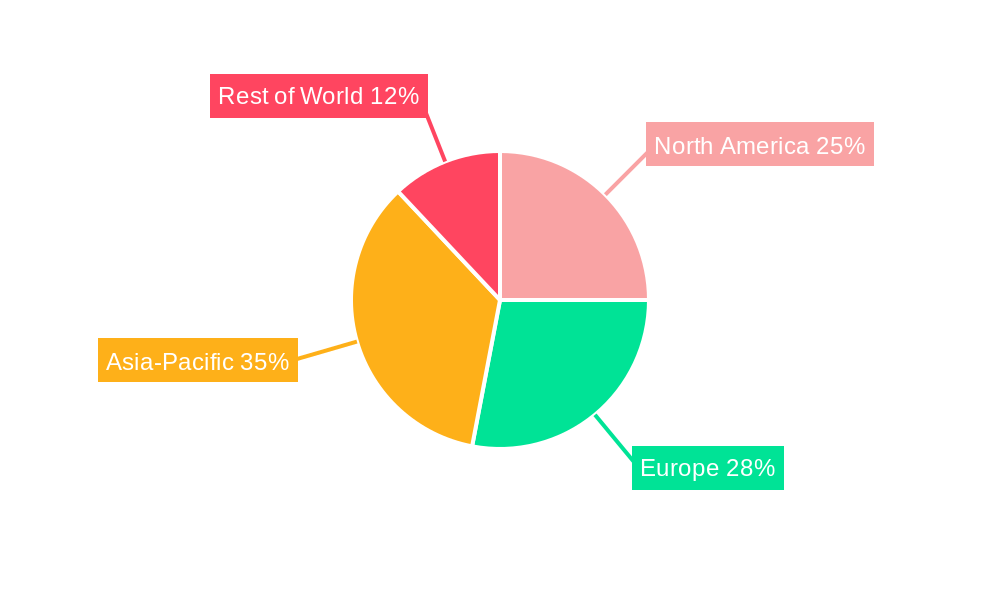
Growth in the automotive hydraulic systems market is significantly impacted by factors such as stringent government regulations on vehicle safety and emissions. Furthermore, the increasing demand for enhanced fuel efficiency in vehicles pushes manufacturers to optimize hydraulic systems for reduced energy consumption. The Asia-Pacific region is expected to dominate the market, driven by substantial automotive production and a growing middle class leading to greater vehicle ownership. North America and Europe will maintain significant market shares due to established automotive industries and high adoption rates of advanced technologies. However, competitive pressures and the potential for disruptive technologies to emerge may impact the profitability of individual market players. Continuous innovation and strategic partnerships will be crucial for companies to maintain their market position and capitalize on growth opportunities in the years ahead.
Automotive Hydraulic Systems Market: A Comprehensive Report (2019-2033)
This in-depth report provides a comprehensive analysis of the global Automotive Hydraulic Systems market, offering invaluable insights for stakeholders across the automotive industry. Valued at $XX million in 2025, the market is poised for significant growth, reaching an estimated $XX million by 2033. This report covers the historical period (2019-2024), the base year (2025), and forecasts the market's trajectory until 2033. Key players like Bosch, ZF Friedrichshafen, Borgwarner, JTEKT, Aisin Seiki, Continental, Schaeffler, Wabco, GKN, and Valeo are thoroughly examined, revealing their market positioning and strategic initiatives.
Automotive Hydraulic Systems Market Composition & Trends
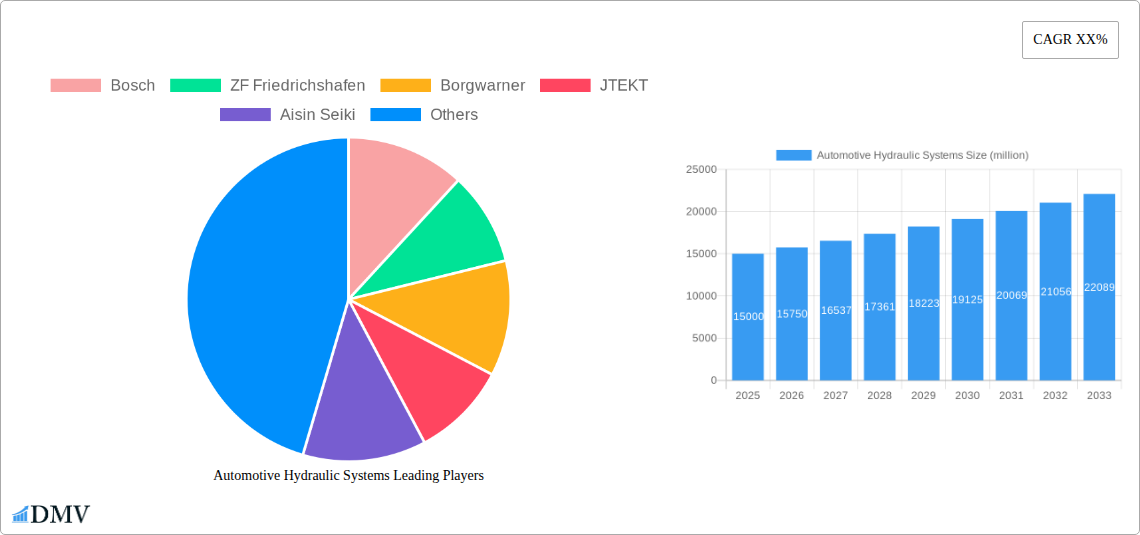
This section delves into the intricate structure of the automotive hydraulic systems market, analyzing market concentration, innovative drivers, regulatory influences, substitute product emergence, end-user profiles, and mergers & acquisitions (M&A) activities. The market exhibits a moderately consolidated structure, with the top five players commanding approximately 60% of the global market share in 2025. Bosch holds the leading position, followed by ZF Friedrichshafen and BorgWarner.
- Market Share Distribution (2025): Bosch (20%), ZF Friedrichshafen (15%), BorgWarner (10%), JTEKT (8%), Aisin Seiki (7%). Others (40%)
- Innovation Catalysts: Advancements in electro-hydraulic systems, improved efficiency, and stricter emission regulations are driving innovation.
- Regulatory Landscape: Stringent safety standards and fuel efficiency regulations are shaping product development and market growth.
- Substitute Products: The rise of electric and hybrid vehicles presents challenges, although hydraulic systems still hold significant importance in several applications.
- End-User Profiles: The primary end-users are passenger car manufacturers, commercial vehicle manufacturers, and aftermarket suppliers.
- M&A Activities: The past five years have witnessed approximately $XX million in M&A deals within the automotive hydraulic systems sector, driven by the need for technological synergy and market expansion. These deals predominantly focused on technology integration and global reach.
Automotive Hydraulic Systems Industry Evolution
This section meticulously traces the evolution of the automotive hydraulic systems market, charting its growth trajectory, technological advancements, and evolving consumer preferences. From 2019 to 2024, the market experienced a Compound Annual Growth Rate (CAGR) of XX%, primarily driven by increasing vehicle production, particularly in emerging markets. The forecast period (2025-2033) anticipates a CAGR of XX%, fueled by factors such as the growing adoption of advanced driver-assistance systems (ADAS) and the rising demand for improved vehicle safety and performance. Technological advancements, including the integration of electronic control units (ECUs) and the development of more efficient hydraulic pumps, are crucial growth drivers. Shifting consumer preferences towards fuel-efficient and environmentally friendly vehicles are shaping the demand for advanced hydraulic systems that contribute to reduced emissions. The integration of hydraulic systems with electric and hybrid powertrains is also expected to contribute significantly to market growth.
Leading Regions, Countries, or Segments in Automotive Hydraulic Systems
The Asia-Pacific region dominated the automotive hydraulic systems market in 2025, accounting for approximately 45% of global revenue. This dominance is primarily attributed to the rapid expansion of the automotive industry in China and India, coupled with substantial investments in automotive infrastructure.
- Key Drivers for Asia-Pacific Dominance:
- High vehicle production volume
- Significant investments in automotive manufacturing
- Growing demand for advanced safety features in vehicles.
- Europe and North America: These regions exhibit stable growth, driven by technological innovation and stringent environmental regulations.
The passenger car segment holds the largest market share, fueled by increasing vehicle production and rising demand for comfort and safety features.
Automotive Hydraulic Systems Product Innovations
Recent innovations in automotive hydraulic systems focus on improving efficiency, reducing weight, and enhancing performance. The introduction of electro-hydraulic braking systems, regenerative braking technologies, and advanced hydraulic power steering systems is reshaping the market landscape. These innovations offer enhanced fuel efficiency, improved vehicle dynamics, and enhanced driver safety, thus shaping the unique selling propositions and driving market growth.
Propelling Factors for Automotive Hydraulic Systems Growth
Several factors contribute to the growth of the automotive hydraulic systems market. Technological advancements like the development of more energy-efficient hydraulic pumps and the integration of electronic control units (ECUs) are key drivers. The rising demand for improved vehicle safety and comfort features, especially ADAS, is also fueling market expansion. Furthermore, favorable government regulations and incentives promoting fuel efficiency and reduced emissions are accelerating the adoption of advanced hydraulic systems.
Obstacles in the Automotive Hydraulic Systems Market
Despite its growth potential, the automotive hydraulic systems market faces challenges. Fluctuations in raw material prices and supply chain disruptions can impact production costs and profitability. Intense competition among established players and the emergence of new entrants put pressure on pricing and margins. Stricter emission regulations and the shift towards electric and hybrid vehicles also pose challenges, as traditional hydraulic systems may face limitations in these vehicle types. These factors may collectively reduce the market growth by approximately XX% in the forecast period.
Future Opportunities in Automotive Hydraulic Systems
Future opportunities lie in the development of next-generation hydraulic systems for electric and hybrid vehicles, focusing on improved efficiency and integration with electric powertrains. The increasing demand for advanced driver-assistance systems (ADAS) and autonomous driving technologies creates substantial growth opportunities for innovative hydraulic braking, steering, and suspension systems. Expansion into emerging markets and the development of customized solutions for specific vehicle types offer further growth potential.
Major Players in the Automotive Hydraulic Systems Ecosystem
Key Developments in Automotive Hydraulic Systems Industry
- January 2023: Bosch launched a new generation of electro-hydraulic brake booster, improving braking efficiency and responsiveness.
- June 2022: ZF Friedrichshafen and a leading Chinese automotive supplier announced a joint venture to develop advanced hydraulic systems for the Chinese market.
- October 2021: BorgWarner acquired a smaller competitor, expanding its product portfolio and market share. (Further details on acquisitions and launches for remaining years can be added)
Strategic Automotive Hydraulic Systems Market Forecast
The automotive hydraulic systems market is projected to witness robust growth throughout the forecast period (2025-2033), driven by technological advancements, rising demand for advanced safety features, and increased vehicle production globally. Emerging opportunities in electric and autonomous vehicles will significantly shape market dynamics. The focus on improving energy efficiency and integrating hydraulic systems seamlessly with other vehicle components will continue to drive innovation and market expansion, with significant growth expected particularly in the Asia-Pacific region.
Automotive Hydraulic Systems Segmentation
-
1. Application
- 1.1. Passenger Vehicle
- 1.2. Commercial Vehicle
-
2. Types
- 2.1. Hydraulic Brakes
- 2.2. Hydraulic Clutch
- 2.3. Hydraulic Suspension
- 2.4. Hydraulic Tappets
- 2.5. Others
Automotive Hydraulic Systems Segmentation By Geography
-
1. North America
- 1.1. United States
- 1.2. Canada
- 1.3. Mexico
-
2. South America
- 2.1. Brazil
- 2.2. Argentina
- 2.3. Rest of South America
-
3. Europe
- 3.1. United Kingdom
- 3.2. Germany
- 3.3. France
- 3.4. Italy
- 3.5. Spain
- 3.6. Russia
- 3.7. Benelux
- 3.8. Nordics
- 3.9. Rest of Europe
-
4. Middle East & Africa
- 4.1. Turkey
- 4.2. Israel
- 4.3. GCC
- 4.4. North Africa
- 4.5. South Africa
- 4.6. Rest of Middle East & Africa
-
5. Asia Pacific
- 5.1. China
- 5.2. India
- 5.3. Japan
- 5.4. South Korea
- 5.5. ASEAN
- 5.6. Oceania
- 5.7. Rest of Asia Pacific
Automotive Hydraulic Systems REPORT HIGHLIGHTS
| Aspects | Details |
|---|---|
| Study Period | 2019-2033 |
| Base Year | 2024 |
| Estimated Year | 2025 |
| Forecast Period | 2025-2033 |
| Historical Period | 2019-2024 |
| Growth Rate | CAGR of XX% from 2019-2033 |
| Segmentation |
|
Table of Contents
- 1. Introduction
- 1.1. Research Scope
- 1.2. Market Segmentation
- 1.3. Research Methodology
- 1.4. Definitions and Assumptions
- 2. Executive Summary
- 2.1. Introduction
- 3. Market Dynamics
- 3.1. Introduction
- 3.2. Market Drivers
- 3.3. Market Restrains
- 3.4. Market Trends
- 4. Market Factor Analysis
- 4.1. Porters Five Forces
- 4.2. Supply/Value Chain
- 4.3. PESTEL analysis
- 4.4. Market Entropy
- 4.5. Patent/Trademark Analysis
- 5. Global Automotive Hydraulic Systems Analysis, Insights and Forecast, 2019-2031
- 5.1. Market Analysis, Insights and Forecast - by Application
- 5.1.1. Passenger Vehicle
- 5.1.2. Commercial Vehicle
- 5.2. Market Analysis, Insights and Forecast - by Types
- 5.2.1. Hydraulic Brakes
- 5.2.2. Hydraulic Clutch
- 5.2.3. Hydraulic Suspension
- 5.2.4. Hydraulic Tappets
- 5.2.5. Others
- 5.3. Market Analysis, Insights and Forecast - by Region
- 5.3.1. North America
- 5.3.2. South America
- 5.3.3. Europe
- 5.3.4. Middle East & Africa
- 5.3.5. Asia Pacific
- 5.1. Market Analysis, Insights and Forecast - by Application
- 6. North America Automotive Hydraulic Systems Analysis, Insights and Forecast, 2019-2031
- 6.1. Market Analysis, Insights and Forecast - by Application
- 6.1.1. Passenger Vehicle
- 6.1.2. Commercial Vehicle
- 6.2. Market Analysis, Insights and Forecast - by Types
- 6.2.1. Hydraulic Brakes
- 6.2.2. Hydraulic Clutch
- 6.2.3. Hydraulic Suspension
- 6.2.4. Hydraulic Tappets
- 6.2.5. Others
- 6.1. Market Analysis, Insights and Forecast - by Application
- 7. South America Automotive Hydraulic Systems Analysis, Insights and Forecast, 2019-2031
- 7.1. Market Analysis, Insights and Forecast - by Application
- 7.1.1. Passenger Vehicle
- 7.1.2. Commercial Vehicle
- 7.2. Market Analysis, Insights and Forecast - by Types
- 7.2.1. Hydraulic Brakes
- 7.2.2. Hydraulic Clutch
- 7.2.3. Hydraulic Suspension
- 7.2.4. Hydraulic Tappets
- 7.2.5. Others
- 7.1. Market Analysis, Insights and Forecast - by Application
- 8. Europe Automotive Hydraulic Systems Analysis, Insights and Forecast, 2019-2031
- 8.1. Market Analysis, Insights and Forecast - by Application
- 8.1.1. Passenger Vehicle
- 8.1.2. Commercial Vehicle
- 8.2. Market Analysis, Insights and Forecast - by Types
- 8.2.1. Hydraulic Brakes
- 8.2.2. Hydraulic Clutch
- 8.2.3. Hydraulic Suspension
- 8.2.4. Hydraulic Tappets
- 8.2.5. Others
- 8.1. Market Analysis, Insights and Forecast - by Application
- 9. Middle East & Africa Automotive Hydraulic Systems Analysis, Insights and Forecast, 2019-2031
- 9.1. Market Analysis, Insights and Forecast - by Application
- 9.1.1. Passenger Vehicle
- 9.1.2. Commercial Vehicle
- 9.2. Market Analysis, Insights and Forecast - by Types
- 9.2.1. Hydraulic Brakes
- 9.2.2. Hydraulic Clutch
- 9.2.3. Hydraulic Suspension
- 9.2.4. Hydraulic Tappets
- 9.2.5. Others
- 9.1. Market Analysis, Insights and Forecast - by Application
- 10. Asia Pacific Automotive Hydraulic Systems Analysis, Insights and Forecast, 2019-2031
- 10.1. Market Analysis, Insights and Forecast - by Application
- 10.1.1. Passenger Vehicle
- 10.1.2. Commercial Vehicle
- 10.2. Market Analysis, Insights and Forecast - by Types
- 10.2.1. Hydraulic Brakes
- 10.2.2. Hydraulic Clutch
- 10.2.3. Hydraulic Suspension
- 10.2.4. Hydraulic Tappets
- 10.2.5. Others
- 10.1. Market Analysis, Insights and Forecast - by Application
- 11. Competitive Analysis
- 11.1. Global Market Share Analysis 2024
- 11.2. Company Profiles
- 11.2.1 Bosch
- 11.2.1.1. Overview
- 11.2.1.2. Products
- 11.2.1.3. SWOT Analysis
- 11.2.1.4. Recent Developments
- 11.2.1.5. Financials (Based on Availability)
- 11.2.2 ZF Friedrichshafen
- 11.2.2.1. Overview
- 11.2.2.2. Products
- 11.2.2.3. SWOT Analysis
- 11.2.2.4. Recent Developments
- 11.2.2.5. Financials (Based on Availability)
- 11.2.3 Borgwarner
- 11.2.3.1. Overview
- 11.2.3.2. Products
- 11.2.3.3. SWOT Analysis
- 11.2.3.4. Recent Developments
- 11.2.3.5. Financials (Based on Availability)
- 11.2.4 JTEKT
- 11.2.4.1. Overview
- 11.2.4.2. Products
- 11.2.4.3. SWOT Analysis
- 11.2.4.4. Recent Developments
- 11.2.4.5. Financials (Based on Availability)
- 11.2.5 Aisin Seiki
- 11.2.5.1. Overview
- 11.2.5.2. Products
- 11.2.5.3. SWOT Analysis
- 11.2.5.4. Recent Developments
- 11.2.5.5. Financials (Based on Availability)
- 11.2.6 Continental
- 11.2.6.1. Overview
- 11.2.6.2. Products
- 11.2.6.3. SWOT Analysis
- 11.2.6.4. Recent Developments
- 11.2.6.5. Financials (Based on Availability)
- 11.2.7 Schaeffler
- 11.2.7.1. Overview
- 11.2.7.2. Products
- 11.2.7.3. SWOT Analysis
- 11.2.7.4. Recent Developments
- 11.2.7.5. Financials (Based on Availability)
- 11.2.8 Wabco
- 11.2.8.1. Overview
- 11.2.8.2. Products
- 11.2.8.3. SWOT Analysis
- 11.2.8.4. Recent Developments
- 11.2.8.5. Financials (Based on Availability)
- 11.2.9 GKN
- 11.2.9.1. Overview
- 11.2.9.2. Products
- 11.2.9.3. SWOT Analysis
- 11.2.9.4. Recent Developments
- 11.2.9.5. Financials (Based on Availability)
- 11.2.10 Valeo
- 11.2.10.1. Overview
- 11.2.10.2. Products
- 11.2.10.3. SWOT Analysis
- 11.2.10.4. Recent Developments
- 11.2.10.5. Financials (Based on Availability)
- 11.2.1 Bosch
List of Figures
- Figure 1: Global Automotive Hydraulic Systems Revenue Breakdown (million, %) by Region 2024 & 2032
- Figure 2: Global Automotive Hydraulic Systems Volume Breakdown (K, %) by Region 2024 & 2032
- Figure 3: North America Automotive Hydraulic Systems Revenue (million), by Application 2024 & 2032
- Figure 4: North America Automotive Hydraulic Systems Volume (K), by Application 2024 & 2032
- Figure 5: North America Automotive Hydraulic Systems Revenue Share (%), by Application 2024 & 2032
- Figure 6: North America Automotive Hydraulic Systems Volume Share (%), by Application 2024 & 2032
- Figure 7: North America Automotive Hydraulic Systems Revenue (million), by Types 2024 & 2032
- Figure 8: North America Automotive Hydraulic Systems Volume (K), by Types 2024 & 2032
- Figure 9: North America Automotive Hydraulic Systems Revenue Share (%), by Types 2024 & 2032
- Figure 10: North America Automotive Hydraulic Systems Volume Share (%), by Types 2024 & 2032
- Figure 11: North America Automotive Hydraulic Systems Revenue (million), by Country 2024 & 2032
- Figure 12: North America Automotive Hydraulic Systems Volume (K), by Country 2024 & 2032
- Figure 13: North America Automotive Hydraulic Systems Revenue Share (%), by Country 2024 & 2032
- Figure 14: North America Automotive Hydraulic Systems Volume Share (%), by Country 2024 & 2032
- Figure 15: South America Automotive Hydraulic Systems Revenue (million), by Application 2024 & 2032
- Figure 16: South America Automotive Hydraulic Systems Volume (K), by Application 2024 & 2032
- Figure 17: South America Automotive Hydraulic Systems Revenue Share (%), by Application 2024 & 2032
- Figure 18: South America Automotive Hydraulic Systems Volume Share (%), by Application 2024 & 2032
- Figure 19: South America Automotive Hydraulic Systems Revenue (million), by Types 2024 & 2032
- Figure 20: South America Automotive Hydraulic Systems Volume (K), by Types 2024 & 2032
- Figure 21: South America Automotive Hydraulic Systems Revenue Share (%), by Types 2024 & 2032
- Figure 22: South America Automotive Hydraulic Systems Volume Share (%), by Types 2024 & 2032
- Figure 23: South America Automotive Hydraulic Systems Revenue (million), by Country 2024 & 2032
- Figure 24: South America Automotive Hydraulic Systems Volume (K), by Country 2024 & 2032
- Figure 25: South America Automotive Hydraulic Systems Revenue Share (%), by Country 2024 & 2032
- Figure 26: South America Automotive Hydraulic Systems Volume Share (%), by Country 2024 & 2032
- Figure 27: Europe Automotive Hydraulic Systems Revenue (million), by Application 2024 & 2032
- Figure 28: Europe Automotive Hydraulic Systems Volume (K), by Application 2024 & 2032
- Figure 29: Europe Automotive Hydraulic Systems Revenue Share (%), by Application 2024 & 2032
- Figure 30: Europe Automotive Hydraulic Systems Volume Share (%), by Application 2024 & 2032
- Figure 31: Europe Automotive Hydraulic Systems Revenue (million), by Types 2024 & 2032
- Figure 32: Europe Automotive Hydraulic Systems Volume (K), by Types 2024 & 2032
- Figure 33: Europe Automotive Hydraulic Systems Revenue Share (%), by Types 2024 & 2032
- Figure 34: Europe Automotive Hydraulic Systems Volume Share (%), by Types 2024 & 2032
- Figure 35: Europe Automotive Hydraulic Systems Revenue (million), by Country 2024 & 2032
- Figure 36: Europe Automotive Hydraulic Systems Volume (K), by Country 2024 & 2032
- Figure 37: Europe Automotive Hydraulic Systems Revenue Share (%), by Country 2024 & 2032
- Figure 38: Europe Automotive Hydraulic Systems Volume Share (%), by Country 2024 & 2032
- Figure 39: Middle East & Africa Automotive Hydraulic Systems Revenue (million), by Application 2024 & 2032
- Figure 40: Middle East & Africa Automotive Hydraulic Systems Volume (K), by Application 2024 & 2032
- Figure 41: Middle East & Africa Automotive Hydraulic Systems Revenue Share (%), by Application 2024 & 2032
- Figure 42: Middle East & Africa Automotive Hydraulic Systems Volume Share (%), by Application 2024 & 2032
- Figure 43: Middle East & Africa Automotive Hydraulic Systems Revenue (million), by Types 2024 & 2032
- Figure 44: Middle East & Africa Automotive Hydraulic Systems Volume (K), by Types 2024 & 2032
- Figure 45: Middle East & Africa Automotive Hydraulic Systems Revenue Share (%), by Types 2024 & 2032
- Figure 46: Middle East & Africa Automotive Hydraulic Systems Volume Share (%), by Types 2024 & 2032
- Figure 47: Middle East & Africa Automotive Hydraulic Systems Revenue (million), by Country 2024 & 2032
- Figure 48: Middle East & Africa Automotive Hydraulic Systems Volume (K), by Country 2024 & 2032
- Figure 49: Middle East & Africa Automotive Hydraulic Systems Revenue Share (%), by Country 2024 & 2032
- Figure 50: Middle East & Africa Automotive Hydraulic Systems Volume Share (%), by Country 2024 & 2032
- Figure 51: Asia Pacific Automotive Hydraulic Systems Revenue (million), by Application 2024 & 2032
- Figure 52: Asia Pacific Automotive Hydraulic Systems Volume (K), by Application 2024 & 2032
- Figure 53: Asia Pacific Automotive Hydraulic Systems Revenue Share (%), by Application 2024 & 2032
- Figure 54: Asia Pacific Automotive Hydraulic Systems Volume Share (%), by Application 2024 & 2032
- Figure 55: Asia Pacific Automotive Hydraulic Systems Revenue (million), by Types 2024 & 2032
- Figure 56: Asia Pacific Automotive Hydraulic Systems Volume (K), by Types 2024 & 2032
- Figure 57: Asia Pacific Automotive Hydraulic Systems Revenue Share (%), by Types 2024 & 2032
- Figure 58: Asia Pacific Automotive Hydraulic Systems Volume Share (%), by Types 2024 & 2032
- Figure 59: Asia Pacific Automotive Hydraulic Systems Revenue (million), by Country 2024 & 2032
- Figure 60: Asia Pacific Automotive Hydraulic Systems Volume (K), by Country 2024 & 2032
- Figure 61: Asia Pacific Automotive Hydraulic Systems Revenue Share (%), by Country 2024 & 2032
- Figure 62: Asia Pacific Automotive Hydraulic Systems Volume Share (%), by Country 2024 & 2032
List of Tables
- Table 1: Global Automotive Hydraulic Systems Revenue million Forecast, by Region 2019 & 2032
- Table 2: Global Automotive Hydraulic Systems Volume K Forecast, by Region 2019 & 2032
- Table 3: Global Automotive Hydraulic Systems Revenue million Forecast, by Application 2019 & 2032
- Table 4: Global Automotive Hydraulic Systems Volume K Forecast, by Application 2019 & 2032
- Table 5: Global Automotive Hydraulic Systems Revenue million Forecast, by Types 2019 & 2032
- Table 6: Global Automotive Hydraulic Systems Volume K Forecast, by Types 2019 & 2032
- Table 7: Global Automotive Hydraulic Systems Revenue million Forecast, by Region 2019 & 2032
- Table 8: Global Automotive Hydraulic Systems Volume K Forecast, by Region 2019 & 2032
- Table 9: Global Automotive Hydraulic Systems Revenue million Forecast, by Application 2019 & 2032
- Table 10: Global Automotive Hydraulic Systems Volume K Forecast, by Application 2019 & 2032
- Table 11: Global Automotive Hydraulic Systems Revenue million Forecast, by Types 2019 & 2032
- Table 12: Global Automotive Hydraulic Systems Volume K Forecast, by Types 2019 & 2032
- Table 13: Global Automotive Hydraulic Systems Revenue million Forecast, by Country 2019 & 2032
- Table 14: Global Automotive Hydraulic Systems Volume K Forecast, by Country 2019 & 2032
- Table 15: United States Automotive Hydraulic Systems Revenue (million) Forecast, by Application 2019 & 2032
- Table 16: United States Automotive Hydraulic Systems Volume (K) Forecast, by Application 2019 & 2032
- Table 17: Canada Automotive Hydraulic Systems Revenue (million) Forecast, by Application 2019 & 2032
- Table 18: Canada Automotive Hydraulic Systems Volume (K) Forecast, by Application 2019 & 2032
- Table 19: Mexico Automotive Hydraulic Systems Revenue (million) Forecast, by Application 2019 & 2032
- Table 20: Mexico Automotive Hydraulic Systems Volume (K) Forecast, by Application 2019 & 2032
- Table 21: Global Automotive Hydraulic Systems Revenue million Forecast, by Application 2019 & 2032
- Table 22: Global Automotive Hydraulic Systems Volume K Forecast, by Application 2019 & 2032
- Table 23: Global Automotive Hydraulic Systems Revenue million Forecast, by Types 2019 & 2032
- Table 24: Global Automotive Hydraulic Systems Volume K Forecast, by Types 2019 & 2032
- Table 25: Global Automotive Hydraulic Systems Revenue million Forecast, by Country 2019 & 2032
- Table 26: Global Automotive Hydraulic Systems Volume K Forecast, by Country 2019 & 2032
- Table 27: Brazil Automotive Hydraulic Systems Revenue (million) Forecast, by Application 2019 & 2032
- Table 28: Brazil Automotive Hydraulic Systems Volume (K) Forecast, by Application 2019 & 2032
- Table 29: Argentina Automotive Hydraulic Systems Revenue (million) Forecast, by Application 2019 & 2032
- Table 30: Argentina Automotive Hydraulic Systems Volume (K) Forecast, by Application 2019 & 2032
- Table 31: Rest of South America Automotive Hydraulic Systems Revenue (million) Forecast, by Application 2019 & 2032
- Table 32: Rest of South America Automotive Hydraulic Systems Volume (K) Forecast, by Application 2019 & 2032
- Table 33: Global Automotive Hydraulic Systems Revenue million Forecast, by Application 2019 & 2032
- Table 34: Global Automotive Hydraulic Systems Volume K Forecast, by Application 2019 & 2032
- Table 35: Global Automotive Hydraulic Systems Revenue million Forecast, by Types 2019 & 2032
- Table 36: Global Automotive Hydraulic Systems Volume K Forecast, by Types 2019 & 2032
- Table 37: Global Automotive Hydraulic Systems Revenue million Forecast, by Country 2019 & 2032
- Table 38: Global Automotive Hydraulic Systems Volume K Forecast, by Country 2019 & 2032
- Table 39: United Kingdom Automotive Hydraulic Systems Revenue (million) Forecast, by Application 2019 & 2032
- Table 40: United Kingdom Automotive Hydraulic Systems Volume (K) Forecast, by Application 2019 & 2032
- Table 41: Germany Automotive Hydraulic Systems Revenue (million) Forecast, by Application 2019 & 2032
- Table 42: Germany Automotive Hydraulic Systems Volume (K) Forecast, by Application 2019 & 2032
- Table 43: France Automotive Hydraulic Systems Revenue (million) Forecast, by Application 2019 & 2032
- Table 44: France Automotive Hydraulic Systems Volume (K) Forecast, by Application 2019 & 2032
- Table 45: Italy Automotive Hydraulic Systems Revenue (million) Forecast, by Application 2019 & 2032
- Table 46: Italy Automotive Hydraulic Systems Volume (K) Forecast, by Application 2019 & 2032
- Table 47: Spain Automotive Hydraulic Systems Revenue (million) Forecast, by Application 2019 & 2032
- Table 48: Spain Automotive Hydraulic Systems Volume (K) Forecast, by Application 2019 & 2032
- Table 49: Russia Automotive Hydraulic Systems Revenue (million) Forecast, by Application 2019 & 2032
- Table 50: Russia Automotive Hydraulic Systems Volume (K) Forecast, by Application 2019 & 2032
- Table 51: Benelux Automotive Hydraulic Systems Revenue (million) Forecast, by Application 2019 & 2032
- Table 52: Benelux Automotive Hydraulic Systems Volume (K) Forecast, by Application 2019 & 2032
- Table 53: Nordics Automotive Hydraulic Systems Revenue (million) Forecast, by Application 2019 & 2032
- Table 54: Nordics Automotive Hydraulic Systems Volume (K) Forecast, by Application 2019 & 2032
- Table 55: Rest of Europe Automotive Hydraulic Systems Revenue (million) Forecast, by Application 2019 & 2032
- Table 56: Rest of Europe Automotive Hydraulic Systems Volume (K) Forecast, by Application 2019 & 2032
- Table 57: Global Automotive Hydraulic Systems Revenue million Forecast, by Application 2019 & 2032
- Table 58: Global Automotive Hydraulic Systems Volume K Forecast, by Application 2019 & 2032
- Table 59: Global Automotive Hydraulic Systems Revenue million Forecast, by Types 2019 & 2032
- Table 60: Global Automotive Hydraulic Systems Volume K Forecast, by Types 2019 & 2032
- Table 61: Global Automotive Hydraulic Systems Revenue million Forecast, by Country 2019 & 2032
- Table 62: Global Automotive Hydraulic Systems Volume K Forecast, by Country 2019 & 2032
- Table 63: Turkey Automotive Hydraulic Systems Revenue (million) Forecast, by Application 2019 & 2032
- Table 64: Turkey Automotive Hydraulic Systems Volume (K) Forecast, by Application 2019 & 2032
- Table 65: Israel Automotive Hydraulic Systems Revenue (million) Forecast, by Application 2019 & 2032
- Table 66: Israel Automotive Hydraulic Systems Volume (K) Forecast, by Application 2019 & 2032
- Table 67: GCC Automotive Hydraulic Systems Revenue (million) Forecast, by Application 2019 & 2032
- Table 68: GCC Automotive Hydraulic Systems Volume (K) Forecast, by Application 2019 & 2032
- Table 69: North Africa Automotive Hydraulic Systems Revenue (million) Forecast, by Application 2019 & 2032
- Table 70: North Africa Automotive Hydraulic Systems Volume (K) Forecast, by Application 2019 & 2032
- Table 71: South Africa Automotive Hydraulic Systems Revenue (million) Forecast, by Application 2019 & 2032
- Table 72: South Africa Automotive Hydraulic Systems Volume (K) Forecast, by Application 2019 & 2032
- Table 73: Rest of Middle East & Africa Automotive Hydraulic Systems Revenue (million) Forecast, by Application 2019 & 2032
- Table 74: Rest of Middle East & Africa Automotive Hydraulic Systems Volume (K) Forecast, by Application 2019 & 2032
- Table 75: Global Automotive Hydraulic Systems Revenue million Forecast, by Application 2019 & 2032
- Table 76: Global Automotive Hydraulic Systems Volume K Forecast, by Application 2019 & 2032
- Table 77: Global Automotive Hydraulic Systems Revenue million Forecast, by Types 2019 & 2032
- Table 78: Global Automotive Hydraulic Systems Volume K Forecast, by Types 2019 & 2032
- Table 79: Global Automotive Hydraulic Systems Revenue million Forecast, by Country 2019 & 2032
- Table 80: Global Automotive Hydraulic Systems Volume K Forecast, by Country 2019 & 2032
- Table 81: China Automotive Hydraulic Systems Revenue (million) Forecast, by Application 2019 & 2032
- Table 82: China Automotive Hydraulic Systems Volume (K) Forecast, by Application 2019 & 2032
- Table 83: India Automotive Hydraulic Systems Revenue (million) Forecast, by Application 2019 & 2032
- Table 84: India Automotive Hydraulic Systems Volume (K) Forecast, by Application 2019 & 2032
- Table 85: Japan Automotive Hydraulic Systems Revenue (million) Forecast, by Application 2019 & 2032
- Table 86: Japan Automotive Hydraulic Systems Volume (K) Forecast, by Application 2019 & 2032
- Table 87: South Korea Automotive Hydraulic Systems Revenue (million) Forecast, by Application 2019 & 2032
- Table 88: South Korea Automotive Hydraulic Systems Volume (K) Forecast, by Application 2019 & 2032
- Table 89: ASEAN Automotive Hydraulic Systems Revenue (million) Forecast, by Application 2019 & 2032
- Table 90: ASEAN Automotive Hydraulic Systems Volume (K) Forecast, by Application 2019 & 2032
- Table 91: Oceania Automotive Hydraulic Systems Revenue (million) Forecast, by Application 2019 & 2032
- Table 92: Oceania Automotive Hydraulic Systems Volume (K) Forecast, by Application 2019 & 2032
- Table 93: Rest of Asia Pacific Automotive Hydraulic Systems Revenue (million) Forecast, by Application 2019 & 2032
- Table 94: Rest of Asia Pacific Automotive Hydraulic Systems Volume (K) Forecast, by Application 2019 & 2032
Frequently Asked Questions
1. What is the projected Compound Annual Growth Rate (CAGR) of the Automotive Hydraulic Systems?
The projected CAGR is approximately XX%.
2. Which companies are prominent players in the Automotive Hydraulic Systems?
Key companies in the market include Bosch, ZF Friedrichshafen, Borgwarner, JTEKT, Aisin Seiki, Continental, Schaeffler, Wabco, GKN, Valeo.
3. What are the main segments of the Automotive Hydraulic Systems?
The market segments include Application, Types.
4. Can you provide details about the market size?
The market size is estimated to be USD XXX million as of 2022.
5. What are some drivers contributing to market growth?
N/A
6. What are the notable trends driving market growth?
N/A
7. Are there any restraints impacting market growth?
N/A
8. Can you provide examples of recent developments in the market?
N/A
9. What pricing options are available for accessing the report?
Pricing options include single-user, multi-user, and enterprise licenses priced at USD 3350.00, USD 5025.00, and USD 6700.00 respectively.
10. Is the market size provided in terms of value or volume?
The market size is provided in terms of value, measured in million and volume, measured in K.
11. Are there any specific market keywords associated with the report?
Yes, the market keyword associated with the report is "Automotive Hydraulic Systems," which aids in identifying and referencing the specific market segment covered.
12. How do I determine which pricing option suits my needs best?
The pricing options vary based on user requirements and access needs. Individual users may opt for single-user licenses, while businesses requiring broader access may choose multi-user or enterprise licenses for cost-effective access to the report.
13. Are there any additional resources or data provided in the Automotive Hydraulic Systems report?
While the report offers comprehensive insights, it's advisable to review the specific contents or supplementary materials provided to ascertain if additional resources or data are available.
14. How can I stay updated on further developments or reports in the Automotive Hydraulic Systems?
To stay informed about further developments, trends, and reports in the Automotive Hydraulic Systems, consider subscribing to industry newsletters, following relevant companies and organizations, or regularly checking reputable industry news sources and publications.
Methodology
Step 1 - Identification of Relevant Samples Size from Population Database


Step 2 - Approaches for Defining Global Market Size (Value, Volume* & Price*)

Note*: In applicable scenarios
Step 3 - Data Sources
Primary Research
- Web Analytics
- Survey Reports
- Research Institute
- Latest Research Reports
- Opinion Leaders
Secondary Research
- Annual Reports
- White Paper
- Latest Press Release
- Industry Association
- Paid Database
- Investor Presentations

Step 4 - Data Triangulation
Involves using different sources of information in order to increase the validity of a study
These sources are likely to be stakeholders in a program - participants, other researchers, program staff, other community members, and so on.
Then we put all data in single framework & apply various statistical tools to find out the dynamic on the market.
During the analysis stage, feedback from the stakeholder groups would be compared to determine areas of agreement as well as areas of divergence
