

Key Insights
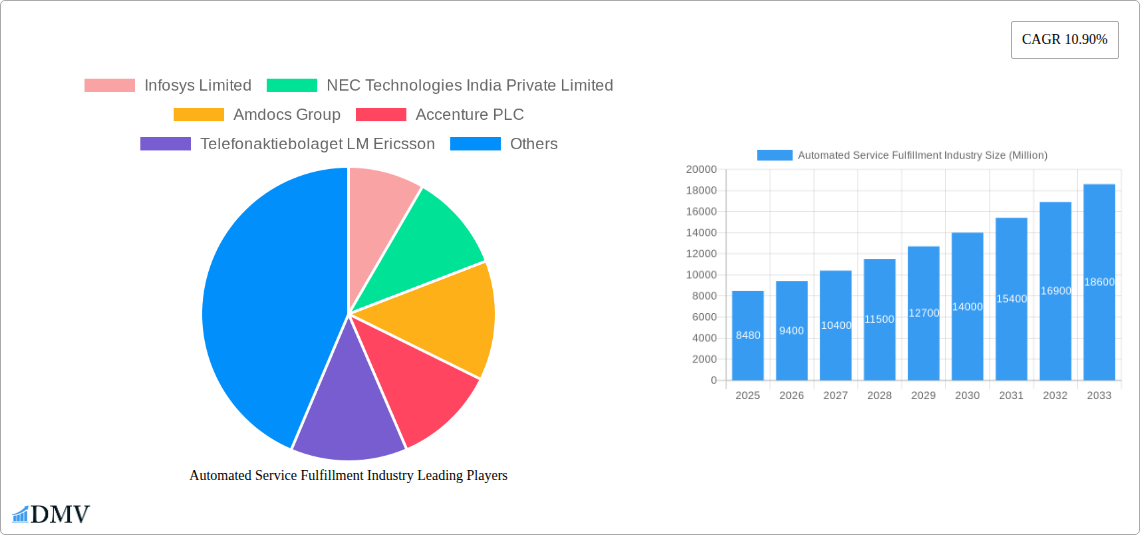
The Automated Service Fulfillment market is experiencing robust growth, projected to reach $8.48 billion in 2025 and maintain a Compound Annual Growth Rate (CAGR) of 10.90% from 2025 to 2033. This expansion is driven by several key factors. Increasing demand for faster and more efficient service delivery across various sectors, including telecommunications, IT, and finance, is a primary catalyst. Businesses are increasingly adopting digital transformation strategies, necessitating automated solutions to manage and fulfill service requests effectively. The shift towards cloud-based deployments further fuels market growth, offering scalability, flexibility, and cost-effectiveness compared to on-premise solutions. Furthermore, the integration of Artificial Intelligence (AI) and Machine Learning (ML) in service fulfillment platforms is enhancing automation capabilities, improving accuracy, and reducing human intervention. The competitive landscape is characterized by a mix of established technology giants and specialized service providers, fostering innovation and driving down costs.
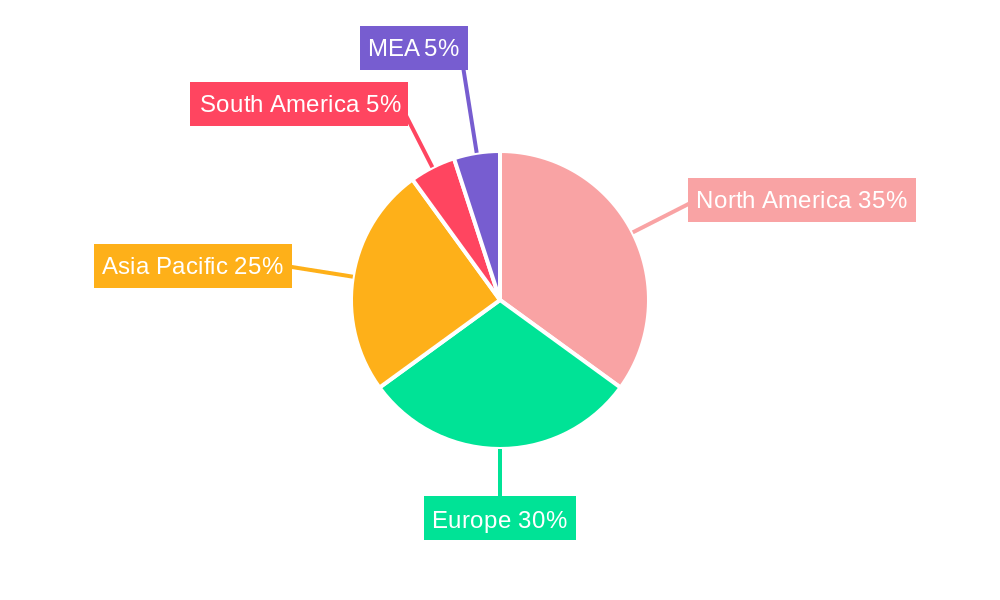
Segmentation analysis reveals significant opportunities within the market. The Software segment is anticipated to hold a larger market share compared to Services, owing to the increasing adoption of software-defined solutions and their ability to integrate seamlessly with existing IT infrastructure. Similarly, the Hosted deployment model is projected to experience faster growth than On-Premise, driven by the advantages of cloud computing. Geographically, North America and Europe currently dominate the market, but the Asia-Pacific region is expected to witness significant growth due to rising digital adoption and expanding telecom infrastructure. However, challenges remain, including the need for robust cybersecurity measures to protect sensitive customer data and the complexity of integrating automated systems with legacy infrastructure. Addressing these concerns will be crucial for sustained market expansion.
This insightful report provides a deep dive into the Automated Service Fulfillment Industry, offering a comprehensive analysis of market trends, key players, and future growth prospects. With a study period spanning 2019-2033, a base year of 2025, and a forecast period of 2025-2033, this report is an essential resource for stakeholders seeking to understand and capitalize on opportunities within this dynamic sector. The market is estimated to be worth xx Million in 2025.
Automated Service Fulfillment Industry Market Composition & Trends
This section evaluates the competitive landscape, innovation drivers, regulatory environment, and market dynamics of the Automated Service Fulfillment industry. We analyze market concentration, examining the market share distribution amongst key players like Infosys Limited, Accenture PLC, and Amdocs Group. The report also quantifies the impact of mergers and acquisitions (M&A) activities, analyzing deal values in the xx Million range over the historical period (2019-2024). The influence of substitute products and evolving end-user profiles are also explored.
- Market Concentration: Analysis of market share held by top 5 players. Infosys Limited holds an estimated xx% market share in 2025.
- Innovation Catalysts: Examination of technological advancements driving market growth, including AI, machine learning, and robotics.
- Regulatory Landscape: Assessment of relevant regulations and their impact on market expansion.
- M&A Activity: Detailed analysis of significant M&A deals with deal values and their strategic implications. (Example: A potential acquisition of a smaller player by Amdocs Group valued at xx Million in 2024).
- Substitute Products: Evaluation of alternative solutions and their competitive impact.
- End-User Profiles: Detailed segmentation of end-users across various industries and their specific needs.
Automated Service Fulfillment Industry Industry Evolution
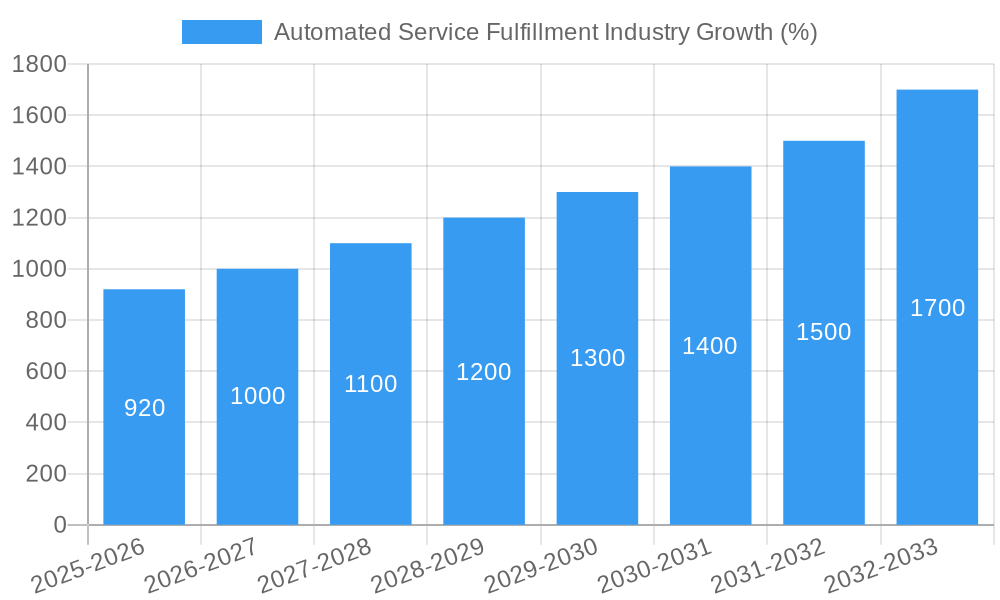
This section details the historical and projected growth trajectories of the Automated Service Fulfillment market. We analyze technological advancements shaping the industry, such as the rise of cloud-based solutions and AI-powered automation, and their impact on market growth rates. The influence of shifting consumer demands for faster, more efficient service fulfillment is also examined. Data points include year-on-year growth rates from 2019 to 2024 and projected compound annual growth rates (CAGR) for 2025-2033. Specific examples of technological adoption metrics are included, such as the percentage of businesses utilizing cloud-based automated service fulfillment solutions. For example, the adoption rate of cloud-based solutions is projected to increase from xx% in 2024 to xx% by 2033.
Leading Regions, Countries, or Segments in Automated Service Fulfillment Industry
This section identifies the dominant regions, countries, and segments within the Automated Service Fulfillment market. We analyze the market performance of different segments (Software, Service Order Management Services, On-Premise, Hosted) and pinpoint the leading player in each. The analysis will delve into the key drivers underpinning the dominance of each segment, region, or country, including investment trends, regulatory support, and market size.
- By Type: Analysis of market share and growth drivers for Software vs. Service Order Management Services. Software is projected to hold a xx% market share in 2025.
- By Deployment Mode: In-depth comparison of On-Premise vs. Hosted solutions, highlighting the growth trends and market drivers for each. Hosted solutions are projected to experience a faster CAGR during the forecast period.
- Key Drivers:
- Government initiatives promoting automation in specific sectors.
- Increased investments in R&D for advanced automation technologies.
- Growing demand for improved supply chain efficiency.
Automated Service Fulfillment Industry Product Innovations
This section showcases recent product innovations, applications, and performance metrics within the Automated Service Fulfillment industry. We highlight unique selling propositions (USPs) and technological advancements driving competitive advantage. Examples include the integration of AI and machine learning to enhance automation capabilities, the development of more user-friendly interfaces, and improvements in speed and efficiency.
Propelling Factors for Automated Service Fulfillment Industry Growth
This section identifies the key factors driving growth in the Automated Service Fulfillment industry. These include technological advancements (e.g., AI, cloud computing), economic factors (e.g., rising e-commerce sales), and supportive regulatory environments (e.g., government incentives for automation).
Obstacles in the Automated Service Fulfillment Industry Market
This section addresses the challenges and restraints facing the Automated Service Fulfillment market. These include regulatory hurdles (e.g., data privacy concerns), supply chain disruptions, and intense competition. The quantifiable impact of these factors on market growth is also assessed. For example, supply chain disruptions in 2022 are estimated to have decreased market growth by xx%.
Future Opportunities in Automated Service Fulfillment Industry
This section explores emerging opportunities in the Automated Service Fulfillment market, focusing on new technologies (e.g., blockchain for supply chain transparency), untapped markets (e.g., developing economies), and evolving consumer preferences (e.g., demand for personalized service).
Major Players in the Automated Service Fulfillment Industry Ecosystem
- Infosys Limited
- NEC Technologies India Private Limited
- Amdocs Group
- Accenture PLC
- Telefonaktiebolaget LM Ericsson
- Cisco Systems Inc
- TATA Communications Ltd
- Hewlett Packard Enterprise Development LP
- TIBCO Software Inc
- Suntech S A
- Comarch SA
Key Developments in Automated Service Fulfillment Industry Industry
- September 2023: Amazon India launched multi-channel fulfillment (MCF), significantly impacting the market by providing sellers with access to Amazon's vast logistics network.
- February 2023: AutoStore's pay-per-pick service made its industry-leading automation technology more accessible to smaller retailers, potentially accelerating market adoption.
Strategic Automated Service Fulfillment Industry Market Forecast
This section summarizes the key growth catalysts identified in the report and provides a concise overview of the future market potential. The Automated Service Fulfillment market is poised for significant growth driven by technological innovations, increasing demand for efficient service delivery, and supportive government policies. The market is expected to reach xx Million by 2033, demonstrating a strong CAGR.
Automated Service Fulfillment Industry Segmentation
-
1. Type
-
1.1. Software
- 1.1.1. Network Management
- 1.1.2. Inventory Management
- 1.1.3. Service Order Management
- 1.2. Services
-
1.1. Software
-
2. Deployment Mode
- 2.1. On-Premise
- 2.2. Hosted
Automated Service Fulfillment Industry Segmentation By Geography
- 1. North America
- 2. Europe
- 3. Asia Pacific
- 4. Rest of the World
Automated Service Fulfillment Industry REPORT HIGHLIGHTS
| Aspects | Details |
|---|---|
| Study Period | 2019-2033 |
| Base Year | 2024 |
| Estimated Year | 2025 |
| Forecast Period | 2025-2033 |
| Historical Period | 2019-2024 |
| Growth Rate | CAGR of 10.90% from 2019-2033 |
| Segmentation |
|
Table of Contents
- 1. Introduction
- 1.1. Research Scope
- 1.2. Market Segmentation
- 1.3. Research Methodology
- 1.4. Definitions and Assumptions
- 2. Executive Summary
- 2.1. Introduction
- 3. Market Dynamics
- 3.1. Introduction
- 3.2. Market Drivers
- 3.2.1 Increasing Network Automation and Increasing Demand for Automated
- 3.2.2 Real-time Services; Rapid Adoption of Virtualized Network Functions into Usable Components for Customer Service Creation
- 3.3. Market Restrains
- 3.3.1. Lack in Awareness
- 3.4. Market Trends
- 3.4.1. Software Segment is Analyzed to Hold Significant Market Share
- 4. Market Factor Analysis
- 4.1. Porters Five Forces
- 4.2. Supply/Value Chain
- 4.3. PESTEL analysis
- 4.4. Market Entropy
- 4.5. Patent/Trademark Analysis
- 5. Global Automated Service Fulfillment Industry Analysis, Insights and Forecast, 2019-2031
- 5.1. Market Analysis, Insights and Forecast - by Type
- 5.1.1. Software
- 5.1.1.1. Network Management
- 5.1.1.2. Inventory Management
- 5.1.1.3. Service Order Management
- 5.1.2. Services
- 5.1.1. Software
- 5.2. Market Analysis, Insights and Forecast - by Deployment Mode
- 5.2.1. On-Premise
- 5.2.2. Hosted
- 5.3. Market Analysis, Insights and Forecast - by Region
- 5.3.1. North America
- 5.3.2. Europe
- 5.3.3. Asia Pacific
- 5.3.4. Rest of the World
- 5.1. Market Analysis, Insights and Forecast - by Type
- 6. North America Automated Service Fulfillment Industry Analysis, Insights and Forecast, 2019-2031
- 6.1. Market Analysis, Insights and Forecast - by Type
- 6.1.1. Software
- 6.1.1.1. Network Management
- 6.1.1.2. Inventory Management
- 6.1.1.3. Service Order Management
- 6.1.2. Services
- 6.1.1. Software
- 6.2. Market Analysis, Insights and Forecast - by Deployment Mode
- 6.2.1. On-Premise
- 6.2.2. Hosted
- 6.1. Market Analysis, Insights and Forecast - by Type
- 7. Europe Automated Service Fulfillment Industry Analysis, Insights and Forecast, 2019-2031
- 7.1. Market Analysis, Insights and Forecast - by Type
- 7.1.1. Software
- 7.1.1.1. Network Management
- 7.1.1.2. Inventory Management
- 7.1.1.3. Service Order Management
- 7.1.2. Services
- 7.1.1. Software
- 7.2. Market Analysis, Insights and Forecast - by Deployment Mode
- 7.2.1. On-Premise
- 7.2.2. Hosted
- 7.1. Market Analysis, Insights and Forecast - by Type
- 8. Asia Pacific Automated Service Fulfillment Industry Analysis, Insights and Forecast, 2019-2031
- 8.1. Market Analysis, Insights and Forecast - by Type
- 8.1.1. Software
- 8.1.1.1. Network Management
- 8.1.1.2. Inventory Management
- 8.1.1.3. Service Order Management
- 8.1.2. Services
- 8.1.1. Software
- 8.2. Market Analysis, Insights and Forecast - by Deployment Mode
- 8.2.1. On-Premise
- 8.2.2. Hosted
- 8.1. Market Analysis, Insights and Forecast - by Type
- 9. Rest of the World Automated Service Fulfillment Industry Analysis, Insights and Forecast, 2019-2031
- 9.1. Market Analysis, Insights and Forecast - by Type
- 9.1.1. Software
- 9.1.1.1. Network Management
- 9.1.1.2. Inventory Management
- 9.1.1.3. Service Order Management
- 9.1.2. Services
- 9.1.1. Software
- 9.2. Market Analysis, Insights and Forecast - by Deployment Mode
- 9.2.1. On-Premise
- 9.2.2. Hosted
- 9.1. Market Analysis, Insights and Forecast - by Type
- 10. North America Automated Service Fulfillment Industry Analysis, Insights and Forecast, 2019-2031
- 10.1. Market Analysis, Insights and Forecast - By Country/Sub-region
- 10.1.1 United States
- 10.1.2 Canada
- 10.1.3 Mexico
- 11. Europe Automated Service Fulfillment Industry Analysis, Insights and Forecast, 2019-2031
- 11.1. Market Analysis, Insights and Forecast - By Country/Sub-region
- 11.1.1 Germany
- 11.1.2 United Kingdom
- 11.1.3 France
- 11.1.4 Spain
- 11.1.5 Italy
- 11.1.6 Spain
- 11.1.7 Belgium
- 11.1.8 Netherland
- 11.1.9 Nordics
- 11.1.10 Rest of Europe
- 12. Asia Pacific Automated Service Fulfillment Industry Analysis, Insights and Forecast, 2019-2031
- 12.1. Market Analysis, Insights and Forecast - By Country/Sub-region
- 12.1.1 China
- 12.1.2 Japan
- 12.1.3 India
- 12.1.4 South Korea
- 12.1.5 Southeast Asia
- 12.1.6 Australia
- 12.1.7 Indonesia
- 12.1.8 Phillipes
- 12.1.9 Singapore
- 12.1.10 Thailandc
- 12.1.11 Rest of Asia Pacific
- 13. South America Automated Service Fulfillment Industry Analysis, Insights and Forecast, 2019-2031
- 13.1. Market Analysis, Insights and Forecast - By Country/Sub-region
- 13.1.1 Brazil
- 13.1.2 Argentina
- 13.1.3 Peru
- 13.1.4 Chile
- 13.1.5 Colombia
- 13.1.6 Ecuador
- 13.1.7 Venezuela
- 13.1.8 Rest of South America
- 14. North America Automated Service Fulfillment Industry Analysis, Insights and Forecast, 2019-2031
- 14.1. Market Analysis, Insights and Forecast - By Country/Sub-region
- 14.1.1 United States
- 14.1.2 Canada
- 14.1.3 Mexico
- 15. MEA Automated Service Fulfillment Industry Analysis, Insights and Forecast, 2019-2031
- 15.1. Market Analysis, Insights and Forecast - By Country/Sub-region
- 15.1.1 United Arab Emirates
- 15.1.2 Saudi Arabia
- 15.1.3 South Africa
- 15.1.4 Rest of Middle East and Africa
- 16. Competitive Analysis
- 16.1. Global Market Share Analysis 2024
- 16.2. Company Profiles
- 16.2.1 Infosys Limited
- 16.2.1.1. Overview
- 16.2.1.2. Products
- 16.2.1.3. SWOT Analysis
- 16.2.1.4. Recent Developments
- 16.2.1.5. Financials (Based on Availability)
- 16.2.2 NEC Technologies India Private Limited
- 16.2.2.1. Overview
- 16.2.2.2. Products
- 16.2.2.3. SWOT Analysis
- 16.2.2.4. Recent Developments
- 16.2.2.5. Financials (Based on Availability)
- 16.2.3 Amdocs Group
- 16.2.3.1. Overview
- 16.2.3.2. Products
- 16.2.3.3. SWOT Analysis
- 16.2.3.4. Recent Developments
- 16.2.3.5. Financials (Based on Availability)
- 16.2.4 Accenture PLC
- 16.2.4.1. Overview
- 16.2.4.2. Products
- 16.2.4.3. SWOT Analysis
- 16.2.4.4. Recent Developments
- 16.2.4.5. Financials (Based on Availability)
- 16.2.5 Telefonaktiebolaget LM Ericsson
- 16.2.5.1. Overview
- 16.2.5.2. Products
- 16.2.5.3. SWOT Analysis
- 16.2.5.4. Recent Developments
- 16.2.5.5. Financials (Based on Availability)
- 16.2.6 Cisco Systems Inc
- 16.2.6.1. Overview
- 16.2.6.2. Products
- 16.2.6.3. SWOT Analysis
- 16.2.6.4. Recent Developments
- 16.2.6.5. Financials (Based on Availability)
- 16.2.7 TATA Communications Ltd
- 16.2.7.1. Overview
- 16.2.7.2. Products
- 16.2.7.3. SWOT Analysis
- 16.2.7.4. Recent Developments
- 16.2.7.5. Financials (Based on Availability)
- 16.2.8 Hewlett Packard Enterprise Development LP
- 16.2.8.1. Overview
- 16.2.8.2. Products
- 16.2.8.3. SWOT Analysis
- 16.2.8.4. Recent Developments
- 16.2.8.5. Financials (Based on Availability)
- 16.2.9 TIBCO Software Inc
- 16.2.9.1. Overview
- 16.2.9.2. Products
- 16.2.9.3. SWOT Analysis
- 16.2.9.4. Recent Developments
- 16.2.9.5. Financials (Based on Availability)
- 16.2.10 Suntech S A
- 16.2.10.1. Overview
- 16.2.10.2. Products
- 16.2.10.3. SWOT Analysis
- 16.2.10.4. Recent Developments
- 16.2.10.5. Financials (Based on Availability)
- 16.2.11 Comarch SA
- 16.2.11.1. Overview
- 16.2.11.2. Products
- 16.2.11.3. SWOT Analysis
- 16.2.11.4. Recent Developments
- 16.2.11.5. Financials (Based on Availability)
- 16.2.1 Infosys Limited
List of Figures
- Figure 1: Global Automated Service Fulfillment Industry Revenue Breakdown (Million, %) by Region 2024 & 2032
- Figure 2: North America Automated Service Fulfillment Industry Revenue (Million), by Country 2024 & 2032
- Figure 3: North America Automated Service Fulfillment Industry Revenue Share (%), by Country 2024 & 2032
- Figure 4: Europe Automated Service Fulfillment Industry Revenue (Million), by Country 2024 & 2032
- Figure 5: Europe Automated Service Fulfillment Industry Revenue Share (%), by Country 2024 & 2032
- Figure 6: Asia Pacific Automated Service Fulfillment Industry Revenue (Million), by Country 2024 & 2032
- Figure 7: Asia Pacific Automated Service Fulfillment Industry Revenue Share (%), by Country 2024 & 2032
- Figure 8: South America Automated Service Fulfillment Industry Revenue (Million), by Country 2024 & 2032
- Figure 9: South America Automated Service Fulfillment Industry Revenue Share (%), by Country 2024 & 2032
- Figure 10: North America Automated Service Fulfillment Industry Revenue (Million), by Country 2024 & 2032
- Figure 11: North America Automated Service Fulfillment Industry Revenue Share (%), by Country 2024 & 2032
- Figure 12: MEA Automated Service Fulfillment Industry Revenue (Million), by Country 2024 & 2032
- Figure 13: MEA Automated Service Fulfillment Industry Revenue Share (%), by Country 2024 & 2032
- Figure 14: North America Automated Service Fulfillment Industry Revenue (Million), by Type 2024 & 2032
- Figure 15: North America Automated Service Fulfillment Industry Revenue Share (%), by Type 2024 & 2032
- Figure 16: North America Automated Service Fulfillment Industry Revenue (Million), by Deployment Mode 2024 & 2032
- Figure 17: North America Automated Service Fulfillment Industry Revenue Share (%), by Deployment Mode 2024 & 2032
- Figure 18: North America Automated Service Fulfillment Industry Revenue (Million), by Country 2024 & 2032
- Figure 19: North America Automated Service Fulfillment Industry Revenue Share (%), by Country 2024 & 2032
- Figure 20: Europe Automated Service Fulfillment Industry Revenue (Million), by Type 2024 & 2032
- Figure 21: Europe Automated Service Fulfillment Industry Revenue Share (%), by Type 2024 & 2032
- Figure 22: Europe Automated Service Fulfillment Industry Revenue (Million), by Deployment Mode 2024 & 2032
- Figure 23: Europe Automated Service Fulfillment Industry Revenue Share (%), by Deployment Mode 2024 & 2032
- Figure 24: Europe Automated Service Fulfillment Industry Revenue (Million), by Country 2024 & 2032
- Figure 25: Europe Automated Service Fulfillment Industry Revenue Share (%), by Country 2024 & 2032
- Figure 26: Asia Pacific Automated Service Fulfillment Industry Revenue (Million), by Type 2024 & 2032
- Figure 27: Asia Pacific Automated Service Fulfillment Industry Revenue Share (%), by Type 2024 & 2032
- Figure 28: Asia Pacific Automated Service Fulfillment Industry Revenue (Million), by Deployment Mode 2024 & 2032
- Figure 29: Asia Pacific Automated Service Fulfillment Industry Revenue Share (%), by Deployment Mode 2024 & 2032
- Figure 30: Asia Pacific Automated Service Fulfillment Industry Revenue (Million), by Country 2024 & 2032
- Figure 31: Asia Pacific Automated Service Fulfillment Industry Revenue Share (%), by Country 2024 & 2032
- Figure 32: Rest of the World Automated Service Fulfillment Industry Revenue (Million), by Type 2024 & 2032
- Figure 33: Rest of the World Automated Service Fulfillment Industry Revenue Share (%), by Type 2024 & 2032
- Figure 34: Rest of the World Automated Service Fulfillment Industry Revenue (Million), by Deployment Mode 2024 & 2032
- Figure 35: Rest of the World Automated Service Fulfillment Industry Revenue Share (%), by Deployment Mode 2024 & 2032
- Figure 36: Rest of the World Automated Service Fulfillment Industry Revenue (Million), by Country 2024 & 2032
- Figure 37: Rest of the World Automated Service Fulfillment Industry Revenue Share (%), by Country 2024 & 2032
List of Tables
- Table 1: Global Automated Service Fulfillment Industry Revenue Million Forecast, by Region 2019 & 2032
- Table 2: Global Automated Service Fulfillment Industry Revenue Million Forecast, by Type 2019 & 2032
- Table 3: Global Automated Service Fulfillment Industry Revenue Million Forecast, by Deployment Mode 2019 & 2032
- Table 4: Global Automated Service Fulfillment Industry Revenue Million Forecast, by Region 2019 & 2032
- Table 5: Global Automated Service Fulfillment Industry Revenue Million Forecast, by Country 2019 & 2032
- Table 6: United States Automated Service Fulfillment Industry Revenue (Million) Forecast, by Application 2019 & 2032
- Table 7: Canada Automated Service Fulfillment Industry Revenue (Million) Forecast, by Application 2019 & 2032
- Table 8: Mexico Automated Service Fulfillment Industry Revenue (Million) Forecast, by Application 2019 & 2032
- Table 9: Global Automated Service Fulfillment Industry Revenue Million Forecast, by Country 2019 & 2032
- Table 10: Germany Automated Service Fulfillment Industry Revenue (Million) Forecast, by Application 2019 & 2032
- Table 11: United Kingdom Automated Service Fulfillment Industry Revenue (Million) Forecast, by Application 2019 & 2032
- Table 12: France Automated Service Fulfillment Industry Revenue (Million) Forecast, by Application 2019 & 2032
- Table 13: Spain Automated Service Fulfillment Industry Revenue (Million) Forecast, by Application 2019 & 2032
- Table 14: Italy Automated Service Fulfillment Industry Revenue (Million) Forecast, by Application 2019 & 2032
- Table 15: Spain Automated Service Fulfillment Industry Revenue (Million) Forecast, by Application 2019 & 2032
- Table 16: Belgium Automated Service Fulfillment Industry Revenue (Million) Forecast, by Application 2019 & 2032
- Table 17: Netherland Automated Service Fulfillment Industry Revenue (Million) Forecast, by Application 2019 & 2032
- Table 18: Nordics Automated Service Fulfillment Industry Revenue (Million) Forecast, by Application 2019 & 2032
- Table 19: Rest of Europe Automated Service Fulfillment Industry Revenue (Million) Forecast, by Application 2019 & 2032
- Table 20: Global Automated Service Fulfillment Industry Revenue Million Forecast, by Country 2019 & 2032
- Table 21: China Automated Service Fulfillment Industry Revenue (Million) Forecast, by Application 2019 & 2032
- Table 22: Japan Automated Service Fulfillment Industry Revenue (Million) Forecast, by Application 2019 & 2032
- Table 23: India Automated Service Fulfillment Industry Revenue (Million) Forecast, by Application 2019 & 2032
- Table 24: South Korea Automated Service Fulfillment Industry Revenue (Million) Forecast, by Application 2019 & 2032
- Table 25: Southeast Asia Automated Service Fulfillment Industry Revenue (Million) Forecast, by Application 2019 & 2032
- Table 26: Australia Automated Service Fulfillment Industry Revenue (Million) Forecast, by Application 2019 & 2032
- Table 27: Indonesia Automated Service Fulfillment Industry Revenue (Million) Forecast, by Application 2019 & 2032
- Table 28: Phillipes Automated Service Fulfillment Industry Revenue (Million) Forecast, by Application 2019 & 2032
- Table 29: Singapore Automated Service Fulfillment Industry Revenue (Million) Forecast, by Application 2019 & 2032
- Table 30: Thailandc Automated Service Fulfillment Industry Revenue (Million) Forecast, by Application 2019 & 2032
- Table 31: Rest of Asia Pacific Automated Service Fulfillment Industry Revenue (Million) Forecast, by Application 2019 & 2032
- Table 32: Global Automated Service Fulfillment Industry Revenue Million Forecast, by Country 2019 & 2032
- Table 33: Brazil Automated Service Fulfillment Industry Revenue (Million) Forecast, by Application 2019 & 2032
- Table 34: Argentina Automated Service Fulfillment Industry Revenue (Million) Forecast, by Application 2019 & 2032
- Table 35: Peru Automated Service Fulfillment Industry Revenue (Million) Forecast, by Application 2019 & 2032
- Table 36: Chile Automated Service Fulfillment Industry Revenue (Million) Forecast, by Application 2019 & 2032
- Table 37: Colombia Automated Service Fulfillment Industry Revenue (Million) Forecast, by Application 2019 & 2032
- Table 38: Ecuador Automated Service Fulfillment Industry Revenue (Million) Forecast, by Application 2019 & 2032
- Table 39: Venezuela Automated Service Fulfillment Industry Revenue (Million) Forecast, by Application 2019 & 2032
- Table 40: Rest of South America Automated Service Fulfillment Industry Revenue (Million) Forecast, by Application 2019 & 2032
- Table 41: Global Automated Service Fulfillment Industry Revenue Million Forecast, by Country 2019 & 2032
- Table 42: United States Automated Service Fulfillment Industry Revenue (Million) Forecast, by Application 2019 & 2032
- Table 43: Canada Automated Service Fulfillment Industry Revenue (Million) Forecast, by Application 2019 & 2032
- Table 44: Mexico Automated Service Fulfillment Industry Revenue (Million) Forecast, by Application 2019 & 2032
- Table 45: Global Automated Service Fulfillment Industry Revenue Million Forecast, by Country 2019 & 2032
- Table 46: United Arab Emirates Automated Service Fulfillment Industry Revenue (Million) Forecast, by Application 2019 & 2032
- Table 47: Saudi Arabia Automated Service Fulfillment Industry Revenue (Million) Forecast, by Application 2019 & 2032
- Table 48: South Africa Automated Service Fulfillment Industry Revenue (Million) Forecast, by Application 2019 & 2032
- Table 49: Rest of Middle East and Africa Automated Service Fulfillment Industry Revenue (Million) Forecast, by Application 2019 & 2032
- Table 50: Global Automated Service Fulfillment Industry Revenue Million Forecast, by Type 2019 & 2032
- Table 51: Global Automated Service Fulfillment Industry Revenue Million Forecast, by Deployment Mode 2019 & 2032
- Table 52: Global Automated Service Fulfillment Industry Revenue Million Forecast, by Country 2019 & 2032
- Table 53: Global Automated Service Fulfillment Industry Revenue Million Forecast, by Type 2019 & 2032
- Table 54: Global Automated Service Fulfillment Industry Revenue Million Forecast, by Deployment Mode 2019 & 2032
- Table 55: Global Automated Service Fulfillment Industry Revenue Million Forecast, by Country 2019 & 2032
- Table 56: Global Automated Service Fulfillment Industry Revenue Million Forecast, by Type 2019 & 2032
- Table 57: Global Automated Service Fulfillment Industry Revenue Million Forecast, by Deployment Mode 2019 & 2032
- Table 58: Global Automated Service Fulfillment Industry Revenue Million Forecast, by Country 2019 & 2032
- Table 59: Global Automated Service Fulfillment Industry Revenue Million Forecast, by Type 2019 & 2032
- Table 60: Global Automated Service Fulfillment Industry Revenue Million Forecast, by Deployment Mode 2019 & 2032
- Table 61: Global Automated Service Fulfillment Industry Revenue Million Forecast, by Country 2019 & 2032
Frequently Asked Questions
1. What is the projected Compound Annual Growth Rate (CAGR) of the Automated Service Fulfillment Industry?
The projected CAGR is approximately 10.90%.
2. Which companies are prominent players in the Automated Service Fulfillment Industry?
Key companies in the market include Infosys Limited, NEC Technologies India Private Limited, Amdocs Group, Accenture PLC, Telefonaktiebolaget LM Ericsson, Cisco Systems Inc, TATA Communications Ltd, Hewlett Packard Enterprise Development LP, TIBCO Software Inc , Suntech S A, Comarch SA.
3. What are the main segments of the Automated Service Fulfillment Industry?
The market segments include Type, Deployment Mode.
4. Can you provide details about the market size?
The market size is estimated to be USD 8.48 Million as of 2022.
5. What are some drivers contributing to market growth?
Increasing Network Automation and Increasing Demand for Automated. Real-time Services; Rapid Adoption of Virtualized Network Functions into Usable Components for Customer Service Creation.
6. What are the notable trends driving market growth?
Software Segment is Analyzed to Hold Significant Market Share.
7. Are there any restraints impacting market growth?
Lack in Awareness.
8. Can you provide examples of recent developments in the market?
September 2023 - Amazon India launched multi-channel fulfillment (MCF) for sellers, including retailers and D2C brands, to help them handle customer orders from various channels. The MCF will allow sellers to utilize Amazon’s pan-India presence, fulfillment centers, and logistics network to take orders received on various channels, including their own websites.
9. What pricing options are available for accessing the report?
Pricing options include single-user, multi-user, and enterprise licenses priced at USD 4750, USD 5250, and USD 8750 respectively.
10. Is the market size provided in terms of value or volume?
The market size is provided in terms of value, measured in Million.
11. Are there any specific market keywords associated with the report?
Yes, the market keyword associated with the report is "Automated Service Fulfillment Industry," which aids in identifying and referencing the specific market segment covered.
12. How do I determine which pricing option suits my needs best?
The pricing options vary based on user requirements and access needs. Individual users may opt for single-user licenses, while businesses requiring broader access may choose multi-user or enterprise licenses for cost-effective access to the report.
13. Are there any additional resources or data provided in the Automated Service Fulfillment Industry report?
While the report offers comprehensive insights, it's advisable to review the specific contents or supplementary materials provided to ascertain if additional resources or data are available.
14. How can I stay updated on further developments or reports in the Automated Service Fulfillment Industry?
To stay informed about further developments, trends, and reports in the Automated Service Fulfillment Industry, consider subscribing to industry newsletters, following relevant companies and organizations, or regularly checking reputable industry news sources and publications.
Methodology
Step 1 - Identification of Relevant Samples Size from Population Database


Step 2 - Approaches for Defining Global Market Size (Value, Volume* & Price*)

Note*: In applicable scenarios
Step 3 - Data Sources
Primary Research
- Web Analytics
- Survey Reports
- Research Institute
- Latest Research Reports
- Opinion Leaders
Secondary Research
- Annual Reports
- White Paper
- Latest Press Release
- Industry Association
- Paid Database
- Investor Presentations

Step 4 - Data Triangulation
Involves using different sources of information in order to increase the validity of a study
These sources are likely to be stakeholders in a program - participants, other researchers, program staff, other community members, and so on.
Then we put all data in single framework & apply various statistical tools to find out the dynamic on the market.
During the analysis stage, feedback from the stakeholder groups would be compared to determine areas of agreement as well as areas of divergence
