

Key Insights
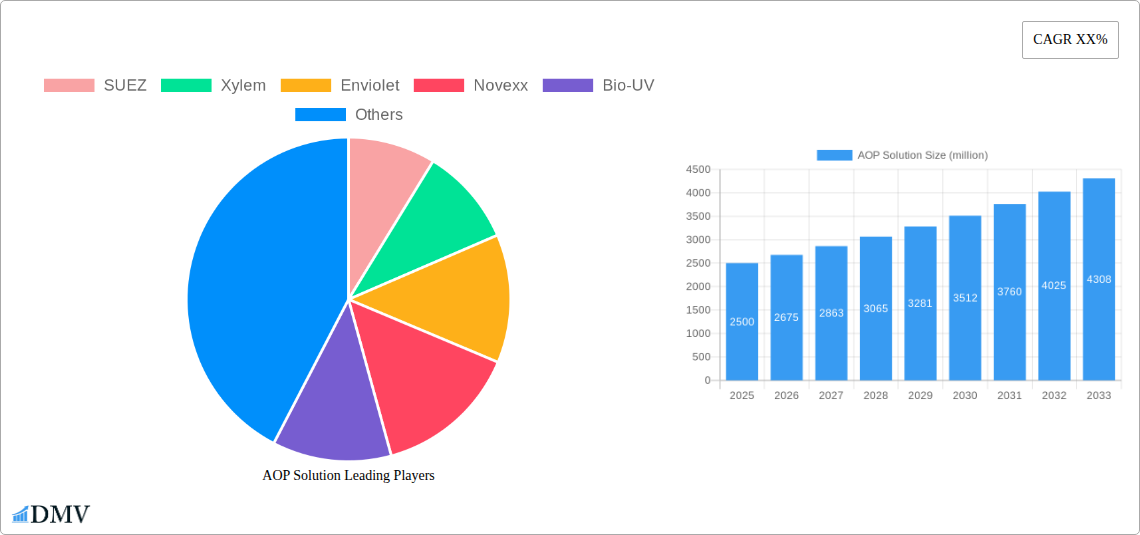
The advanced oxidation process (AOP) solution market is experiencing robust growth, driven by increasing concerns about water contamination and stringent regulatory frameworks mandating cleaner water sources. The market, estimated at $2.5 billion in 2025, is projected to exhibit a Compound Annual Growth Rate (CAGR) of 7% from 2025 to 2033, reaching approximately $4.2 billion by 2033. This expansion is fueled by the rising adoption of AOP technologies across diverse sectors, including municipal wastewater treatment, industrial effluent treatment, and drinking water purification. Technological advancements leading to more efficient and cost-effective AOP systems are further boosting market growth. The increasing prevalence of emerging contaminants, such as pharmaceuticals and microplastics, which are resistant to conventional treatment methods, is creating significant demand for AOP solutions. Furthermore, the growing emphasis on sustainable water management practices globally contributes to the market's expansion.
Major market segments include UV-based AOP, ozone-based AOP, and hybrid AOP systems. While UV-based AOP currently holds the largest market share, owing to its established technology and relative cost-effectiveness, the demand for hybrid systems, combining multiple AOP techniques for enhanced treatment efficiency, is steadily increasing. Geographical analysis reveals strong market growth in North America and Europe, driven by robust regulatory frameworks and high technological adoption rates. However, developing economies in Asia-Pacific are witnessing rapid market expansion fueled by increasing industrialization and urbanization. Key players like SUEZ, Xylem, and Enviolet are driving innovation and market competition through strategic partnerships, mergers & acquisitions, and the development of advanced AOP solutions. While challenges remain in terms of high initial investment costs and operational complexities, the long-term benefits of superior water quality and environmental sustainability are driving sustained market growth.
Advanced Oxidation Processes (AOP) Solution Market Report: 2019-2033
This comprehensive report provides an in-depth analysis of the global Advanced Oxidation Processes (AOP) Solution market, projecting a market value exceeding $XX million by 2033. The study period spans 2019-2033, with 2025 serving as both the base and estimated year. The report offers invaluable insights for stakeholders, investors, and industry professionals seeking to navigate this rapidly evolving market. We analyze key players like SUEZ, Xylem, Enviolet, and others, uncovering growth drivers, challenges, and future opportunities across various segments.
AOP Solution Market Composition & Trends
The global AOP solution market, valued at $XX million in 2025, exhibits a moderately concentrated landscape. Key players such as SUEZ and Xylem hold significant market share, though numerous smaller companies contribute to the overall market dynamics. Innovation is driven by the increasing need for effective water purification, stringent environmental regulations, and the pursuit of sustainable water management solutions. The regulatory landscape plays a crucial role, influencing both market growth and technological advancements. Substitute products, such as membrane filtration, pose competitive pressure, while mergers and acquisitions (M&A) reshape the market structure. Recent M&A activity has involved deals valued at over $XX million, primarily focused on expanding technological capabilities and market reach.
- Market Share Distribution (2025): SUEZ (XX%), Xylem (XX%), Enviolet (XX%), Others (XX%)
- M&A Deal Values (2019-2024): Total exceeding $XX million
- Key Innovation Catalysts: Stringent environmental regulations, growing demand for clean water, advancements in oxidation technologies.
- End-User Profiles: Municipal water treatment plants, industrial wastewater treatment facilities, commercial businesses.
AOP Solution Industry Evolution
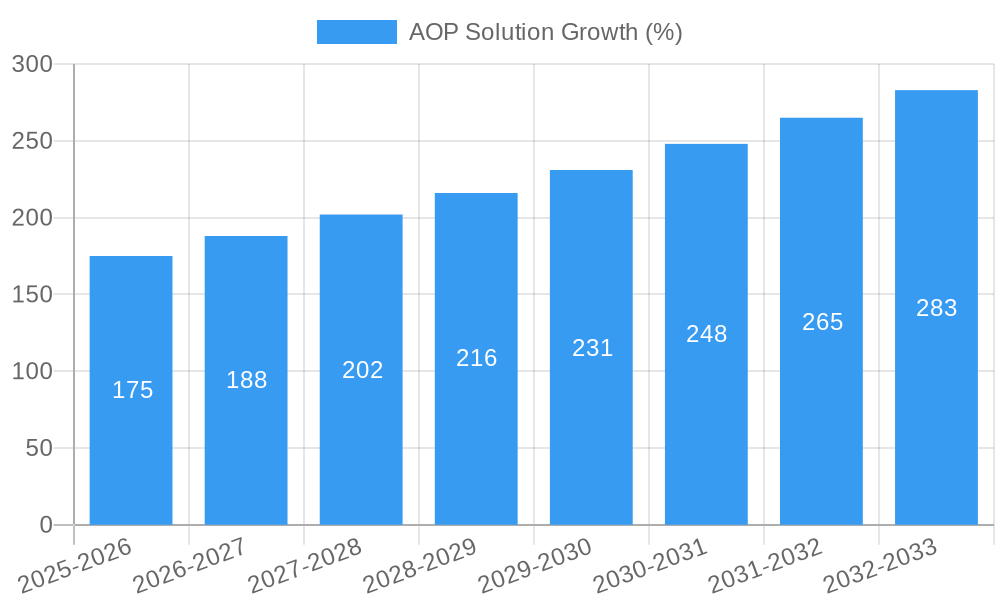
The AOP solution market demonstrates a robust growth trajectory, expanding at a CAGR of XX% during the forecast period (2025-2033). This growth is fueled by several factors, including technological advancements resulting in more efficient and cost-effective AOP systems, increasing awareness of water pollution and its health implications, and supportive government policies promoting sustainable water management practices. Adoption rates are significantly increasing, especially in regions facing severe water scarcity. Emerging economies are witnessing faster growth rates compared to mature markets, driven by rapid industrialization and urbanization. Consumer demands are shifting towards more sustainable and environmentally friendly water treatment solutions.
- Market Growth Rate (CAGR 2025-2033): XX%
- Adoption Rate Increase (2024-2025): XX%
Leading Regions, Countries, or Segments in AOP Solution
North America currently holds the dominant position in the AOP solution market, primarily driven by stringent environmental regulations and significant investments in water infrastructure. Europe follows closely, with robust regulatory frameworks and a strong focus on sustainable development. Asia-Pacific is expected to experience the highest growth rate during the forecast period due to rapid industrialization and increasing investments in water treatment facilities.
- Key Drivers for North America: Stringent EPA regulations, high investment in water infrastructure, technological advancements.
- Key Drivers for Europe: Stringent EU water directives, focus on sustainable development, technological innovation.
- Key Drivers for Asia-Pacific: Rapid industrialization, increasing urbanization, rising government investments in water treatment.
AOP Solution Product Innovations
Recent innovations in AOP technology focus on enhancing efficiency, reducing energy consumption, and expanding applications. This includes the development of hybrid AOP systems combining different oxidation processes for optimized performance, advanced process control systems for enhanced automation and efficiency, and portable AOP units for on-site treatment. These innovations significantly improve treatment efficiency, reduce operational costs, and enhance the overall sustainability of water treatment processes.
Propelling Factors for AOP Solution Growth
Several factors contribute to the growth of the AOP solution market. Stringent environmental regulations globally mandate advanced water treatment solutions, driving the demand for AOP technologies. Technological advancements, particularly in energy-efficient and cost-effective systems, are further accelerating market expansion. Furthermore, the growing awareness of water scarcity and the increasing need for safe and clean water resources significantly contribute to market growth. Government initiatives and investments in water infrastructure also play a significant role.
Obstacles in the AOP Solution Market
Despite the market's growth potential, several challenges exist. High capital investment costs for AOP systems can hinder adoption, especially in developing countries. Supply chain disruptions, particularly of specialized chemicals and components, can affect production and market availability. Intense competition among established players and emerging companies further adds pressure. Regulatory complexities and variations across different regions also pose obstacles to market expansion. These factors can result in a XX% reduction in market growth in specific regions.
Future Opportunities in AOP Solution
Future opportunities lie in the development of more sustainable and energy-efficient AOP systems, expansion into emerging markets with significant water treatment needs, and integration of AOP technologies with other water treatment processes. Exploring new applications of AOP in diverse sectors, such as pharmaceutical waste treatment and agricultural runoff management, presents significant growth potential. Furthermore, advancements in process control and automation will further enhance the efficiency and affordability of AOP systems.
Major Players in the AOP Solution Ecosystem
- SUEZ
- Xylem
- Enviolet
- Novexx
- Bio-UV
- Belmar Technologies
- HPNow
- EnviroChemie
- SKion Water
- Besino
- Winfuture
- Jiangsu Jiuwu High-tech
- Genesis Water Technologies
- Infinite Water
- Arvia Technology
- Spartan Environmental Technologies
Key Developments in AOP Solution Industry
- 2022 Q4: Xylem launches a new line of energy-efficient AOP systems.
- 2023 Q1: SUEZ acquires a smaller AOP technology company, expanding its market presence.
- 2023 Q3: Enviolet introduces a hybrid AOP system with improved performance metrics.
- (Further developments to be added based on available data)
Strategic AOP Solution Market Forecast
The AOP solution market is poised for significant growth over the next decade, driven by continuous technological advancements, increasing environmental regulations, and rising awareness of water quality issues. The expanding applications of AOP across various industries, coupled with supportive government policies, promise a strong market outlook. The market’s expansion into new geographical regions and the emergence of innovative hybrid systems will further contribute to its future growth and overall market value exceeding $XX million by 2033.
AOP Solution Segmentation
-
1. Application
- 1.1. Papermaking and Print
- 1.2. Clothes and Textile
- 1.3. Chemical Industrial
- 1.4. Municipal Sewage Treatment
-
2. Types
- 2.1. Photochemical
- 2.2. Catalytic Wet
- 2.3. Sonochemical
- 2.4. Ozone
- 2.5. Electrochemical
- 2.6. Fenton
AOP Solution Segmentation By Geography
-
1. North America
- 1.1. United States
- 1.2. Canada
- 1.3. Mexico
-
2. South America
- 2.1. Brazil
- 2.2. Argentina
- 2.3. Rest of South America
-
3. Europe
- 3.1. United Kingdom
- 3.2. Germany
- 3.3. France
- 3.4. Italy
- 3.5. Spain
- 3.6. Russia
- 3.7. Benelux
- 3.8. Nordics
- 3.9. Rest of Europe
-
4. Middle East & Africa
- 4.1. Turkey
- 4.2. Israel
- 4.3. GCC
- 4.4. North Africa
- 4.5. South Africa
- 4.6. Rest of Middle East & Africa
-
5. Asia Pacific
- 5.1. China
- 5.2. India
- 5.3. Japan
- 5.4. South Korea
- 5.5. ASEAN
- 5.6. Oceania
- 5.7. Rest of Asia Pacific

AOP Solution REPORT HIGHLIGHTS
| Aspects | Details |
|---|---|
| Study Period | 2019-2033 |
| Base Year | 2024 |
| Estimated Year | 2025 |
| Forecast Period | 2025-2033 |
| Historical Period | 2019-2024 |
| Growth Rate | CAGR of XX% from 2019-2033 |
| Segmentation |
|
Table of Contents
- 1. Introduction
- 1.1. Research Scope
- 1.2. Market Segmentation
- 1.3. Research Methodology
- 1.4. Definitions and Assumptions
- 2. Executive Summary
- 2.1. Introduction
- 3. Market Dynamics
- 3.1. Introduction
- 3.2. Market Drivers
- 3.3. Market Restrains
- 3.4. Market Trends
- 4. Market Factor Analysis
- 4.1. Porters Five Forces
- 4.2. Supply/Value Chain
- 4.3. PESTEL analysis
- 4.4. Market Entropy
- 4.5. Patent/Trademark Analysis
- 5. Global AOP Solution Analysis, Insights and Forecast, 2019-2031
- 5.1. Market Analysis, Insights and Forecast - by Application
- 5.1.1. Papermaking and Print
- 5.1.2. Clothes and Textile
- 5.1.3. Chemical Industrial
- 5.1.4. Municipal Sewage Treatment
- 5.2. Market Analysis, Insights and Forecast - by Types
- 5.2.1. Photochemical
- 5.2.2. Catalytic Wet
- 5.2.3. Sonochemical
- 5.2.4. Ozone
- 5.2.5. Electrochemical
- 5.2.6. Fenton
- 5.3. Market Analysis, Insights and Forecast - by Region
- 5.3.1. North America
- 5.3.2. South America
- 5.3.3. Europe
- 5.3.4. Middle East & Africa
- 5.3.5. Asia Pacific
- 5.1. Market Analysis, Insights and Forecast - by Application
- 6. North America AOP Solution Analysis, Insights and Forecast, 2019-2031
- 6.1. Market Analysis, Insights and Forecast - by Application
- 6.1.1. Papermaking and Print
- 6.1.2. Clothes and Textile
- 6.1.3. Chemical Industrial
- 6.1.4. Municipal Sewage Treatment
- 6.2. Market Analysis, Insights and Forecast - by Types
- 6.2.1. Photochemical
- 6.2.2. Catalytic Wet
- 6.2.3. Sonochemical
- 6.2.4. Ozone
- 6.2.5. Electrochemical
- 6.2.6. Fenton
- 6.1. Market Analysis, Insights and Forecast - by Application
- 7. South America AOP Solution Analysis, Insights and Forecast, 2019-2031
- 7.1. Market Analysis, Insights and Forecast - by Application
- 7.1.1. Papermaking and Print
- 7.1.2. Clothes and Textile
- 7.1.3. Chemical Industrial
- 7.1.4. Municipal Sewage Treatment
- 7.2. Market Analysis, Insights and Forecast - by Types
- 7.2.1. Photochemical
- 7.2.2. Catalytic Wet
- 7.2.3. Sonochemical
- 7.2.4. Ozone
- 7.2.5. Electrochemical
- 7.2.6. Fenton
- 7.1. Market Analysis, Insights and Forecast - by Application
- 8. Europe AOP Solution Analysis, Insights and Forecast, 2019-2031
- 8.1. Market Analysis, Insights and Forecast - by Application
- 8.1.1. Papermaking and Print
- 8.1.2. Clothes and Textile
- 8.1.3. Chemical Industrial
- 8.1.4. Municipal Sewage Treatment
- 8.2. Market Analysis, Insights and Forecast - by Types
- 8.2.1. Photochemical
- 8.2.2. Catalytic Wet
- 8.2.3. Sonochemical
- 8.2.4. Ozone
- 8.2.5. Electrochemical
- 8.2.6. Fenton
- 8.1. Market Analysis, Insights and Forecast - by Application
- 9. Middle East & Africa AOP Solution Analysis, Insights and Forecast, 2019-2031
- 9.1. Market Analysis, Insights and Forecast - by Application
- 9.1.1. Papermaking and Print
- 9.1.2. Clothes and Textile
- 9.1.3. Chemical Industrial
- 9.1.4. Municipal Sewage Treatment
- 9.2. Market Analysis, Insights and Forecast - by Types
- 9.2.1. Photochemical
- 9.2.2. Catalytic Wet
- 9.2.3. Sonochemical
- 9.2.4. Ozone
- 9.2.5. Electrochemical
- 9.2.6. Fenton
- 9.1. Market Analysis, Insights and Forecast - by Application
- 10. Asia Pacific AOP Solution Analysis, Insights and Forecast, 2019-2031
- 10.1. Market Analysis, Insights and Forecast - by Application
- 10.1.1. Papermaking and Print
- 10.1.2. Clothes and Textile
- 10.1.3. Chemical Industrial
- 10.1.4. Municipal Sewage Treatment
- 10.2. Market Analysis, Insights and Forecast - by Types
- 10.2.1. Photochemical
- 10.2.2. Catalytic Wet
- 10.2.3. Sonochemical
- 10.2.4. Ozone
- 10.2.5. Electrochemical
- 10.2.6. Fenton
- 10.1. Market Analysis, Insights and Forecast - by Application
- 11. Competitive Analysis
- 11.1. Global Market Share Analysis 2024
- 11.2. Company Profiles
- 11.2.1 SUEZ
- 11.2.1.1. Overview
- 11.2.1.2. Products
- 11.2.1.3. SWOT Analysis
- 11.2.1.4. Recent Developments
- 11.2.1.5. Financials (Based on Availability)
- 11.2.2 Xylem
- 11.2.2.1. Overview
- 11.2.2.2. Products
- 11.2.2.3. SWOT Analysis
- 11.2.2.4. Recent Developments
- 11.2.2.5. Financials (Based on Availability)
- 11.2.3 Enviolet
- 11.2.3.1. Overview
- 11.2.3.2. Products
- 11.2.3.3. SWOT Analysis
- 11.2.3.4. Recent Developments
- 11.2.3.5. Financials (Based on Availability)
- 11.2.4 Novexx
- 11.2.4.1. Overview
- 11.2.4.2. Products
- 11.2.4.3. SWOT Analysis
- 11.2.4.4. Recent Developments
- 11.2.4.5. Financials (Based on Availability)
- 11.2.5 Bio-UV
- 11.2.5.1. Overview
- 11.2.5.2. Products
- 11.2.5.3. SWOT Analysis
- 11.2.5.4. Recent Developments
- 11.2.5.5. Financials (Based on Availability)
- 11.2.6 Belmar Technologies
- 11.2.6.1. Overview
- 11.2.6.2. Products
- 11.2.6.3. SWOT Analysis
- 11.2.6.4. Recent Developments
- 11.2.6.5. Financials (Based on Availability)
- 11.2.7 HPNow
- 11.2.7.1. Overview
- 11.2.7.2. Products
- 11.2.7.3. SWOT Analysis
- 11.2.7.4. Recent Developments
- 11.2.7.5. Financials (Based on Availability)
- 11.2.8 EnviroChemie
- 11.2.8.1. Overview
- 11.2.8.2. Products
- 11.2.8.3. SWOT Analysis
- 11.2.8.4. Recent Developments
- 11.2.8.5. Financials (Based on Availability)
- 11.2.9 SKion Water
- 11.2.9.1. Overview
- 11.2.9.2. Products
- 11.2.9.3. SWOT Analysis
- 11.2.9.4. Recent Developments
- 11.2.9.5. Financials (Based on Availability)
- 11.2.10 Besino
- 11.2.10.1. Overview
- 11.2.10.2. Products
- 11.2.10.3. SWOT Analysis
- 11.2.10.4. Recent Developments
- 11.2.10.5. Financials (Based on Availability)
- 11.2.11 Winfuture
- 11.2.11.1. Overview
- 11.2.11.2. Products
- 11.2.11.3. SWOT Analysis
- 11.2.11.4. Recent Developments
- 11.2.11.5. Financials (Based on Availability)
- 11.2.12 Jiangsu Jiuwu High-tech
- 11.2.12.1. Overview
- 11.2.12.2. Products
- 11.2.12.3. SWOT Analysis
- 11.2.12.4. Recent Developments
- 11.2.12.5. Financials (Based on Availability)
- 11.2.13 Genesis Water Technologies
- 11.2.13.1. Overview
- 11.2.13.2. Products
- 11.2.13.3. SWOT Analysis
- 11.2.13.4. Recent Developments
- 11.2.13.5. Financials (Based on Availability)
- 11.2.14 Infinite Water
- 11.2.14.1. Overview
- 11.2.14.2. Products
- 11.2.14.3. SWOT Analysis
- 11.2.14.4. Recent Developments
- 11.2.14.5. Financials (Based on Availability)
- 11.2.15 Arvia Technology
- 11.2.15.1. Overview
- 11.2.15.2. Products
- 11.2.15.3. SWOT Analysis
- 11.2.15.4. Recent Developments
- 11.2.15.5. Financials (Based on Availability)
- 11.2.16 Spartan Environmental Technologies
- 11.2.16.1. Overview
- 11.2.16.2. Products
- 11.2.16.3. SWOT Analysis
- 11.2.16.4. Recent Developments
- 11.2.16.5. Financials (Based on Availability)
- 11.2.1 SUEZ
List of Figures
- Figure 1: Global AOP Solution Revenue Breakdown (million, %) by Region 2024 & 2032
- Figure 2: North America AOP Solution Revenue (million), by Application 2024 & 2032
- Figure 3: North America AOP Solution Revenue Share (%), by Application 2024 & 2032
- Figure 4: North America AOP Solution Revenue (million), by Types 2024 & 2032
- Figure 5: North America AOP Solution Revenue Share (%), by Types 2024 & 2032
- Figure 6: North America AOP Solution Revenue (million), by Country 2024 & 2032
- Figure 7: North America AOP Solution Revenue Share (%), by Country 2024 & 2032
- Figure 8: South America AOP Solution Revenue (million), by Application 2024 & 2032
- Figure 9: South America AOP Solution Revenue Share (%), by Application 2024 & 2032
- Figure 10: South America AOP Solution Revenue (million), by Types 2024 & 2032
- Figure 11: South America AOP Solution Revenue Share (%), by Types 2024 & 2032
- Figure 12: South America AOP Solution Revenue (million), by Country 2024 & 2032
- Figure 13: South America AOP Solution Revenue Share (%), by Country 2024 & 2032
- Figure 14: Europe AOP Solution Revenue (million), by Application 2024 & 2032
- Figure 15: Europe AOP Solution Revenue Share (%), by Application 2024 & 2032
- Figure 16: Europe AOP Solution Revenue (million), by Types 2024 & 2032
- Figure 17: Europe AOP Solution Revenue Share (%), by Types 2024 & 2032
- Figure 18: Europe AOP Solution Revenue (million), by Country 2024 & 2032
- Figure 19: Europe AOP Solution Revenue Share (%), by Country 2024 & 2032
- Figure 20: Middle East & Africa AOP Solution Revenue (million), by Application 2024 & 2032
- Figure 21: Middle East & Africa AOP Solution Revenue Share (%), by Application 2024 & 2032
- Figure 22: Middle East & Africa AOP Solution Revenue (million), by Types 2024 & 2032
- Figure 23: Middle East & Africa AOP Solution Revenue Share (%), by Types 2024 & 2032
- Figure 24: Middle East & Africa AOP Solution Revenue (million), by Country 2024 & 2032
- Figure 25: Middle East & Africa AOP Solution Revenue Share (%), by Country 2024 & 2032
- Figure 26: Asia Pacific AOP Solution Revenue (million), by Application 2024 & 2032
- Figure 27: Asia Pacific AOP Solution Revenue Share (%), by Application 2024 & 2032
- Figure 28: Asia Pacific AOP Solution Revenue (million), by Types 2024 & 2032
- Figure 29: Asia Pacific AOP Solution Revenue Share (%), by Types 2024 & 2032
- Figure 30: Asia Pacific AOP Solution Revenue (million), by Country 2024 & 2032
- Figure 31: Asia Pacific AOP Solution Revenue Share (%), by Country 2024 & 2032
List of Tables
- Table 1: Global AOP Solution Revenue million Forecast, by Region 2019 & 2032
- Table 2: Global AOP Solution Revenue million Forecast, by Application 2019 & 2032
- Table 3: Global AOP Solution Revenue million Forecast, by Types 2019 & 2032
- Table 4: Global AOP Solution Revenue million Forecast, by Region 2019 & 2032
- Table 5: Global AOP Solution Revenue million Forecast, by Application 2019 & 2032
- Table 6: Global AOP Solution Revenue million Forecast, by Types 2019 & 2032
- Table 7: Global AOP Solution Revenue million Forecast, by Country 2019 & 2032
- Table 8: United States AOP Solution Revenue (million) Forecast, by Application 2019 & 2032
- Table 9: Canada AOP Solution Revenue (million) Forecast, by Application 2019 & 2032
- Table 10: Mexico AOP Solution Revenue (million) Forecast, by Application 2019 & 2032
- Table 11: Global AOP Solution Revenue million Forecast, by Application 2019 & 2032
- Table 12: Global AOP Solution Revenue million Forecast, by Types 2019 & 2032
- Table 13: Global AOP Solution Revenue million Forecast, by Country 2019 & 2032
- Table 14: Brazil AOP Solution Revenue (million) Forecast, by Application 2019 & 2032
- Table 15: Argentina AOP Solution Revenue (million) Forecast, by Application 2019 & 2032
- Table 16: Rest of South America AOP Solution Revenue (million) Forecast, by Application 2019 & 2032
- Table 17: Global AOP Solution Revenue million Forecast, by Application 2019 & 2032
- Table 18: Global AOP Solution Revenue million Forecast, by Types 2019 & 2032
- Table 19: Global AOP Solution Revenue million Forecast, by Country 2019 & 2032
- Table 20: United Kingdom AOP Solution Revenue (million) Forecast, by Application 2019 & 2032
- Table 21: Germany AOP Solution Revenue (million) Forecast, by Application 2019 & 2032
- Table 22: France AOP Solution Revenue (million) Forecast, by Application 2019 & 2032
- Table 23: Italy AOP Solution Revenue (million) Forecast, by Application 2019 & 2032
- Table 24: Spain AOP Solution Revenue (million) Forecast, by Application 2019 & 2032
- Table 25: Russia AOP Solution Revenue (million) Forecast, by Application 2019 & 2032
- Table 26: Benelux AOP Solution Revenue (million) Forecast, by Application 2019 & 2032
- Table 27: Nordics AOP Solution Revenue (million) Forecast, by Application 2019 & 2032
- Table 28: Rest of Europe AOP Solution Revenue (million) Forecast, by Application 2019 & 2032
- Table 29: Global AOP Solution Revenue million Forecast, by Application 2019 & 2032
- Table 30: Global AOP Solution Revenue million Forecast, by Types 2019 & 2032
- Table 31: Global AOP Solution Revenue million Forecast, by Country 2019 & 2032
- Table 32: Turkey AOP Solution Revenue (million) Forecast, by Application 2019 & 2032
- Table 33: Israel AOP Solution Revenue (million) Forecast, by Application 2019 & 2032
- Table 34: GCC AOP Solution Revenue (million) Forecast, by Application 2019 & 2032
- Table 35: North Africa AOP Solution Revenue (million) Forecast, by Application 2019 & 2032
- Table 36: South Africa AOP Solution Revenue (million) Forecast, by Application 2019 & 2032
- Table 37: Rest of Middle East & Africa AOP Solution Revenue (million) Forecast, by Application 2019 & 2032
- Table 38: Global AOP Solution Revenue million Forecast, by Application 2019 & 2032
- Table 39: Global AOP Solution Revenue million Forecast, by Types 2019 & 2032
- Table 40: Global AOP Solution Revenue million Forecast, by Country 2019 & 2032
- Table 41: China AOP Solution Revenue (million) Forecast, by Application 2019 & 2032
- Table 42: India AOP Solution Revenue (million) Forecast, by Application 2019 & 2032
- Table 43: Japan AOP Solution Revenue (million) Forecast, by Application 2019 & 2032
- Table 44: South Korea AOP Solution Revenue (million) Forecast, by Application 2019 & 2032
- Table 45: ASEAN AOP Solution Revenue (million) Forecast, by Application 2019 & 2032
- Table 46: Oceania AOP Solution Revenue (million) Forecast, by Application 2019 & 2032
- Table 47: Rest of Asia Pacific AOP Solution Revenue (million) Forecast, by Application 2019 & 2032
Frequently Asked Questions
1. What is the projected Compound Annual Growth Rate (CAGR) of the AOP Solution?
The projected CAGR is approximately XX%.
2. Which companies are prominent players in the AOP Solution?
Key companies in the market include SUEZ, Xylem, Enviolet, Novexx, Bio-UV, Belmar Technologies, HPNow, EnviroChemie, SKion Water, Besino, Winfuture, Jiangsu Jiuwu High-tech, Genesis Water Technologies, Infinite Water, Arvia Technology, Spartan Environmental Technologies.
3. What are the main segments of the AOP Solution?
The market segments include Application, Types.
4. Can you provide details about the market size?
The market size is estimated to be USD XXX million as of 2022.
5. What are some drivers contributing to market growth?
N/A
6. What are the notable trends driving market growth?
N/A
7. Are there any restraints impacting market growth?
N/A
8. Can you provide examples of recent developments in the market?
N/A
9. What pricing options are available for accessing the report?
Pricing options include single-user, multi-user, and enterprise licenses priced at USD 2900.00, USD 4350.00, and USD 5800.00 respectively.
10. Is the market size provided in terms of value or volume?
The market size is provided in terms of value, measured in million.
11. Are there any specific market keywords associated with the report?
Yes, the market keyword associated with the report is "AOP Solution," which aids in identifying and referencing the specific market segment covered.
12. How do I determine which pricing option suits my needs best?
The pricing options vary based on user requirements and access needs. Individual users may opt for single-user licenses, while businesses requiring broader access may choose multi-user or enterprise licenses for cost-effective access to the report.
13. Are there any additional resources or data provided in the AOP Solution report?
While the report offers comprehensive insights, it's advisable to review the specific contents or supplementary materials provided to ascertain if additional resources or data are available.
14. How can I stay updated on further developments or reports in the AOP Solution?
To stay informed about further developments, trends, and reports in the AOP Solution, consider subscribing to industry newsletters, following relevant companies and organizations, or regularly checking reputable industry news sources and publications.
Methodology
Step 1 - Identification of Relevant Samples Size from Population Database


Step 2 - Approaches for Defining Global Market Size (Value, Volume* & Price*)

Note*: In applicable scenarios
Step 3 - Data Sources
Primary Research
- Web Analytics
- Survey Reports
- Research Institute
- Latest Research Reports
- Opinion Leaders
Secondary Research
- Annual Reports
- White Paper
- Latest Press Release
- Industry Association
- Paid Database
- Investor Presentations

Step 4 - Data Triangulation
Involves using different sources of information in order to increase the validity of a study
These sources are likely to be stakeholders in a program - participants, other researchers, program staff, other community members, and so on.
Then we put all data in single framework & apply various statistical tools to find out the dynamic on the market.
During the analysis stage, feedback from the stakeholder groups would be compared to determine areas of agreement as well as areas of divergence
