

Key Insights
The global anti-collision warning lens market is experiencing robust growth, driven by escalating demand for advanced driver-assistance systems (ADAS) and increasing vehicle production, particularly in emerging economies. The market's expansion is fueled by stricter safety regulations worldwide, heightened consumer awareness of road safety, and technological advancements leading to more sophisticated and cost-effective lens technologies. Major players like Bosch, Continental, and Denso are heavily invested in research and development, leading to innovations in lens materials, designs, and integration with other ADAS components. This competitive landscape fosters continuous improvement in lens performance, reliability, and affordability, further accelerating market penetration. The market is segmented by lens type (e.g., plastic, glass), vehicle type (passenger cars, commercial vehicles), and region, with North America and Europe currently holding significant market shares due to high vehicle ownership and stringent safety standards. However, Asia-Pacific is projected to witness the fastest growth due to rapid industrialization and rising disposable incomes. While challenges exist, such as the high initial investment required for ADAS integration and potential supply chain disruptions, the overall market outlook remains positive, with a projected Compound Annual Growth Rate (CAGR) exceeding 10% throughout the forecast period (2025-2033).
The market's future growth trajectory depends on several factors, including the continued development and affordability of autonomous driving technology, government incentives for ADAS adoption, and the increasing integration of anti-collision warning lenses with other safety features like lane departure warning and adaptive cruise control. Furthermore, the emergence of new materials with enhanced optical properties and durability will significantly influence market dynamics. The competitive landscape is likely to remain highly consolidated, with established players focusing on strategic partnerships, acquisitions, and technological innovations to maintain their market positions. The increasing focus on enhancing the performance and reliability of anti-collision warning lenses in diverse weather and lighting conditions will drive further market expansion. Successful penetration into developing markets will be crucial for achieving sustained growth in the long term.
Anti-Collision Warning Lens Market Report: 2019-2033
This comprehensive report provides an in-depth analysis of the global Anti-Collision Warning Lens market, projecting a market value exceeding $XX million by 2033. The study covers the historical period (2019-2024), the base year (2025), and the forecast period (2025-2033), offering invaluable insights for stakeholders across the automotive and technology sectors. Key players like Bosch, Continental, Denso, and others are meticulously analyzed, revealing market dynamics, growth trajectories, and future opportunities.
Anti-Collision Warning Lens Market Composition & Trends
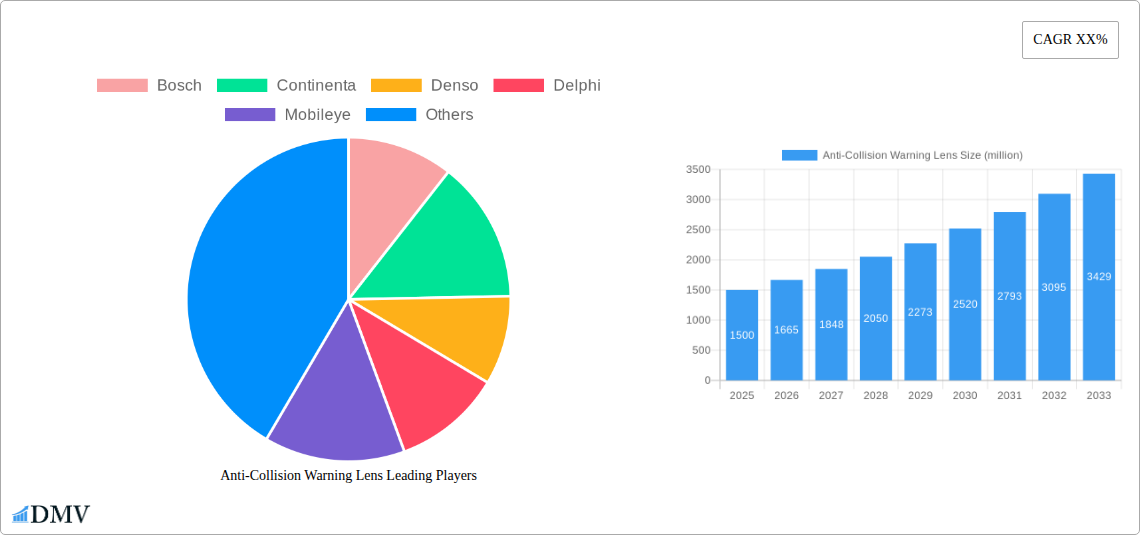
This section dives deep into the competitive landscape of the Anti-Collision Warning Lens market, analyzing market concentration, innovation drivers, regulatory influences, and the impact of substitute products. We evaluate the market share distribution among key players such as Bosch, Continental, Denso, Delphi, Mobileye, Valeo, Autoliv, ZF TRW, Magna, Aptiv, Hyundai Mobis, Hitachi, Omron, Hella, and Panasonic, revealing a highly competitive environment with varying degrees of market concentration. The report also analyzes mergers and acquisitions (M&A) activities within the industry, estimating a total deal value exceeding $XX million during the historical period, with a predicted increase to $XX million during the forecast period.
- Market Concentration: High, with top 5 players holding approximately XX% of the market share in 2024.
- Innovation Catalysts: Advancements in sensor technology, AI-powered algorithms, and miniaturization of components.
- Regulatory Landscape: Stringent safety regulations driving adoption across various vehicle segments.
- Substitute Products: Limited direct substitutes, primarily alternative driver-assistance systems.
- End-User Profiles: Primarily automotive OEMs and Tier-1 suppliers.
- M&A Activities: Significant M&A activity observed, driven by strategic expansion and technological integration.
Anti-Collision Warning Lens Industry Evolution
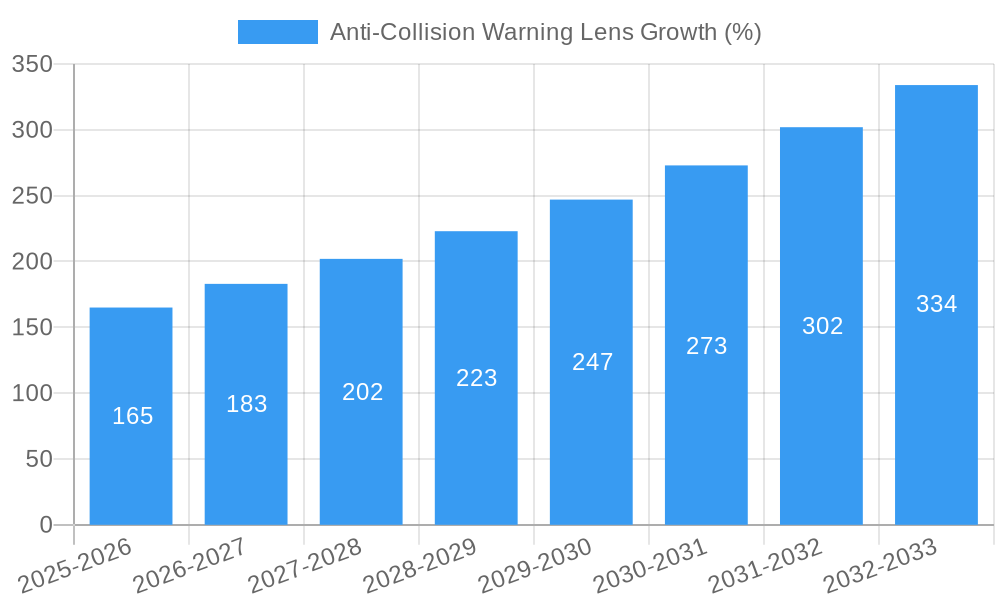
This section meticulously traces the evolution of the Anti-Collision Warning Lens market, highlighting key technological advancements and shifts in consumer demand that have fueled significant market growth. The market experienced a Compound Annual Growth Rate (CAGR) of XX% during the historical period (2019-2024), with predictions of a CAGR of XX% during the forecast period (2025-2033). This growth is largely attributed to increasing consumer demand for enhanced vehicle safety features, along with stricter regulatory requirements mandating advanced driver-assistance systems (ADAS). The adoption rate of Anti-Collision Warning Lenses within new vehicles is estimated to surpass XX% by 2033. The report delves into the influence of technological innovations such as improved sensor accuracy, enhanced processing power, and the integration of artificial intelligence (AI) to analyze environmental conditions and predict potential collisions. Furthermore, changing consumer preferences for safer and more technologically advanced vehicles significantly contribute to the rising demand for Anti-Collision Warning Lenses.
Leading Regions, Countries, or Segments in Anti-Collision Warning Lens
This section identifies the dominant regions and segments within the Anti-Collision Warning Lens market. North America currently holds the largest market share due to robust consumer demand for advanced safety features and stringent regulatory standards. Asia-Pacific is projected to experience the fastest growth during the forecast period, driven by rapid vehicle production growth and increasing investments in ADAS technologies.
- Key Drivers for North America's Dominance:
- High vehicle ownership rates
- Strong regulatory environment promoting ADAS adoption
- Significant investments in automotive R&D
- Key Drivers for Asia-Pacific Growth:
- Rapid increase in vehicle production
- Rising disposable incomes
- Government initiatives to improve road safety
The report provides a detailed country-wise analysis of the market, focusing on factors driving market dominance, including government regulations, consumer preferences and economic factors.
Anti-Collision Warning Lens Product Innovations
Recent innovations in Anti-Collision Warning Lenses focus on enhancing accuracy, range, and functionality. Manufacturers are integrating advanced sensor technologies, such as lidar and radar, for improved object detection and distance measurement, resulting in quicker response times and more accurate warnings. Furthermore, the integration of sophisticated algorithms and AI enhances the system’s ability to differentiate between various objects and interpret complex driving scenarios. These innovations are leading to a significant improvement in the effectiveness and reliability of Anti-Collision Warning Lens systems, promoting widespread adoption.
Propelling Factors for Anti-Collision Warning Lens Growth
The growth of the Anti-Collision Warning Lens market is primarily driven by stringent government regulations mandating advanced driver-assistance systems (ADAS) in new vehicles. Technological advancements, such as the integration of AI and improved sensor technology, further enhance the accuracy and reliability of these systems. Furthermore, rising consumer awareness regarding road safety and a growing preference for vehicles equipped with advanced safety features contribute significantly to market growth. The decreasing cost of these systems also makes them more accessible to a broader range of vehicles and consumers.
Obstacles in the Anti-Collision Warning Lens Market
Despite significant growth potential, the Anti-Collision Warning Lens market faces challenges. Supply chain disruptions due to global events can impact production and increase costs. Intense competition among established players necessitates continuous innovation and cost optimization. Furthermore, regulatory variations across different geographical regions can complicate product standardization and market entry. These factors can potentially impede market growth if not effectively addressed.
Future Opportunities in Anti-Collision Warning Lens
Emerging opportunities exist within the Anti-Collision Warning Lens market, particularly in the integration with autonomous driving systems and the development of more sophisticated warning systems. Expansion into new markets, especially in developing countries, offers significant potential. Additionally, exploring new applications beyond traditional automotive use cases, such as in industrial automation and robotics, could open new avenues for growth.
Major Players in the Anti-Collision Warning Lens Ecosystem
- Bosch
- Continental
- Denso
- Delphi Technologies
- Mobileye
- Valeo
- Autoliv
- ZF Group
- Magna International
- Aptiv
- Hyundai Mobis
- Hitachi
- Omron
- Hella
- Panasonic
Key Developments in Anti-Collision Warning Lens Industry
- 2022 Q4: Bosch launched its next-generation Anti-Collision Warning Lens with improved accuracy.
- 2023 Q1: Continental and Mobileye announced a strategic partnership to develop advanced ADAS systems, including improved Anti-Collision Warning Lenses.
- 2023 Q2: Several key players announced significant investments in R&D for enhanced sensor technology.
Strategic Anti-Collision Warning Lens Market Forecast
The Anti-Collision Warning Lens market is poised for robust growth, driven by technological advancements, increasing safety regulations, and a heightened focus on autonomous driving. The market is expected to continue expanding significantly throughout the forecast period, fueled by new product launches, strategic partnerships, and expanding adoption across various vehicle segments. The substantial market potential and continuous innovation within this sector suggest a promising future for Anti-Collision Warning Lens technology.
Anti-Collision Warning Lens Segmentation
-
1. Application
- 1.1. Commercial Vehicles
- 1.2. Passenger Vehicles
- 1.3. Others
-
2. Types
- 2.1. Millimeter Wave Radar Lens
- 2.2. Lidar Lens
Anti-Collision Warning Lens Segmentation By Geography
-
1. North America
- 1.1. United States
- 1.2. Canada
- 1.3. Mexico
-
2. South America
- 2.1. Brazil
- 2.2. Argentina
- 2.3. Rest of South America
-
3. Europe
- 3.1. United Kingdom
- 3.2. Germany
- 3.3. France
- 3.4. Italy
- 3.5. Spain
- 3.6. Russia
- 3.7. Benelux
- 3.8. Nordics
- 3.9. Rest of Europe
-
4. Middle East & Africa
- 4.1. Turkey
- 4.2. Israel
- 4.3. GCC
- 4.4. North Africa
- 4.5. South Africa
- 4.6. Rest of Middle East & Africa
-
5. Asia Pacific
- 5.1. China
- 5.2. India
- 5.3. Japan
- 5.4. South Korea
- 5.5. ASEAN
- 5.6. Oceania
- 5.7. Rest of Asia Pacific

Anti-Collision Warning Lens REPORT HIGHLIGHTS
| Aspects | Details |
|---|---|
| Study Period | 2019-2033 |
| Base Year | 2024 |
| Estimated Year | 2025 |
| Forecast Period | 2025-2033 |
| Historical Period | 2019-2024 |
| Growth Rate | CAGR of XX% from 2019-2033 |
| Segmentation |
|
Table of Contents
- 1. Introduction
- 1.1. Research Scope
- 1.2. Market Segmentation
- 1.3. Research Methodology
- 1.4. Definitions and Assumptions
- 2. Executive Summary
- 2.1. Introduction
- 3. Market Dynamics
- 3.1. Introduction
- 3.2. Market Drivers
- 3.3. Market Restrains
- 3.4. Market Trends
- 4. Market Factor Analysis
- 4.1. Porters Five Forces
- 4.2. Supply/Value Chain
- 4.3. PESTEL analysis
- 4.4. Market Entropy
- 4.5. Patent/Trademark Analysis
- 5. Global Anti-Collision Warning Lens Analysis, Insights and Forecast, 2019-2031
- 5.1. Market Analysis, Insights and Forecast - by Application
- 5.1.1. Commercial Vehicles
- 5.1.2. Passenger Vehicles
- 5.1.3. Others
- 5.2. Market Analysis, Insights and Forecast - by Types
- 5.2.1. Millimeter Wave Radar Lens
- 5.2.2. Lidar Lens
- 5.3. Market Analysis, Insights and Forecast - by Region
- 5.3.1. North America
- 5.3.2. South America
- 5.3.3. Europe
- 5.3.4. Middle East & Africa
- 5.3.5. Asia Pacific
- 5.1. Market Analysis, Insights and Forecast - by Application
- 6. North America Anti-Collision Warning Lens Analysis, Insights and Forecast, 2019-2031
- 6.1. Market Analysis, Insights and Forecast - by Application
- 6.1.1. Commercial Vehicles
- 6.1.2. Passenger Vehicles
- 6.1.3. Others
- 6.2. Market Analysis, Insights and Forecast - by Types
- 6.2.1. Millimeter Wave Radar Lens
- 6.2.2. Lidar Lens
- 6.1. Market Analysis, Insights and Forecast - by Application
- 7. South America Anti-Collision Warning Lens Analysis, Insights and Forecast, 2019-2031
- 7.1. Market Analysis, Insights and Forecast - by Application
- 7.1.1. Commercial Vehicles
- 7.1.2. Passenger Vehicles
- 7.1.3. Others
- 7.2. Market Analysis, Insights and Forecast - by Types
- 7.2.1. Millimeter Wave Radar Lens
- 7.2.2. Lidar Lens
- 7.1. Market Analysis, Insights and Forecast - by Application
- 8. Europe Anti-Collision Warning Lens Analysis, Insights and Forecast, 2019-2031
- 8.1. Market Analysis, Insights and Forecast - by Application
- 8.1.1. Commercial Vehicles
- 8.1.2. Passenger Vehicles
- 8.1.3. Others
- 8.2. Market Analysis, Insights and Forecast - by Types
- 8.2.1. Millimeter Wave Radar Lens
- 8.2.2. Lidar Lens
- 8.1. Market Analysis, Insights and Forecast - by Application
- 9. Middle East & Africa Anti-Collision Warning Lens Analysis, Insights and Forecast, 2019-2031
- 9.1. Market Analysis, Insights and Forecast - by Application
- 9.1.1. Commercial Vehicles
- 9.1.2. Passenger Vehicles
- 9.1.3. Others
- 9.2. Market Analysis, Insights and Forecast - by Types
- 9.2.1. Millimeter Wave Radar Lens
- 9.2.2. Lidar Lens
- 9.1. Market Analysis, Insights and Forecast - by Application
- 10. Asia Pacific Anti-Collision Warning Lens Analysis, Insights and Forecast, 2019-2031
- 10.1. Market Analysis, Insights and Forecast - by Application
- 10.1.1. Commercial Vehicles
- 10.1.2. Passenger Vehicles
- 10.1.3. Others
- 10.2. Market Analysis, Insights and Forecast - by Types
- 10.2.1. Millimeter Wave Radar Lens
- 10.2.2. Lidar Lens
- 10.1. Market Analysis, Insights and Forecast - by Application
- 11. Competitive Analysis
- 11.1. Global Market Share Analysis 2024
- 11.2. Company Profiles
- 11.2.1 Bosch
- 11.2.1.1. Overview
- 11.2.1.2. Products
- 11.2.1.3. SWOT Analysis
- 11.2.1.4. Recent Developments
- 11.2.1.5. Financials (Based on Availability)
- 11.2.2 Continenta
- 11.2.2.1. Overview
- 11.2.2.2. Products
- 11.2.2.3. SWOT Analysis
- 11.2.2.4. Recent Developments
- 11.2.2.5. Financials (Based on Availability)
- 11.2.3 Denso
- 11.2.3.1. Overview
- 11.2.3.2. Products
- 11.2.3.3. SWOT Analysis
- 11.2.3.4. Recent Developments
- 11.2.3.5. Financials (Based on Availability)
- 11.2.4 Delphi
- 11.2.4.1. Overview
- 11.2.4.2. Products
- 11.2.4.3. SWOT Analysis
- 11.2.4.4. Recent Developments
- 11.2.4.5. Financials (Based on Availability)
- 11.2.5 Mobileye
- 11.2.5.1. Overview
- 11.2.5.2. Products
- 11.2.5.3. SWOT Analysis
- 11.2.5.4. Recent Developments
- 11.2.5.5. Financials (Based on Availability)
- 11.2.6 Valeo
- 11.2.6.1. Overview
- 11.2.6.2. Products
- 11.2.6.3. SWOT Analysis
- 11.2.6.4. Recent Developments
- 11.2.6.5. Financials (Based on Availability)
- 11.2.7 Autoliv
- 11.2.7.1. Overview
- 11.2.7.2. Products
- 11.2.7.3. SWOT Analysis
- 11.2.7.4. Recent Developments
- 11.2.7.5. Financials (Based on Availability)
- 11.2.8 ZF TRW
- 11.2.8.1. Overview
- 11.2.8.2. Products
- 11.2.8.3. SWOT Analysis
- 11.2.8.4. Recent Developments
- 11.2.8.5. Financials (Based on Availability)
- 11.2.9 Magna
- 11.2.9.1. Overview
- 11.2.9.2. Products
- 11.2.9.3. SWOT Analysis
- 11.2.9.4. Recent Developments
- 11.2.9.5. Financials (Based on Availability)
- 11.2.10 Aptiv
- 11.2.10.1. Overview
- 11.2.10.2. Products
- 11.2.10.3. SWOT Analysis
- 11.2.10.4. Recent Developments
- 11.2.10.5. Financials (Based on Availability)
- 11.2.11 Hyundai Mobis
- 11.2.11.1. Overview
- 11.2.11.2. Products
- 11.2.11.3. SWOT Analysis
- 11.2.11.4. Recent Developments
- 11.2.11.5. Financials (Based on Availability)
- 11.2.12 Hitachi
- 11.2.12.1. Overview
- 11.2.12.2. Products
- 11.2.12.3. SWOT Analysis
- 11.2.12.4. Recent Developments
- 11.2.12.5. Financials (Based on Availability)
- 11.2.13 Omron
- 11.2.13.1. Overview
- 11.2.13.2. Products
- 11.2.13.3. SWOT Analysis
- 11.2.13.4. Recent Developments
- 11.2.13.5. Financials (Based on Availability)
- 11.2.14 Hella
- 11.2.14.1. Overview
- 11.2.14.2. Products
- 11.2.14.3. SWOT Analysis
- 11.2.14.4. Recent Developments
- 11.2.14.5. Financials (Based on Availability)
- 11.2.15 Panasonic
- 11.2.15.1. Overview
- 11.2.15.2. Products
- 11.2.15.3. SWOT Analysis
- 11.2.15.4. Recent Developments
- 11.2.15.5. Financials (Based on Availability)
- 11.2.1 Bosch
List of Figures
- Figure 1: Global Anti-Collision Warning Lens Revenue Breakdown (million, %) by Region 2024 & 2032
- Figure 2: Global Anti-Collision Warning Lens Volume Breakdown (K, %) by Region 2024 & 2032
- Figure 3: North America Anti-Collision Warning Lens Revenue (million), by Application 2024 & 2032
- Figure 4: North America Anti-Collision Warning Lens Volume (K), by Application 2024 & 2032
- Figure 5: North America Anti-Collision Warning Lens Revenue Share (%), by Application 2024 & 2032
- Figure 6: North America Anti-Collision Warning Lens Volume Share (%), by Application 2024 & 2032
- Figure 7: North America Anti-Collision Warning Lens Revenue (million), by Types 2024 & 2032
- Figure 8: North America Anti-Collision Warning Lens Volume (K), by Types 2024 & 2032
- Figure 9: North America Anti-Collision Warning Lens Revenue Share (%), by Types 2024 & 2032
- Figure 10: North America Anti-Collision Warning Lens Volume Share (%), by Types 2024 & 2032
- Figure 11: North America Anti-Collision Warning Lens Revenue (million), by Country 2024 & 2032
- Figure 12: North America Anti-Collision Warning Lens Volume (K), by Country 2024 & 2032
- Figure 13: North America Anti-Collision Warning Lens Revenue Share (%), by Country 2024 & 2032
- Figure 14: North America Anti-Collision Warning Lens Volume Share (%), by Country 2024 & 2032
- Figure 15: South America Anti-Collision Warning Lens Revenue (million), by Application 2024 & 2032
- Figure 16: South America Anti-Collision Warning Lens Volume (K), by Application 2024 & 2032
- Figure 17: South America Anti-Collision Warning Lens Revenue Share (%), by Application 2024 & 2032
- Figure 18: South America Anti-Collision Warning Lens Volume Share (%), by Application 2024 & 2032
- Figure 19: South America Anti-Collision Warning Lens Revenue (million), by Types 2024 & 2032
- Figure 20: South America Anti-Collision Warning Lens Volume (K), by Types 2024 & 2032
- Figure 21: South America Anti-Collision Warning Lens Revenue Share (%), by Types 2024 & 2032
- Figure 22: South America Anti-Collision Warning Lens Volume Share (%), by Types 2024 & 2032
- Figure 23: South America Anti-Collision Warning Lens Revenue (million), by Country 2024 & 2032
- Figure 24: South America Anti-Collision Warning Lens Volume (K), by Country 2024 & 2032
- Figure 25: South America Anti-Collision Warning Lens Revenue Share (%), by Country 2024 & 2032
- Figure 26: South America Anti-Collision Warning Lens Volume Share (%), by Country 2024 & 2032
- Figure 27: Europe Anti-Collision Warning Lens Revenue (million), by Application 2024 & 2032
- Figure 28: Europe Anti-Collision Warning Lens Volume (K), by Application 2024 & 2032
- Figure 29: Europe Anti-Collision Warning Lens Revenue Share (%), by Application 2024 & 2032
- Figure 30: Europe Anti-Collision Warning Lens Volume Share (%), by Application 2024 & 2032
- Figure 31: Europe Anti-Collision Warning Lens Revenue (million), by Types 2024 & 2032
- Figure 32: Europe Anti-Collision Warning Lens Volume (K), by Types 2024 & 2032
- Figure 33: Europe Anti-Collision Warning Lens Revenue Share (%), by Types 2024 & 2032
- Figure 34: Europe Anti-Collision Warning Lens Volume Share (%), by Types 2024 & 2032
- Figure 35: Europe Anti-Collision Warning Lens Revenue (million), by Country 2024 & 2032
- Figure 36: Europe Anti-Collision Warning Lens Volume (K), by Country 2024 & 2032
- Figure 37: Europe Anti-Collision Warning Lens Revenue Share (%), by Country 2024 & 2032
- Figure 38: Europe Anti-Collision Warning Lens Volume Share (%), by Country 2024 & 2032
- Figure 39: Middle East & Africa Anti-Collision Warning Lens Revenue (million), by Application 2024 & 2032
- Figure 40: Middle East & Africa Anti-Collision Warning Lens Volume (K), by Application 2024 & 2032
- Figure 41: Middle East & Africa Anti-Collision Warning Lens Revenue Share (%), by Application 2024 & 2032
- Figure 42: Middle East & Africa Anti-Collision Warning Lens Volume Share (%), by Application 2024 & 2032
- Figure 43: Middle East & Africa Anti-Collision Warning Lens Revenue (million), by Types 2024 & 2032
- Figure 44: Middle East & Africa Anti-Collision Warning Lens Volume (K), by Types 2024 & 2032
- Figure 45: Middle East & Africa Anti-Collision Warning Lens Revenue Share (%), by Types 2024 & 2032
- Figure 46: Middle East & Africa Anti-Collision Warning Lens Volume Share (%), by Types 2024 & 2032
- Figure 47: Middle East & Africa Anti-Collision Warning Lens Revenue (million), by Country 2024 & 2032
- Figure 48: Middle East & Africa Anti-Collision Warning Lens Volume (K), by Country 2024 & 2032
- Figure 49: Middle East & Africa Anti-Collision Warning Lens Revenue Share (%), by Country 2024 & 2032
- Figure 50: Middle East & Africa Anti-Collision Warning Lens Volume Share (%), by Country 2024 & 2032
- Figure 51: Asia Pacific Anti-Collision Warning Lens Revenue (million), by Application 2024 & 2032
- Figure 52: Asia Pacific Anti-Collision Warning Lens Volume (K), by Application 2024 & 2032
- Figure 53: Asia Pacific Anti-Collision Warning Lens Revenue Share (%), by Application 2024 & 2032
- Figure 54: Asia Pacific Anti-Collision Warning Lens Volume Share (%), by Application 2024 & 2032
- Figure 55: Asia Pacific Anti-Collision Warning Lens Revenue (million), by Types 2024 & 2032
- Figure 56: Asia Pacific Anti-Collision Warning Lens Volume (K), by Types 2024 & 2032
- Figure 57: Asia Pacific Anti-Collision Warning Lens Revenue Share (%), by Types 2024 & 2032
- Figure 58: Asia Pacific Anti-Collision Warning Lens Volume Share (%), by Types 2024 & 2032
- Figure 59: Asia Pacific Anti-Collision Warning Lens Revenue (million), by Country 2024 & 2032
- Figure 60: Asia Pacific Anti-Collision Warning Lens Volume (K), by Country 2024 & 2032
- Figure 61: Asia Pacific Anti-Collision Warning Lens Revenue Share (%), by Country 2024 & 2032
- Figure 62: Asia Pacific Anti-Collision Warning Lens Volume Share (%), by Country 2024 & 2032
List of Tables
- Table 1: Global Anti-Collision Warning Lens Revenue million Forecast, by Region 2019 & 2032
- Table 2: Global Anti-Collision Warning Lens Volume K Forecast, by Region 2019 & 2032
- Table 3: Global Anti-Collision Warning Lens Revenue million Forecast, by Application 2019 & 2032
- Table 4: Global Anti-Collision Warning Lens Volume K Forecast, by Application 2019 & 2032
- Table 5: Global Anti-Collision Warning Lens Revenue million Forecast, by Types 2019 & 2032
- Table 6: Global Anti-Collision Warning Lens Volume K Forecast, by Types 2019 & 2032
- Table 7: Global Anti-Collision Warning Lens Revenue million Forecast, by Region 2019 & 2032
- Table 8: Global Anti-Collision Warning Lens Volume K Forecast, by Region 2019 & 2032
- Table 9: Global Anti-Collision Warning Lens Revenue million Forecast, by Application 2019 & 2032
- Table 10: Global Anti-Collision Warning Lens Volume K Forecast, by Application 2019 & 2032
- Table 11: Global Anti-Collision Warning Lens Revenue million Forecast, by Types 2019 & 2032
- Table 12: Global Anti-Collision Warning Lens Volume K Forecast, by Types 2019 & 2032
- Table 13: Global Anti-Collision Warning Lens Revenue million Forecast, by Country 2019 & 2032
- Table 14: Global Anti-Collision Warning Lens Volume K Forecast, by Country 2019 & 2032
- Table 15: United States Anti-Collision Warning Lens Revenue (million) Forecast, by Application 2019 & 2032
- Table 16: United States Anti-Collision Warning Lens Volume (K) Forecast, by Application 2019 & 2032
- Table 17: Canada Anti-Collision Warning Lens Revenue (million) Forecast, by Application 2019 & 2032
- Table 18: Canada Anti-Collision Warning Lens Volume (K) Forecast, by Application 2019 & 2032
- Table 19: Mexico Anti-Collision Warning Lens Revenue (million) Forecast, by Application 2019 & 2032
- Table 20: Mexico Anti-Collision Warning Lens Volume (K) Forecast, by Application 2019 & 2032
- Table 21: Global Anti-Collision Warning Lens Revenue million Forecast, by Application 2019 & 2032
- Table 22: Global Anti-Collision Warning Lens Volume K Forecast, by Application 2019 & 2032
- Table 23: Global Anti-Collision Warning Lens Revenue million Forecast, by Types 2019 & 2032
- Table 24: Global Anti-Collision Warning Lens Volume K Forecast, by Types 2019 & 2032
- Table 25: Global Anti-Collision Warning Lens Revenue million Forecast, by Country 2019 & 2032
- Table 26: Global Anti-Collision Warning Lens Volume K Forecast, by Country 2019 & 2032
- Table 27: Brazil Anti-Collision Warning Lens Revenue (million) Forecast, by Application 2019 & 2032
- Table 28: Brazil Anti-Collision Warning Lens Volume (K) Forecast, by Application 2019 & 2032
- Table 29: Argentina Anti-Collision Warning Lens Revenue (million) Forecast, by Application 2019 & 2032
- Table 30: Argentina Anti-Collision Warning Lens Volume (K) Forecast, by Application 2019 & 2032
- Table 31: Rest of South America Anti-Collision Warning Lens Revenue (million) Forecast, by Application 2019 & 2032
- Table 32: Rest of South America Anti-Collision Warning Lens Volume (K) Forecast, by Application 2019 & 2032
- Table 33: Global Anti-Collision Warning Lens Revenue million Forecast, by Application 2019 & 2032
- Table 34: Global Anti-Collision Warning Lens Volume K Forecast, by Application 2019 & 2032
- Table 35: Global Anti-Collision Warning Lens Revenue million Forecast, by Types 2019 & 2032
- Table 36: Global Anti-Collision Warning Lens Volume K Forecast, by Types 2019 & 2032
- Table 37: Global Anti-Collision Warning Lens Revenue million Forecast, by Country 2019 & 2032
- Table 38: Global Anti-Collision Warning Lens Volume K Forecast, by Country 2019 & 2032
- Table 39: United Kingdom Anti-Collision Warning Lens Revenue (million) Forecast, by Application 2019 & 2032
- Table 40: United Kingdom Anti-Collision Warning Lens Volume (K) Forecast, by Application 2019 & 2032
- Table 41: Germany Anti-Collision Warning Lens Revenue (million) Forecast, by Application 2019 & 2032
- Table 42: Germany Anti-Collision Warning Lens Volume (K) Forecast, by Application 2019 & 2032
- Table 43: France Anti-Collision Warning Lens Revenue (million) Forecast, by Application 2019 & 2032
- Table 44: France Anti-Collision Warning Lens Volume (K) Forecast, by Application 2019 & 2032
- Table 45: Italy Anti-Collision Warning Lens Revenue (million) Forecast, by Application 2019 & 2032
- Table 46: Italy Anti-Collision Warning Lens Volume (K) Forecast, by Application 2019 & 2032
- Table 47: Spain Anti-Collision Warning Lens Revenue (million) Forecast, by Application 2019 & 2032
- Table 48: Spain Anti-Collision Warning Lens Volume (K) Forecast, by Application 2019 & 2032
- Table 49: Russia Anti-Collision Warning Lens Revenue (million) Forecast, by Application 2019 & 2032
- Table 50: Russia Anti-Collision Warning Lens Volume (K) Forecast, by Application 2019 & 2032
- Table 51: Benelux Anti-Collision Warning Lens Revenue (million) Forecast, by Application 2019 & 2032
- Table 52: Benelux Anti-Collision Warning Lens Volume (K) Forecast, by Application 2019 & 2032
- Table 53: Nordics Anti-Collision Warning Lens Revenue (million) Forecast, by Application 2019 & 2032
- Table 54: Nordics Anti-Collision Warning Lens Volume (K) Forecast, by Application 2019 & 2032
- Table 55: Rest of Europe Anti-Collision Warning Lens Revenue (million) Forecast, by Application 2019 & 2032
- Table 56: Rest of Europe Anti-Collision Warning Lens Volume (K) Forecast, by Application 2019 & 2032
- Table 57: Global Anti-Collision Warning Lens Revenue million Forecast, by Application 2019 & 2032
- Table 58: Global Anti-Collision Warning Lens Volume K Forecast, by Application 2019 & 2032
- Table 59: Global Anti-Collision Warning Lens Revenue million Forecast, by Types 2019 & 2032
- Table 60: Global Anti-Collision Warning Lens Volume K Forecast, by Types 2019 & 2032
- Table 61: Global Anti-Collision Warning Lens Revenue million Forecast, by Country 2019 & 2032
- Table 62: Global Anti-Collision Warning Lens Volume K Forecast, by Country 2019 & 2032
- Table 63: Turkey Anti-Collision Warning Lens Revenue (million) Forecast, by Application 2019 & 2032
- Table 64: Turkey Anti-Collision Warning Lens Volume (K) Forecast, by Application 2019 & 2032
- Table 65: Israel Anti-Collision Warning Lens Revenue (million) Forecast, by Application 2019 & 2032
- Table 66: Israel Anti-Collision Warning Lens Volume (K) Forecast, by Application 2019 & 2032
- Table 67: GCC Anti-Collision Warning Lens Revenue (million) Forecast, by Application 2019 & 2032
- Table 68: GCC Anti-Collision Warning Lens Volume (K) Forecast, by Application 2019 & 2032
- Table 69: North Africa Anti-Collision Warning Lens Revenue (million) Forecast, by Application 2019 & 2032
- Table 70: North Africa Anti-Collision Warning Lens Volume (K) Forecast, by Application 2019 & 2032
- Table 71: South Africa Anti-Collision Warning Lens Revenue (million) Forecast, by Application 2019 & 2032
- Table 72: South Africa Anti-Collision Warning Lens Volume (K) Forecast, by Application 2019 & 2032
- Table 73: Rest of Middle East & Africa Anti-Collision Warning Lens Revenue (million) Forecast, by Application 2019 & 2032
- Table 74: Rest of Middle East & Africa Anti-Collision Warning Lens Volume (K) Forecast, by Application 2019 & 2032
- Table 75: Global Anti-Collision Warning Lens Revenue million Forecast, by Application 2019 & 2032
- Table 76: Global Anti-Collision Warning Lens Volume K Forecast, by Application 2019 & 2032
- Table 77: Global Anti-Collision Warning Lens Revenue million Forecast, by Types 2019 & 2032
- Table 78: Global Anti-Collision Warning Lens Volume K Forecast, by Types 2019 & 2032
- Table 79: Global Anti-Collision Warning Lens Revenue million Forecast, by Country 2019 & 2032
- Table 80: Global Anti-Collision Warning Lens Volume K Forecast, by Country 2019 & 2032
- Table 81: China Anti-Collision Warning Lens Revenue (million) Forecast, by Application 2019 & 2032
- Table 82: China Anti-Collision Warning Lens Volume (K) Forecast, by Application 2019 & 2032
- Table 83: India Anti-Collision Warning Lens Revenue (million) Forecast, by Application 2019 & 2032
- Table 84: India Anti-Collision Warning Lens Volume (K) Forecast, by Application 2019 & 2032
- Table 85: Japan Anti-Collision Warning Lens Revenue (million) Forecast, by Application 2019 & 2032
- Table 86: Japan Anti-Collision Warning Lens Volume (K) Forecast, by Application 2019 & 2032
- Table 87: South Korea Anti-Collision Warning Lens Revenue (million) Forecast, by Application 2019 & 2032
- Table 88: South Korea Anti-Collision Warning Lens Volume (K) Forecast, by Application 2019 & 2032
- Table 89: ASEAN Anti-Collision Warning Lens Revenue (million) Forecast, by Application 2019 & 2032
- Table 90: ASEAN Anti-Collision Warning Lens Volume (K) Forecast, by Application 2019 & 2032
- Table 91: Oceania Anti-Collision Warning Lens Revenue (million) Forecast, by Application 2019 & 2032
- Table 92: Oceania Anti-Collision Warning Lens Volume (K) Forecast, by Application 2019 & 2032
- Table 93: Rest of Asia Pacific Anti-Collision Warning Lens Revenue (million) Forecast, by Application 2019 & 2032
- Table 94: Rest of Asia Pacific Anti-Collision Warning Lens Volume (K) Forecast, by Application 2019 & 2032
Frequently Asked Questions
1. What is the projected Compound Annual Growth Rate (CAGR) of the Anti-Collision Warning Lens?
The projected CAGR is approximately XX%.
2. Which companies are prominent players in the Anti-Collision Warning Lens?
Key companies in the market include Bosch, Continenta, Denso, Delphi, Mobileye, Valeo, Autoliv, ZF TRW, Magna, Aptiv, Hyundai Mobis, Hitachi, Omron, Hella, Panasonic.
3. What are the main segments of the Anti-Collision Warning Lens?
The market segments include Application, Types.
4. Can you provide details about the market size?
The market size is estimated to be USD XXX million as of 2022.
5. What are some drivers contributing to market growth?
N/A
6. What are the notable trends driving market growth?
N/A
7. Are there any restraints impacting market growth?
N/A
8. Can you provide examples of recent developments in the market?
N/A
9. What pricing options are available for accessing the report?
Pricing options include single-user, multi-user, and enterprise licenses priced at USD 4350.00, USD 6525.00, and USD 8700.00 respectively.
10. Is the market size provided in terms of value or volume?
The market size is provided in terms of value, measured in million and volume, measured in K.
11. Are there any specific market keywords associated with the report?
Yes, the market keyword associated with the report is "Anti-Collision Warning Lens," which aids in identifying and referencing the specific market segment covered.
12. How do I determine which pricing option suits my needs best?
The pricing options vary based on user requirements and access needs. Individual users may opt for single-user licenses, while businesses requiring broader access may choose multi-user or enterprise licenses for cost-effective access to the report.
13. Are there any additional resources or data provided in the Anti-Collision Warning Lens report?
While the report offers comprehensive insights, it's advisable to review the specific contents or supplementary materials provided to ascertain if additional resources or data are available.
14. How can I stay updated on further developments or reports in the Anti-Collision Warning Lens?
To stay informed about further developments, trends, and reports in the Anti-Collision Warning Lens, consider subscribing to industry newsletters, following relevant companies and organizations, or regularly checking reputable industry news sources and publications.
Methodology
Step 1 - Identification of Relevant Samples Size from Population Database


Step 2 - Approaches for Defining Global Market Size (Value, Volume* & Price*)

Note*: In applicable scenarios
Step 3 - Data Sources
Primary Research
- Web Analytics
- Survey Reports
- Research Institute
- Latest Research Reports
- Opinion Leaders
Secondary Research
- Annual Reports
- White Paper
- Latest Press Release
- Industry Association
- Paid Database
- Investor Presentations

Step 4 - Data Triangulation
Involves using different sources of information in order to increase the validity of a study
These sources are likely to be stakeholders in a program - participants, other researchers, program staff, other community members, and so on.
Then we put all data in single framework & apply various statistical tools to find out the dynamic on the market.
During the analysis stage, feedback from the stakeholder groups would be compared to determine areas of agreement as well as areas of divergence
