

Key Insights
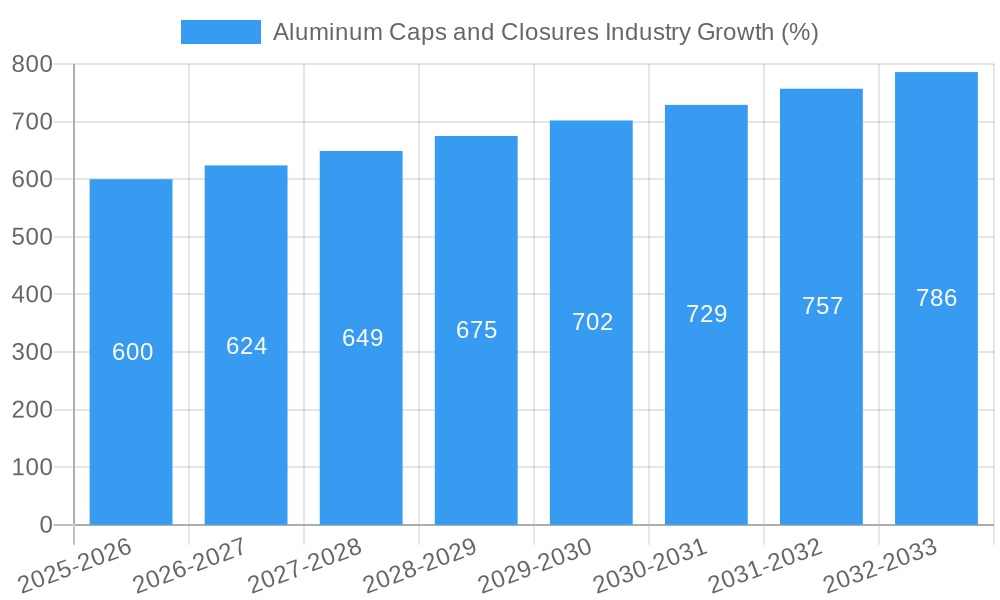
The global aluminum caps and closures market is a dynamic sector experiencing steady growth, projected at a Compound Annual Growth Rate (CAGR) of 4.00% from 2019 to 2033. This expansion is fueled by several key drivers. The increasing demand for lightweight, recyclable, and tamper-evident packaging across diverse industries like beverages, pharmaceuticals, food, and cosmetics is a significant factor. Consumer preference for convenient and safe packaging solutions further boosts market growth. Furthermore, advancements in manufacturing technologies, leading to improved production efficiency and cost-effectiveness, are contributing to the market's expansion. The segment for screw caps holds a significant market share due to its widespread use across various applications, followed by crown corks popular in the beverage industry. While the market faces restraints such as fluctuating aluminum prices and the emergence of alternative materials, the industry's ongoing innovation in sustainable packaging solutions, such as increased use of recycled aluminum, is mitigating these challenges. The Asia Pacific region is expected to show robust growth due to its expanding population and rapidly developing manufacturing and food & beverage sectors. North America and Europe also represent substantial market segments, driven by a strong focus on product safety and brand protection. Major players such as Amcor PLC, Silgan Closures, and Guala Closures are leading the market through continuous innovation, strategic acquisitions, and global expansion.
The competitive landscape is characterized by both large multinational corporations and specialized regional manufacturers. While established players maintain a strong presence, smaller companies are innovating within niche segments, focusing on specific applications or sustainable materials. The ongoing shift towards sustainable packaging practices is expected to drive further growth in the aluminum caps and closures market, leading to increased demand for recyclable and lightweight options. This trend will require manufacturers to invest in sustainable production methods and develop innovative solutions, creating opportunities for both established players and new entrants in the coming years. Future growth will largely depend on factors such as economic growth, changing consumer preferences, and government regulations regarding packaging sustainability. The market is predicted to witness a notable expansion in the forecast period (2025-2033), with a significant contribution from emerging economies in Asia Pacific and Latin America.

Aluminum Caps and Closures Industry Market Report: 2019-2033
This comprehensive report provides a detailed analysis of the global Aluminum Caps and Closures industry, offering invaluable insights for stakeholders seeking to navigate this dynamic market. The report covers the period 2019-2033, with a base year of 2025 and a forecast period spanning 2025-2033. The market is segmented by type (Screw Caps, Crown Cork, Lugs (Press Twist), Easy Open End, Other Types of Caps & Closures) and application (Beverages, Pharmaceutical, Food, Cosmetics, Other Applications). The global market size in 2025 is estimated at $XX Million.
Aluminum Caps and Closures Industry Market Composition & Trends
This section evaluates the competitive landscape, innovation drivers, regulatory environment, and market dynamics within the aluminum caps and closures industry. The market is moderately concentrated, with several key players holding significant market share. However, the presence of numerous smaller players indicates a dynamic and competitive environment. Innovation is driven by the need for improved sustainability, enhanced product protection, and cost optimization. Regulatory changes concerning material recyclability and food safety significantly impact industry practices. Substitute products, such as plastic caps, pose a constant challenge. Mergers and acquisitions (M&A) activity has been moderately active, with deal values totaling approximately $XX Million in the last five years.
- Market Share Distribution (2024): Amcor PLC (15%), Silgan Closures (12%), Guala Closures (10%), Others (63%)
- Significant M&A Activity: While precise deal values are not publicly available for all transactions, significant consolidation has been observed in recent years. The average deal value for M&A in the industry is estimated at $XX Million.
- End-User Profiles: The major end-users are the beverage, pharmaceutical, food, and cosmetic industries, each with distinct needs and demands for cap and closure solutions.
Aluminum Caps and Closures Industry Industry Evolution
The aluminum caps and closures industry has witnessed significant evolution during the historical period (2019-2024), driven by technological advancements, shifting consumer preferences, and increasing sustainability concerns. The market experienced a Compound Annual Growth Rate (CAGR) of approximately XX% during this period, primarily fueled by rising demand from the beverage and food sectors. Technological advancements such as lightweighting techniques, improved sealing technologies, and enhanced printing capabilities are enabling the production of more sustainable and efficient caps and closures. Consumer demand for convenient and tamper-evident packaging has also played a significant role. This demand for sustainable and innovative products is expected to accelerate during the forecast period (2025-2033) leading to an estimated CAGR of XX%. The adoption of new technologies like digital printing is growing steadily, with an estimated XX% adoption rate among key players by 2033.
Leading Regions, Countries, or Segments in Aluminum Caps and Closures Industry
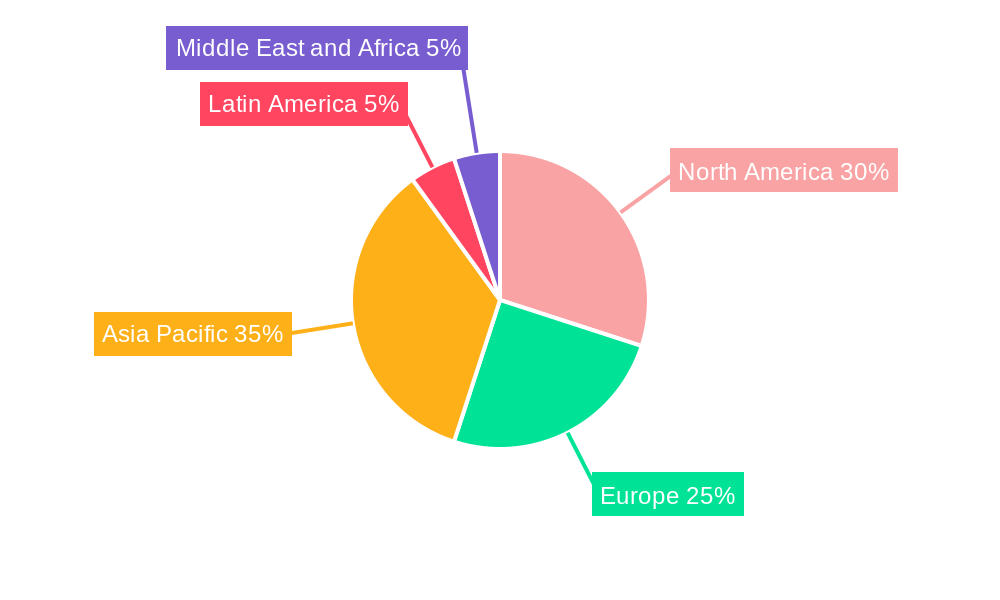
The North American and European regions currently dominate the aluminum caps and closures market, driven by high per capita consumption of packaged goods and advanced manufacturing capabilities. However, Asia-Pacific is witnessing rapid growth due to rising disposable incomes and increasing demand. Within segments, screw caps represent the largest share of the market, followed by crown corks.
- Key Drivers for North America Dominance: Strong regulatory support for recycled aluminum, high consumption of beverages, and established manufacturing infrastructure.
- Key Drivers for Asia-Pacific Growth: Rapidly expanding middle class, increasing demand for packaged food and beverages, and favorable government policies supporting local manufacturing.
- Dominant Type Segment: Screw caps are the dominant type due to their versatility, ease of use, and suitability for various applications.
- Dominant Application Segment: The beverage sector accounts for the largest share of demand, particularly within carbonated soft drinks and bottled water.
Aluminum Caps and Closures Industry Product Innovations
Recent innovations include lightweight designs that reduce material consumption and enhance recyclability. Improvements in sealing technologies ensure product integrity and freshness. Advances in printing technologies allow for enhanced branding and customization options. The development of easy-open closures caters to consumer preferences for convenient packaging. Furthermore, the introduction of caps with integrated features, such as tamper-evident seals and dispensing mechanisms, is driving market growth.
Propelling Factors for Aluminum Caps and Closures Industry Growth
Several factors propel the growth of the aluminum caps and closures industry. Technological advancements in material science and manufacturing processes allow for cost-effective and sustainable solutions. The growth of the beverage, food, and pharmaceutical sectors directly translates to increased demand. Government regulations mandating recyclable packaging incentivize the use of aluminum.
Obstacles in the Aluminum Caps and Closures Industry Market
The industry faces challenges such as fluctuations in raw material prices (aluminum), intense competition from alternative packaging materials (plastics), and stringent environmental regulations that necessitate continuous innovation in sustainable solutions. Supply chain disruptions can also lead to production delays and increased costs. These factors can collectively impact profit margins and market growth potential.
Future Opportunities in Aluminum Caps and Closures Industry
Emerging opportunities include the development of caps incorporating sustainable materials (e.g., recycled aluminum) and innovative designs that improve recyclability. Expanding into new markets, particularly in developing economies, presents significant potential. The increasing demand for customized packaging and innovative closure mechanisms for specialized products presents further opportunities.
Major Players in the Aluminum Caps and Closures Industry Ecosystem
- Alutop
- Easy Open Lid Industry Corp Yiwu
- Rauh GmbH & Co Blechwarenfabrikations-KG
- Herti JSC
- IDEA CAP SRL
- SKS Bottle & Packaging Inc
- Hicap Closures Co Ltd
- RPC Group (PET Power)
- Nippon Closures Co Ltd
- Amcor PLC
- Federfintech
- Pelliconi & C SpA
- Silgan Closures GmbH
- Guala Closures SpA
- Reynolds Packaging Group Ltd
- Closure Systems International Inc (CSI)
- O Berk Company
- Tecnocap Group
- Federfin Tech SRL
- The Cary Company
- Shadong Lipeng Co Ltd
- Berlin Packaging (Qorpak)
Key Developments in Aluminum Caps and Closures Industry Industry
- April 2021: Pelliconi launched a new e-shop, enabling customers to purchase customizable online caps in small batches. The company also introduced new digital printing technology for metal caps and a commercial strategy for online sales. This significantly enhanced market accessibility and customer customization options.
Strategic Aluminum Caps and Closures Industry Market Forecast
The aluminum caps and closures market is poised for continued growth, driven by ongoing innovation in sustainable packaging solutions and increasing demand from key end-use sectors. The industry will witness further consolidation through mergers and acquisitions, alongside the emergence of new technologies and players. The market is expected to reach $XX Million by 2033. This growth will be supported by increasing demand for convenience, sustainability, and product protection in packaging.
Aluminum Caps and Closures Industry Segmentation
-
1. Type
- 1.1. Screw Caps
- 1.2. Crown Cork
- 1.3. Lugs (Press Twist)
- 1.4. East Open End
- 1.5. Other Types of Caps & Closures
-
2. Application
- 2.1. Beverages
- 2.2. Pharmaceutical
- 2.3. Food
- 2.4. Cosmetics
- 2.5. Other Applications
Aluminum Caps and Closures Industry Segmentation By Geography
- 1. North America
- 2. Europe
- 3. Asia Pacific
- 4. Latin America
- 5. Middle East and Africa
Aluminum Caps and Closures Industry REPORT HIGHLIGHTS
| Aspects | Details |
|---|---|
| Study Period | 2019-2033 |
| Base Year | 2024 |
| Estimated Year | 2025 |
| Forecast Period | 2025-2033 |
| Historical Period | 2019-2024 |
| Growth Rate | CAGR of 4.00% from 2019-2033 |
| Segmentation |
|
Table of Contents
- 1. Introduction
- 1.1. Research Scope
- 1.2. Market Segmentation
- 1.3. Research Methodology
- 1.4. Definitions and Assumptions
- 2. Executive Summary
- 2.1. Introduction
- 3. Market Dynamics
- 3.1. Introduction
- 3.2. Market Drivers
- 3.2.1. Recyclability of the Products; Superior Properties Compared to Other Closure Materials
- 3.3. Market Restrains
- 3.3.1. High Adoption Rate of Other Types of Closure Materials
- 3.4. Market Trends
- 3.4.1. Pharmaceutical Sector is Expected to Witness the Highest Growth Rate
- 4. Market Factor Analysis
- 4.1. Porters Five Forces
- 4.2. Supply/Value Chain
- 4.3. PESTEL analysis
- 4.4. Market Entropy
- 4.5. Patent/Trademark Analysis
- 5. Global Aluminum Caps and Closures Industry Analysis, Insights and Forecast, 2019-2031
- 5.1. Market Analysis, Insights and Forecast - by Type
- 5.1.1. Screw Caps
- 5.1.2. Crown Cork
- 5.1.3. Lugs (Press Twist)
- 5.1.4. East Open End
- 5.1.5. Other Types of Caps & Closures
- 5.2. Market Analysis, Insights and Forecast - by Application
- 5.2.1. Beverages
- 5.2.2. Pharmaceutical
- 5.2.3. Food
- 5.2.4. Cosmetics
- 5.2.5. Other Applications
- 5.3. Market Analysis, Insights and Forecast - by Region
- 5.3.1. North America
- 5.3.2. Europe
- 5.3.3. Asia Pacific
- 5.3.4. Latin America
- 5.3.5. Middle East and Africa
- 5.1. Market Analysis, Insights and Forecast - by Type
- 6. North America Aluminum Caps and Closures Industry Analysis, Insights and Forecast, 2019-2031
- 6.1. Market Analysis, Insights and Forecast - by Type
- 6.1.1. Screw Caps
- 6.1.2. Crown Cork
- 6.1.3. Lugs (Press Twist)
- 6.1.4. East Open End
- 6.1.5. Other Types of Caps & Closures
- 6.2. Market Analysis, Insights and Forecast - by Application
- 6.2.1. Beverages
- 6.2.2. Pharmaceutical
- 6.2.3. Food
- 6.2.4. Cosmetics
- 6.2.5. Other Applications
- 6.1. Market Analysis, Insights and Forecast - by Type
- 7. Europe Aluminum Caps and Closures Industry Analysis, Insights and Forecast, 2019-2031
- 7.1. Market Analysis, Insights and Forecast - by Type
- 7.1.1. Screw Caps
- 7.1.2. Crown Cork
- 7.1.3. Lugs (Press Twist)
- 7.1.4. East Open End
- 7.1.5. Other Types of Caps & Closures
- 7.2. Market Analysis, Insights and Forecast - by Application
- 7.2.1. Beverages
- 7.2.2. Pharmaceutical
- 7.2.3. Food
- 7.2.4. Cosmetics
- 7.2.5. Other Applications
- 7.1. Market Analysis, Insights and Forecast - by Type
- 8. Asia Pacific Aluminum Caps and Closures Industry Analysis, Insights and Forecast, 2019-2031
- 8.1. Market Analysis, Insights and Forecast - by Type
- 8.1.1. Screw Caps
- 8.1.2. Crown Cork
- 8.1.3. Lugs (Press Twist)
- 8.1.4. East Open End
- 8.1.5. Other Types of Caps & Closures
- 8.2. Market Analysis, Insights and Forecast - by Application
- 8.2.1. Beverages
- 8.2.2. Pharmaceutical
- 8.2.3. Food
- 8.2.4. Cosmetics
- 8.2.5. Other Applications
- 8.1. Market Analysis, Insights and Forecast - by Type
- 9. Latin America Aluminum Caps and Closures Industry Analysis, Insights and Forecast, 2019-2031
- 9.1. Market Analysis, Insights and Forecast - by Type
- 9.1.1. Screw Caps
- 9.1.2. Crown Cork
- 9.1.3. Lugs (Press Twist)
- 9.1.4. East Open End
- 9.1.5. Other Types of Caps & Closures
- 9.2. Market Analysis, Insights and Forecast - by Application
- 9.2.1. Beverages
- 9.2.2. Pharmaceutical
- 9.2.3. Food
- 9.2.4. Cosmetics
- 9.2.5. Other Applications
- 9.1. Market Analysis, Insights and Forecast - by Type
- 10. Middle East and Africa Aluminum Caps and Closures Industry Analysis, Insights and Forecast, 2019-2031
- 10.1. Market Analysis, Insights and Forecast - by Type
- 10.1.1. Screw Caps
- 10.1.2. Crown Cork
- 10.1.3. Lugs (Press Twist)
- 10.1.4. East Open End
- 10.1.5. Other Types of Caps & Closures
- 10.2. Market Analysis, Insights and Forecast - by Application
- 10.2.1. Beverages
- 10.2.2. Pharmaceutical
- 10.2.3. Food
- 10.2.4. Cosmetics
- 10.2.5. Other Applications
- 10.1. Market Analysis, Insights and Forecast - by Type
- 11. North America Aluminum Caps and Closures Industry Analysis, Insights and Forecast, 2019-2031
- 11.1. Market Analysis, Insights and Forecast - By Country/Sub-region
- 11.1.1.
- 12. Europe Aluminum Caps and Closures Industry Analysis, Insights and Forecast, 2019-2031
- 12.1. Market Analysis, Insights and Forecast - By Country/Sub-region
- 12.1.1.
- 13. Asia Pacific Aluminum Caps and Closures Industry Analysis, Insights and Forecast, 2019-2031
- 13.1. Market Analysis, Insights and Forecast - By Country/Sub-region
- 13.1.1.
- 14. Latin America Aluminum Caps and Closures Industry Analysis, Insights and Forecast, 2019-2031
- 14.1. Market Analysis, Insights and Forecast - By Country/Sub-region
- 14.1.1.
- 15. Middle East and Africa Aluminum Caps and Closures Industry Analysis, Insights and Forecast, 2019-2031
- 15.1. Market Analysis, Insights and Forecast - By Country/Sub-region
- 15.1.1.
- 16. Competitive Analysis
- 16.1. Global Market Share Analysis 2024
- 16.2. Company Profiles
- 16.2.1 Alutop
- 16.2.1.1. Overview
- 16.2.1.2. Products
- 16.2.1.3. SWOT Analysis
- 16.2.1.4. Recent Developments
- 16.2.1.5. Financials (Based on Availability)
- 16.2.2 Easy Open Lid Industry Corp Yiwu
- 16.2.2.1. Overview
- 16.2.2.2. Products
- 16.2.2.3. SWOT Analysis
- 16.2.2.4. Recent Developments
- 16.2.2.5. Financials (Based on Availability)
- 16.2.3 Rauh GmbH & Co Blechwarenfabrikations-KG
- 16.2.3.1. Overview
- 16.2.3.2. Products
- 16.2.3.3. SWOT Analysis
- 16.2.3.4. Recent Developments
- 16.2.3.5. Financials (Based on Availability)
- 16.2.4 Herti JSC
- 16.2.4.1. Overview
- 16.2.4.2. Products
- 16.2.4.3. SWOT Analysis
- 16.2.4.4. Recent Developments
- 16.2.4.5. Financials (Based on Availability)
- 16.2.5 IDEA CAP SRL*List Not Exhaustive
- 16.2.5.1. Overview
- 16.2.5.2. Products
- 16.2.5.3. SWOT Analysis
- 16.2.5.4. Recent Developments
- 16.2.5.5. Financials (Based on Availability)
- 16.2.6 SKS Bottle & Packaging Inc
- 16.2.6.1. Overview
- 16.2.6.2. Products
- 16.2.6.3. SWOT Analysis
- 16.2.6.4. Recent Developments
- 16.2.6.5. Financials (Based on Availability)
- 16.2.7 Hicap Closures Co Ltd
- 16.2.7.1. Overview
- 16.2.7.2. Products
- 16.2.7.3. SWOT Analysis
- 16.2.7.4. Recent Developments
- 16.2.7.5. Financials (Based on Availability)
- 16.2.8 RPC Group (PET Power)
- 16.2.8.1. Overview
- 16.2.8.2. Products
- 16.2.8.3. SWOT Analysis
- 16.2.8.4. Recent Developments
- 16.2.8.5. Financials (Based on Availability)
- 16.2.9 Nippon Closures Co Ltd
- 16.2.9.1. Overview
- 16.2.9.2. Products
- 16.2.9.3. SWOT Analysis
- 16.2.9.4. Recent Developments
- 16.2.9.5. Financials (Based on Availability)
- 16.2.10 Amcor PLC
- 16.2.10.1. Overview
- 16.2.10.2. Products
- 16.2.10.3. SWOT Analysis
- 16.2.10.4. Recent Developments
- 16.2.10.5. Financials (Based on Availability)
- 16.2.11 Federfintech
- 16.2.11.1. Overview
- 16.2.11.2. Products
- 16.2.11.3. SWOT Analysis
- 16.2.11.4. Recent Developments
- 16.2.11.5. Financials (Based on Availability)
- 16.2.12 Pelliconi & C SpA
- 16.2.12.1. Overview
- 16.2.12.2. Products
- 16.2.12.3. SWOT Analysis
- 16.2.12.4. Recent Developments
- 16.2.12.5. Financials (Based on Availability)
- 16.2.13 Silgan Closures GmbH
- 16.2.13.1. Overview
- 16.2.13.2. Products
- 16.2.13.3. SWOT Analysis
- 16.2.13.4. Recent Developments
- 16.2.13.5. Financials (Based on Availability)
- 16.2.14 Guala Closures SpA
- 16.2.14.1. Overview
- 16.2.14.2. Products
- 16.2.14.3. SWOT Analysis
- 16.2.14.4. Recent Developments
- 16.2.14.5. Financials (Based on Availability)
- 16.2.15 Reynolds Packaging Group Ltd Closure Systems International Inc (CSI)
- 16.2.15.1. Overview
- 16.2.15.2. Products
- 16.2.15.3. SWOT Analysis
- 16.2.15.4. Recent Developments
- 16.2.15.5. Financials (Based on Availability)
- 16.2.16 O Berk Company
- 16.2.16.1. Overview
- 16.2.16.2. Products
- 16.2.16.3. SWOT Analysis
- 16.2.16.4. Recent Developments
- 16.2.16.5. Financials (Based on Availability)
- 16.2.17 Tecnocap Group
- 16.2.17.1. Overview
- 16.2.17.2. Products
- 16.2.17.3. SWOT Analysis
- 16.2.17.4. Recent Developments
- 16.2.17.5. Financials (Based on Availability)
- 16.2.18 Federfin Tech SRL
- 16.2.18.1. Overview
- 16.2.18.2. Products
- 16.2.18.3. SWOT Analysis
- 16.2.18.4. Recent Developments
- 16.2.18.5. Financials (Based on Availability)
- 16.2.19 The Cary Company
- 16.2.19.1. Overview
- 16.2.19.2. Products
- 16.2.19.3. SWOT Analysis
- 16.2.19.4. Recent Developments
- 16.2.19.5. Financials (Based on Availability)
- 16.2.20 Shadong Lipeng Co Ltd
- 16.2.20.1. Overview
- 16.2.20.2. Products
- 16.2.20.3. SWOT Analysis
- 16.2.20.4. Recent Developments
- 16.2.20.5. Financials (Based on Availability)
- 16.2.21 Berlin Packaging (Qorpak)
- 16.2.21.1. Overview
- 16.2.21.2. Products
- 16.2.21.3. SWOT Analysis
- 16.2.21.4. Recent Developments
- 16.2.21.5. Financials (Based on Availability)
- 16.2.1 Alutop
List of Figures
- Figure 1: Global Aluminum Caps and Closures Industry Revenue Breakdown (Million, %) by Region 2024 & 2032
- Figure 2: North America Aluminum Caps and Closures Industry Revenue (Million), by Country 2024 & 2032
- Figure 3: North America Aluminum Caps and Closures Industry Revenue Share (%), by Country 2024 & 2032
- Figure 4: Europe Aluminum Caps and Closures Industry Revenue (Million), by Country 2024 & 2032
- Figure 5: Europe Aluminum Caps and Closures Industry Revenue Share (%), by Country 2024 & 2032
- Figure 6: Asia Pacific Aluminum Caps and Closures Industry Revenue (Million), by Country 2024 & 2032
- Figure 7: Asia Pacific Aluminum Caps and Closures Industry Revenue Share (%), by Country 2024 & 2032
- Figure 8: Latin America Aluminum Caps and Closures Industry Revenue (Million), by Country 2024 & 2032
- Figure 9: Latin America Aluminum Caps and Closures Industry Revenue Share (%), by Country 2024 & 2032
- Figure 10: Middle East and Africa Aluminum Caps and Closures Industry Revenue (Million), by Country 2024 & 2032
- Figure 11: Middle East and Africa Aluminum Caps and Closures Industry Revenue Share (%), by Country 2024 & 2032
- Figure 12: North America Aluminum Caps and Closures Industry Revenue (Million), by Type 2024 & 2032
- Figure 13: North America Aluminum Caps and Closures Industry Revenue Share (%), by Type 2024 & 2032
- Figure 14: North America Aluminum Caps and Closures Industry Revenue (Million), by Application 2024 & 2032
- Figure 15: North America Aluminum Caps and Closures Industry Revenue Share (%), by Application 2024 & 2032
- Figure 16: North America Aluminum Caps and Closures Industry Revenue (Million), by Country 2024 & 2032
- Figure 17: North America Aluminum Caps and Closures Industry Revenue Share (%), by Country 2024 & 2032
- Figure 18: Europe Aluminum Caps and Closures Industry Revenue (Million), by Type 2024 & 2032
- Figure 19: Europe Aluminum Caps and Closures Industry Revenue Share (%), by Type 2024 & 2032
- Figure 20: Europe Aluminum Caps and Closures Industry Revenue (Million), by Application 2024 & 2032
- Figure 21: Europe Aluminum Caps and Closures Industry Revenue Share (%), by Application 2024 & 2032
- Figure 22: Europe Aluminum Caps and Closures Industry Revenue (Million), by Country 2024 & 2032
- Figure 23: Europe Aluminum Caps and Closures Industry Revenue Share (%), by Country 2024 & 2032
- Figure 24: Asia Pacific Aluminum Caps and Closures Industry Revenue (Million), by Type 2024 & 2032
- Figure 25: Asia Pacific Aluminum Caps and Closures Industry Revenue Share (%), by Type 2024 & 2032
- Figure 26: Asia Pacific Aluminum Caps and Closures Industry Revenue (Million), by Application 2024 & 2032
- Figure 27: Asia Pacific Aluminum Caps and Closures Industry Revenue Share (%), by Application 2024 & 2032
- Figure 28: Asia Pacific Aluminum Caps and Closures Industry Revenue (Million), by Country 2024 & 2032
- Figure 29: Asia Pacific Aluminum Caps and Closures Industry Revenue Share (%), by Country 2024 & 2032
- Figure 30: Latin America Aluminum Caps and Closures Industry Revenue (Million), by Type 2024 & 2032
- Figure 31: Latin America Aluminum Caps and Closures Industry Revenue Share (%), by Type 2024 & 2032
- Figure 32: Latin America Aluminum Caps and Closures Industry Revenue (Million), by Application 2024 & 2032
- Figure 33: Latin America Aluminum Caps and Closures Industry Revenue Share (%), by Application 2024 & 2032
- Figure 34: Latin America Aluminum Caps and Closures Industry Revenue (Million), by Country 2024 & 2032
- Figure 35: Latin America Aluminum Caps and Closures Industry Revenue Share (%), by Country 2024 & 2032
- Figure 36: Middle East and Africa Aluminum Caps and Closures Industry Revenue (Million), by Type 2024 & 2032
- Figure 37: Middle East and Africa Aluminum Caps and Closures Industry Revenue Share (%), by Type 2024 & 2032
- Figure 38: Middle East and Africa Aluminum Caps and Closures Industry Revenue (Million), by Application 2024 & 2032
- Figure 39: Middle East and Africa Aluminum Caps and Closures Industry Revenue Share (%), by Application 2024 & 2032
- Figure 40: Middle East and Africa Aluminum Caps and Closures Industry Revenue (Million), by Country 2024 & 2032
- Figure 41: Middle East and Africa Aluminum Caps and Closures Industry Revenue Share (%), by Country 2024 & 2032
List of Tables
- Table 1: Global Aluminum Caps and Closures Industry Revenue Million Forecast, by Region 2019 & 2032
- Table 2: Global Aluminum Caps and Closures Industry Revenue Million Forecast, by Type 2019 & 2032
- Table 3: Global Aluminum Caps and Closures Industry Revenue Million Forecast, by Application 2019 & 2032
- Table 4: Global Aluminum Caps and Closures Industry Revenue Million Forecast, by Region 2019 & 2032
- Table 5: Global Aluminum Caps and Closures Industry Revenue Million Forecast, by Country 2019 & 2032
- Table 6: Aluminum Caps and Closures Industry Revenue (Million) Forecast, by Application 2019 & 2032
- Table 7: Global Aluminum Caps and Closures Industry Revenue Million Forecast, by Country 2019 & 2032
- Table 8: Aluminum Caps and Closures Industry Revenue (Million) Forecast, by Application 2019 & 2032
- Table 9: Global Aluminum Caps and Closures Industry Revenue Million Forecast, by Country 2019 & 2032
- Table 10: Aluminum Caps and Closures Industry Revenue (Million) Forecast, by Application 2019 & 2032
- Table 11: Global Aluminum Caps and Closures Industry Revenue Million Forecast, by Country 2019 & 2032
- Table 12: Aluminum Caps and Closures Industry Revenue (Million) Forecast, by Application 2019 & 2032
- Table 13: Global Aluminum Caps and Closures Industry Revenue Million Forecast, by Country 2019 & 2032
- Table 14: Aluminum Caps and Closures Industry Revenue (Million) Forecast, by Application 2019 & 2032
- Table 15: Global Aluminum Caps and Closures Industry Revenue Million Forecast, by Type 2019 & 2032
- Table 16: Global Aluminum Caps and Closures Industry Revenue Million Forecast, by Application 2019 & 2032
- Table 17: Global Aluminum Caps and Closures Industry Revenue Million Forecast, by Country 2019 & 2032
- Table 18: Global Aluminum Caps and Closures Industry Revenue Million Forecast, by Type 2019 & 2032
- Table 19: Global Aluminum Caps and Closures Industry Revenue Million Forecast, by Application 2019 & 2032
- Table 20: Global Aluminum Caps and Closures Industry Revenue Million Forecast, by Country 2019 & 2032
- Table 21: Global Aluminum Caps and Closures Industry Revenue Million Forecast, by Type 2019 & 2032
- Table 22: Global Aluminum Caps and Closures Industry Revenue Million Forecast, by Application 2019 & 2032
- Table 23: Global Aluminum Caps and Closures Industry Revenue Million Forecast, by Country 2019 & 2032
- Table 24: Global Aluminum Caps and Closures Industry Revenue Million Forecast, by Type 2019 & 2032
- Table 25: Global Aluminum Caps and Closures Industry Revenue Million Forecast, by Application 2019 & 2032
- Table 26: Global Aluminum Caps and Closures Industry Revenue Million Forecast, by Country 2019 & 2032
- Table 27: Global Aluminum Caps and Closures Industry Revenue Million Forecast, by Type 2019 & 2032
- Table 28: Global Aluminum Caps and Closures Industry Revenue Million Forecast, by Application 2019 & 2032
- Table 29: Global Aluminum Caps and Closures Industry Revenue Million Forecast, by Country 2019 & 2032
Frequently Asked Questions
1. What is the projected Compound Annual Growth Rate (CAGR) of the Aluminum Caps and Closures Industry?
The projected CAGR is approximately 4.00%.
2. Which companies are prominent players in the Aluminum Caps and Closures Industry?
Key companies in the market include Alutop, Easy Open Lid Industry Corp Yiwu, Rauh GmbH & Co Blechwarenfabrikations-KG, Herti JSC, IDEA CAP SRL*List Not Exhaustive, SKS Bottle & Packaging Inc, Hicap Closures Co Ltd, RPC Group (PET Power), Nippon Closures Co Ltd, Amcor PLC, Federfintech, Pelliconi & C SpA, Silgan Closures GmbH, Guala Closures SpA, Reynolds Packaging Group Ltd Closure Systems International Inc (CSI), O Berk Company, Tecnocap Group, Federfin Tech SRL, The Cary Company, Shadong Lipeng Co Ltd, Berlin Packaging (Qorpak).
3. What are the main segments of the Aluminum Caps and Closures Industry?
The market segments include Type, Application.
4. Can you provide details about the market size?
The market size is estimated to be USD XX Million as of 2022.
5. What are some drivers contributing to market growth?
Recyclability of the Products; Superior Properties Compared to Other Closure Materials.
6. What are the notable trends driving market growth?
Pharmaceutical Sector is Expected to Witness the Highest Growth Rate.
7. Are there any restraints impacting market growth?
High Adoption Rate of Other Types of Closure Materials.
8. Can you provide examples of recent developments in the market?
April 2021 - Pelliconi launched a new e-shop that allows customers to purchase customizable online caps, even in small batches. Pelliconi also developed new technology and commercial strategy in digital printing metal caps and its sale through online digital channels.
9. What pricing options are available for accessing the report?
Pricing options include single-user, multi-user, and enterprise licenses priced at USD 4750, USD 5250, and USD 8750 respectively.
10. Is the market size provided in terms of value or volume?
The market size is provided in terms of value, measured in Million.
11. Are there any specific market keywords associated with the report?
Yes, the market keyword associated with the report is "Aluminum Caps and Closures Industry," which aids in identifying and referencing the specific market segment covered.
12. How do I determine which pricing option suits my needs best?
The pricing options vary based on user requirements and access needs. Individual users may opt for single-user licenses, while businesses requiring broader access may choose multi-user or enterprise licenses for cost-effective access to the report.
13. Are there any additional resources or data provided in the Aluminum Caps and Closures Industry report?
While the report offers comprehensive insights, it's advisable to review the specific contents or supplementary materials provided to ascertain if additional resources or data are available.
14. How can I stay updated on further developments or reports in the Aluminum Caps and Closures Industry?
To stay informed about further developments, trends, and reports in the Aluminum Caps and Closures Industry, consider subscribing to industry newsletters, following relevant companies and organizations, or regularly checking reputable industry news sources and publications.
Methodology
Step 1 - Identification of Relevant Samples Size from Population Database


Step 2 - Approaches for Defining Global Market Size (Value, Volume* & Price*)

Note*: In applicable scenarios
Step 3 - Data Sources
Primary Research
- Web Analytics
- Survey Reports
- Research Institute
- Latest Research Reports
- Opinion Leaders
Secondary Research
- Annual Reports
- White Paper
- Latest Press Release
- Industry Association
- Paid Database
- Investor Presentations

Step 4 - Data Triangulation
Involves using different sources of information in order to increase the validity of a study
These sources are likely to be stakeholders in a program - participants, other researchers, program staff, other community members, and so on.
Then we put all data in single framework & apply various statistical tools to find out the dynamic on the market.
During the analysis stage, feedback from the stakeholder groups would be compared to determine areas of agreement as well as areas of divergence
