

Key Insights
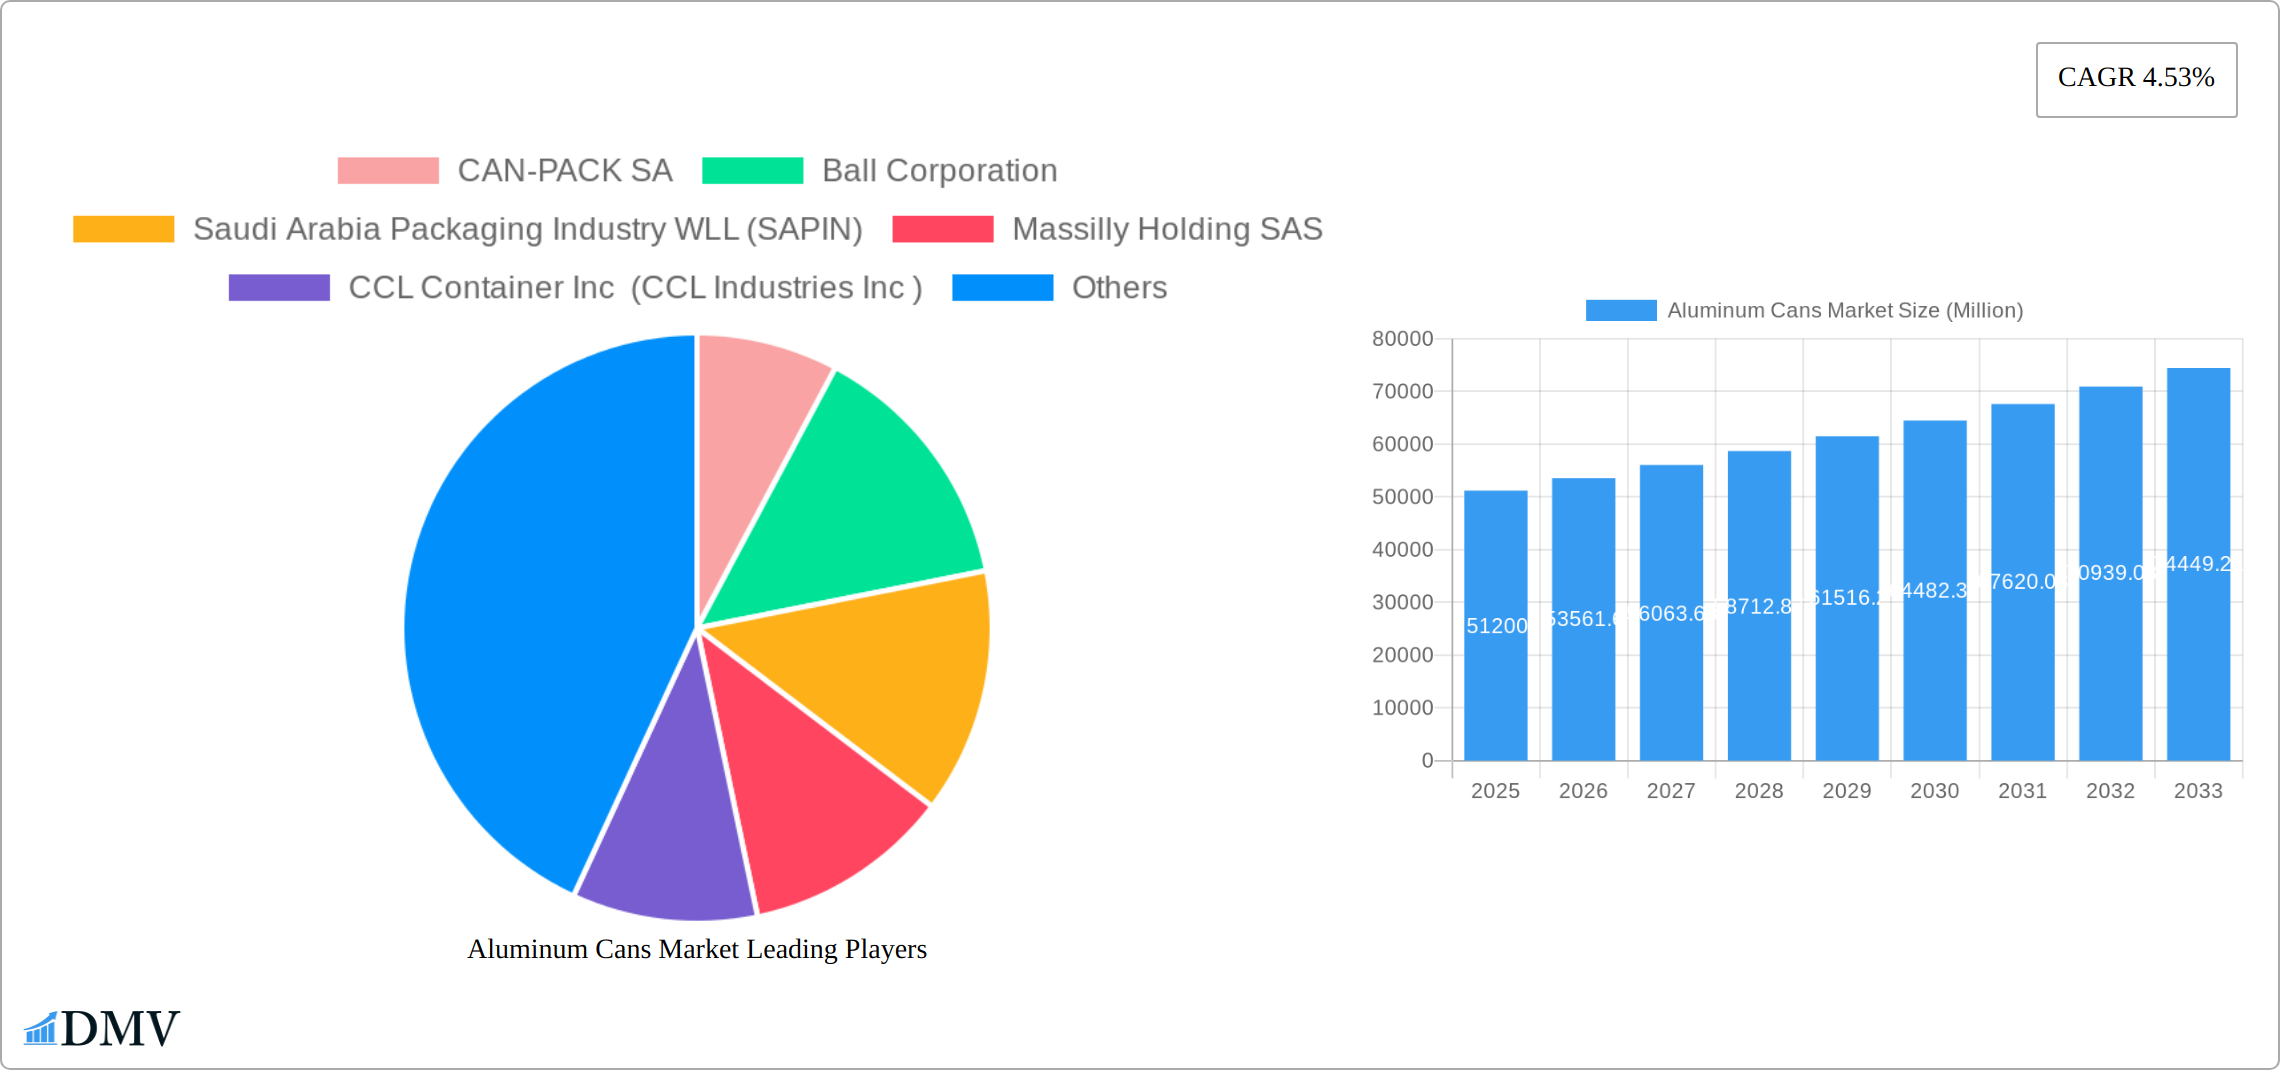
The global aluminum cans market, valued at $51.20 billion in 2025, is projected to experience robust growth, driven by a Compound Annual Growth Rate (CAGR) of 4.53% from 2025 to 2033. This expansion is fueled by several key factors. The increasing demand for convenient and lightweight packaging solutions across the beverage and food industries is a primary driver. The rising popularity of ready-to-drink beverages and single-serving portions further boosts market demand. Furthermore, the inherent recyclability of aluminum cans aligns with growing consumer preference for sustainable packaging options, contributing to market growth. Technological advancements in can manufacturing, leading to improved designs (slim, sleek, and other innovative formats) and enhanced production efficiency, also play a significant role. While the market faces challenges such as fluctuating aluminum prices and increasing competition from alternative packaging materials like plastic and glass, the overall positive outlook suggests a substantial market expansion throughout the forecast period. Regional variations exist, with North America and Asia Pacific expected to dominate the market due to established beverage industries and increasing consumption. The diversification of end-user industries, extending beyond traditional beverages to include aerosols and other food products, further contributes to the market's promising trajectory.
The competitive landscape is characterized by both established multinational corporations and regional players. Key players such as Ball Corporation, Crown Holdings Inc., and Ardagh Group are actively investing in research and development to innovate and maintain market share. Strategies including capacity expansions, mergers and acquisitions, and the introduction of eco-friendly products are commonly employed to enhance competitiveness. The continuous focus on sustainability, coupled with advancements in manufacturing techniques and a growing preference for convenient packaging, ensures a healthy outlook for the aluminum cans market. Future growth will largely depend on sustained economic growth in key regions, continued adoption of sustainable practices across industries, and further innovation in can design and functionality.
Aluminum Cans Market: A Comprehensive Report (2019-2033)
This insightful report provides a detailed analysis of the global Aluminum Cans Market, offering a comprehensive overview of market trends, competitive landscape, and future growth prospects from 2019 to 2033. The study covers key segments, including By Type (Slim, Sleek, Standard, Other Types) and By End-user Industry (Beverage, Food, Aerosol, Other End-user Industries), providing stakeholders with actionable insights for strategic decision-making. With a base year of 2025 and a forecast period extending to 2033, this report is an essential resource for understanding the dynamics of this vital industry. The market size is predicted to reach xx Million by 2033.
Aluminum Cans Market Composition & Trends
The Aluminum Cans Market exhibits a moderately consolidated structure, with key players like Ball Corporation and Crown Holdings Inc. holding significant market share. Market concentration is influenced by factors such as economies of scale in manufacturing and distribution. Innovation within the sector centers around sustainable materials, lightweight designs, and enhanced recyclability, driven by increasing environmental awareness and stringent regulations. The regulatory landscape varies across regions, impacting material sourcing, manufacturing processes, and waste management strategies. Substitute products, such as glass bottles and plastic containers, compete based on cost, functionality, and perceived environmental impact. End-user profiles are diverse, spanning the beverage, food, and aerosol industries, each with unique demands for can specifications and functionality. M&A activity has been significant, with deal values averaging xx Million in recent years, reflecting industry consolidation and strategic expansion.
- Market Share Distribution (2024): Ball Corporation (xx%), Crown Holdings Inc. (xx%), Ardagh Group S A (xx%), others (xx%). These figures are estimates based on publicly available data and market analysis.
- Recent M&A Activity: While precise deal values for all transactions are not publicly accessible, significant mergers and acquisitions have reshaped the competitive landscape, particularly in the past five years.

Aluminum Cans Market Industry Evolution
The Aluminum Cans Market has experienced consistent growth over the historical period (2019-2024), driven primarily by increasing demand from the beverage industry, particularly for carbonated soft drinks and alcoholic beverages. Technological advancements in can manufacturing have led to lighter, more durable, and aesthetically appealing designs. The adoption rate of innovative can coatings and printing technologies continues to rise, catering to diverse branding and marketing strategies. Shifting consumer preferences towards convenience and sustainability have further fueled market expansion. The market is expected to maintain a robust growth trajectory (xx% CAGR) during the forecast period (2025-2033), propelled by factors such as the rising global population, changing consumption patterns, and increased investments in recycling infrastructure. The adoption of advanced manufacturing techniques and sustainable packaging solutions is expected to further accelerate market expansion.
Leading Regions, Countries, or Segments in Aluminum Cans Market
The North American region currently dominates the Aluminum Cans Market, driven by high per capita consumption of beverages and advanced recycling infrastructure. Within this region, the United States accounts for the largest market share. The beverage segment remains the largest end-use industry, accounting for a significant percentage of total market volume.
- Key Drivers for North American Dominance:
- Strong consumer demand for canned beverages.
- Well-established recycling programs.
- Robust manufacturing infrastructure.
- Significant investments in research and development.
- By Type: The standard can segment holds the largest share, although the demand for slim and sleek cans is rising owing to their aesthetic appeal and space efficiency.
- By End-user Industry: The beverage industry holds the leading position, with growth fuelled by the popularity of ready-to-drink beverages.
Aluminum Cans Market Product Innovations
Recent product innovations focus on enhancing sustainability, recyclability, and consumer experience. This includes the introduction of lightweight aluminum alloys, improved printing techniques for enhanced brand visibility, and innovative can designs to cater to changing consumer preferences. Furthermore, advancements in can coatings improve product shelf life and prevent degradation. Unique selling propositions include enhanced recyclability, reduced environmental impact, and customizable designs.
Propelling Factors for Aluminum Cans Market Growth
Several factors contribute to the growth of the Aluminum Cans Market. Technological advancements in can manufacturing lead to cost-effective and efficient production. Strong economic growth in emerging markets drives increased consumer spending and consumption. Government regulations promoting recycling and sustainable packaging further stimulate market expansion. For instance, the EU's Single-Use Plastics Directive is driving the adoption of more sustainable packaging options.
Obstacles in the Aluminum Cans Market
The Aluminum Cans Market faces several challenges, including fluctuating aluminum prices impacting production costs. Supply chain disruptions can cause delays and affect production volumes. Intense competition among major players exerts pressure on profit margins. Stringent environmental regulations can increase compliance costs.
Future Opportunities in Aluminum Cans Market
Emerging markets present significant growth potential. The development of lightweight and high-performance aluminum alloys creates cost-saving opportunities. Innovations in can design and functionality cater to specialized market needs. Growing consumer awareness of sustainable packaging solutions strengthens market demand.
Major Players in the Aluminum Cans Market Ecosystem
- CAN-PACK SA
- Ball Corporation
- Saudi Arabia Packaging Industry WLL (SAPIN)
- Massilly Holding SAS
- CCL Container Inc (CCL Industries Inc)
- Crown Holdings Inc
- CPMC HOLDINGS Limited (COFCO Group)
- Ardagh Group S A
- Silgan Holdings Inc
- Tecnocap Group
Key Developments in Aluminum Cans Market Industry
- December 2023: Crown Holdings announced their investment in AI-powered recycling technology to increase aluminum can recycling rates by over 1 Million cans annually.
- February 2024: Emirates Global Aluminium (EGA) partnered with Crown and CAN-PACK to launch the "Every Can Counts" recycling campaign in the UAE, promoting circular economy principles.
Strategic Aluminum Cans Market Forecast
The Aluminum Cans Market is poised for continued growth, fueled by rising consumer demand, technological advancements, and a growing focus on sustainability. The market’s potential is significant, particularly in developing economies experiencing rising incomes and increased consumption of packaged goods. Further innovation in materials science, recycling technologies, and packaging design will continue to drive market expansion and shape the competitive landscape in the coming years.
Aluminum Cans Market Segmentation
-
1. Type
- 1.1. Slim
- 1.2. Sleek
- 1.3. Standard
- 1.4. Other Types
-
2. End-user Industry
- 2.1. Beverage
- 2.2. Food
- 2.3. Aerosol
- 2.4. Other End-user Industries
Aluminum Cans Market Segmentation By Geography
-
1. North America
- 1.1. United States
- 1.2. Canada
-
2. Europe
- 2.1. United Kingdom
- 2.2. Germany
- 2.3. France
- 2.4. Spain
- 2.5. Rest of Europe
-
3. Asia Pacific
- 3.1. China
- 3.2. India
- 3.3. Japan
- 3.4. South Korea
- 3.5. Thailand
- 3.6. Rest of Asia Pacific
-
4. Latin America
- 4.1. Brazil
- 4.2. Mexico
- 4.3. Rest of Latin America
-
5. Middle East and Africa
- 5.1. United Arab Emirates
- 5.2. Saudi Arabia
- 5.3. South Africa
- 5.4. Rest of Middle East

Aluminum Cans Market REPORT HIGHLIGHTS
| Aspects | Details |
|---|---|
| Study Period | 2019-2033 |
| Base Year | 2024 |
| Estimated Year | 2025 |
| Forecast Period | 2025-2033 |
| Historical Period | 2019-2024 |
| Growth Rate | CAGR of 4.53% from 2019-2033 |
| Segmentation |
|
Table of Contents
- 1. Introduction
- 1.1. Research Scope
- 1.2. Market Segmentation
- 1.3. Research Methodology
- 1.4. Definitions and Assumptions
- 2. Executive Summary
- 2.1. Introduction
- 3. Market Dynamics
- 3.1. Introduction
- 3.2. Market Drivers
- 3.2.1. High Recyclability Rates of Aluminum Cans; Increasing Demand for Canned Foods driven by Cost and Convenience-related Advantages
- 3.3. Market Restrains
- 3.3.1. Availability of Alternative Packaging Solutions
- 3.4. Market Trends
- 3.4.1. Food and Beverages Segment to Drive the Market
- 4. Market Factor Analysis
- 4.1. Porters Five Forces
- 4.2. Supply/Value Chain
- 4.3. PESTEL analysis
- 4.4. Market Entropy
- 4.5. Patent/Trademark Analysis
- 5. Global Aluminum Cans Market Analysis, Insights and Forecast, 2019-2031
- 5.1. Market Analysis, Insights and Forecast - by Type
- 5.1.1. Slim
- 5.1.2. Sleek
- 5.1.3. Standard
- 5.1.4. Other Types
- 5.2. Market Analysis, Insights and Forecast - by End-user Industry
- 5.2.1. Beverage
- 5.2.2. Food
- 5.2.3. Aerosol
- 5.2.4. Other End-user Industries
- 5.3. Market Analysis, Insights and Forecast - by Region
- 5.3.1. North America
- 5.3.2. Europe
- 5.3.3. Asia Pacific
- 5.3.4. Latin America
- 5.3.5. Middle East and Africa
- 5.1. Market Analysis, Insights and Forecast - by Type
- 6. North America Aluminum Cans Market Analysis, Insights and Forecast, 2019-2031
- 6.1. Market Analysis, Insights and Forecast - by Type
- 6.1.1. Slim
- 6.1.2. Sleek
- 6.1.3. Standard
- 6.1.4. Other Types
- 6.2. Market Analysis, Insights and Forecast - by End-user Industry
- 6.2.1. Beverage
- 6.2.2. Food
- 6.2.3. Aerosol
- 6.2.4. Other End-user Industries
- 6.1. Market Analysis, Insights and Forecast - by Type
- 7. Europe Aluminum Cans Market Analysis, Insights and Forecast, 2019-2031
- 7.1. Market Analysis, Insights and Forecast - by Type
- 7.1.1. Slim
- 7.1.2. Sleek
- 7.1.3. Standard
- 7.1.4. Other Types
- 7.2. Market Analysis, Insights and Forecast - by End-user Industry
- 7.2.1. Beverage
- 7.2.2. Food
- 7.2.3. Aerosol
- 7.2.4. Other End-user Industries
- 7.1. Market Analysis, Insights and Forecast - by Type
- 8. Asia Pacific Aluminum Cans Market Analysis, Insights and Forecast, 2019-2031
- 8.1. Market Analysis, Insights and Forecast - by Type
- 8.1.1. Slim
- 8.1.2. Sleek
- 8.1.3. Standard
- 8.1.4. Other Types
- 8.2. Market Analysis, Insights and Forecast - by End-user Industry
- 8.2.1. Beverage
- 8.2.2. Food
- 8.2.3. Aerosol
- 8.2.4. Other End-user Industries
- 8.1. Market Analysis, Insights and Forecast - by Type
- 9. Latin America Aluminum Cans Market Analysis, Insights and Forecast, 2019-2031
- 9.1. Market Analysis, Insights and Forecast - by Type
- 9.1.1. Slim
- 9.1.2. Sleek
- 9.1.3. Standard
- 9.1.4. Other Types
- 9.2. Market Analysis, Insights and Forecast - by End-user Industry
- 9.2.1. Beverage
- 9.2.2. Food
- 9.2.3. Aerosol
- 9.2.4. Other End-user Industries
- 9.1. Market Analysis, Insights and Forecast - by Type
- 10. Middle East and Africa Aluminum Cans Market Analysis, Insights and Forecast, 2019-2031
- 10.1. Market Analysis, Insights and Forecast - by Type
- 10.1.1. Slim
- 10.1.2. Sleek
- 10.1.3. Standard
- 10.1.4. Other Types
- 10.2. Market Analysis, Insights and Forecast - by End-user Industry
- 10.2.1. Beverage
- 10.2.2. Food
- 10.2.3. Aerosol
- 10.2.4. Other End-user Industries
- 10.1. Market Analysis, Insights and Forecast - by Type
- 11. North America Aluminum Cans Market Analysis, Insights and Forecast, 2019-2031
- 11.1. Market Analysis, Insights and Forecast - By Country/Sub-region
- 11.1.1 United States
- 11.1.2 Canada
- 12. Europe Aluminum Cans Market Analysis, Insights and Forecast, 2019-2031
- 12.1. Market Analysis, Insights and Forecast - By Country/Sub-region
- 12.1.1 United Kingdom
- 12.1.2 Germany
- 12.1.3 France
- 12.1.4 Spain
- 12.1.5 Rest of Europe
- 13. Asia Pacific Aluminum Cans Market Analysis, Insights and Forecast, 2019-2031
- 13.1. Market Analysis, Insights and Forecast - By Country/Sub-region
- 13.1.1 China
- 13.1.2 India
- 13.1.3 Japan
- 13.1.4 South Korea
- 13.1.5 Thailand
- 13.1.6 Rest of Asia Pacific
- 14. Latin America Aluminum Cans Market Analysis, Insights and Forecast, 2019-2031
- 14.1. Market Analysis, Insights and Forecast - By Country/Sub-region
- 14.1.1 Brazil
- 14.1.2 Mexico
- 14.1.3 Rest of Latin America
- 15. Middle East and Africa Aluminum Cans Market Analysis, Insights and Forecast, 2019-2031
- 15.1. Market Analysis, Insights and Forecast - By Country/Sub-region
- 15.1.1 United Arab Emirates
- 15.1.2 Saudi Arabia
- 15.1.3 South Africa
- 15.1.4 Rest of Middle East
- 16. Competitive Analysis
- 16.1. Global Market Share Analysis 2024
- 16.2. Company Profiles
- 16.2.1 CAN-PACK SA
- 16.2.1.1. Overview
- 16.2.1.2. Products
- 16.2.1.3. SWOT Analysis
- 16.2.1.4. Recent Developments
- 16.2.1.5. Financials (Based on Availability)
- 16.2.2 Ball Corporation
- 16.2.2.1. Overview
- 16.2.2.2. Products
- 16.2.2.3. SWOT Analysis
- 16.2.2.4. Recent Developments
- 16.2.2.5. Financials (Based on Availability)
- 16.2.3 Saudi Arabia Packaging Industry WLL (SAPIN)
- 16.2.3.1. Overview
- 16.2.3.2. Products
- 16.2.3.3. SWOT Analysis
- 16.2.3.4. Recent Developments
- 16.2.3.5. Financials (Based on Availability)
- 16.2.4 Massilly Holding SAS
- 16.2.4.1. Overview
- 16.2.4.2. Products
- 16.2.4.3. SWOT Analysis
- 16.2.4.4. Recent Developments
- 16.2.4.5. Financials (Based on Availability)
- 16.2.5 CCL Container Inc (CCL Industries Inc )
- 16.2.5.1. Overview
- 16.2.5.2. Products
- 16.2.5.3. SWOT Analysis
- 16.2.5.4. Recent Developments
- 16.2.5.5. Financials (Based on Availability)
- 16.2.6 Crown Holdings Inc
- 16.2.6.1. Overview
- 16.2.6.2. Products
- 16.2.6.3. SWOT Analysis
- 16.2.6.4. Recent Developments
- 16.2.6.5. Financials (Based on Availability)
- 16.2.7 CPMC HOLDINGS Limited (COFCO Group
- 16.2.7.1. Overview
- 16.2.7.2. Products
- 16.2.7.3. SWOT Analysis
- 16.2.7.4. Recent Developments
- 16.2.7.5. Financials (Based on Availability)
- 16.2.8 Ardagh Group S A
- 16.2.8.1. Overview
- 16.2.8.2. Products
- 16.2.8.3. SWOT Analysis
- 16.2.8.4. Recent Developments
- 16.2.8.5. Financials (Based on Availability)
- 16.2.9 Silgan Holdings Inc
- 16.2.9.1. Overview
- 16.2.9.2. Products
- 16.2.9.3. SWOT Analysis
- 16.2.9.4. Recent Developments
- 16.2.9.5. Financials (Based on Availability)
- 16.2.10 Tecnocap Group
- 16.2.10.1. Overview
- 16.2.10.2. Products
- 16.2.10.3. SWOT Analysis
- 16.2.10.4. Recent Developments
- 16.2.10.5. Financials (Based on Availability)
- 16.2.1 CAN-PACK SA
List of Figures
- Figure 1: Global Aluminum Cans Market Revenue Breakdown (Million, %) by Region 2024 & 2032
- Figure 2: North America Aluminum Cans Market Revenue (Million), by Country 2024 & 2032
- Figure 3: North America Aluminum Cans Market Revenue Share (%), by Country 2024 & 2032
- Figure 4: Europe Aluminum Cans Market Revenue (Million), by Country 2024 & 2032
- Figure 5: Europe Aluminum Cans Market Revenue Share (%), by Country 2024 & 2032
- Figure 6: Asia Pacific Aluminum Cans Market Revenue (Million), by Country 2024 & 2032
- Figure 7: Asia Pacific Aluminum Cans Market Revenue Share (%), by Country 2024 & 2032
- Figure 8: Latin America Aluminum Cans Market Revenue (Million), by Country 2024 & 2032
- Figure 9: Latin America Aluminum Cans Market Revenue Share (%), by Country 2024 & 2032
- Figure 10: Middle East and Africa Aluminum Cans Market Revenue (Million), by Country 2024 & 2032
- Figure 11: Middle East and Africa Aluminum Cans Market Revenue Share (%), by Country 2024 & 2032
- Figure 12: North America Aluminum Cans Market Revenue (Million), by Type 2024 & 2032
- Figure 13: North America Aluminum Cans Market Revenue Share (%), by Type 2024 & 2032
- Figure 14: North America Aluminum Cans Market Revenue (Million), by End-user Industry 2024 & 2032
- Figure 15: North America Aluminum Cans Market Revenue Share (%), by End-user Industry 2024 & 2032
- Figure 16: North America Aluminum Cans Market Revenue (Million), by Country 2024 & 2032
- Figure 17: North America Aluminum Cans Market Revenue Share (%), by Country 2024 & 2032
- Figure 18: Europe Aluminum Cans Market Revenue (Million), by Type 2024 & 2032
- Figure 19: Europe Aluminum Cans Market Revenue Share (%), by Type 2024 & 2032
- Figure 20: Europe Aluminum Cans Market Revenue (Million), by End-user Industry 2024 & 2032
- Figure 21: Europe Aluminum Cans Market Revenue Share (%), by End-user Industry 2024 & 2032
- Figure 22: Europe Aluminum Cans Market Revenue (Million), by Country 2024 & 2032
- Figure 23: Europe Aluminum Cans Market Revenue Share (%), by Country 2024 & 2032
- Figure 24: Asia Pacific Aluminum Cans Market Revenue (Million), by Type 2024 & 2032
- Figure 25: Asia Pacific Aluminum Cans Market Revenue Share (%), by Type 2024 & 2032
- Figure 26: Asia Pacific Aluminum Cans Market Revenue (Million), by End-user Industry 2024 & 2032
- Figure 27: Asia Pacific Aluminum Cans Market Revenue Share (%), by End-user Industry 2024 & 2032
- Figure 28: Asia Pacific Aluminum Cans Market Revenue (Million), by Country 2024 & 2032
- Figure 29: Asia Pacific Aluminum Cans Market Revenue Share (%), by Country 2024 & 2032
- Figure 30: Latin America Aluminum Cans Market Revenue (Million), by Type 2024 & 2032
- Figure 31: Latin America Aluminum Cans Market Revenue Share (%), by Type 2024 & 2032
- Figure 32: Latin America Aluminum Cans Market Revenue (Million), by End-user Industry 2024 & 2032
- Figure 33: Latin America Aluminum Cans Market Revenue Share (%), by End-user Industry 2024 & 2032
- Figure 34: Latin America Aluminum Cans Market Revenue (Million), by Country 2024 & 2032
- Figure 35: Latin America Aluminum Cans Market Revenue Share (%), by Country 2024 & 2032
- Figure 36: Middle East and Africa Aluminum Cans Market Revenue (Million), by Type 2024 & 2032
- Figure 37: Middle East and Africa Aluminum Cans Market Revenue Share (%), by Type 2024 & 2032
- Figure 38: Middle East and Africa Aluminum Cans Market Revenue (Million), by End-user Industry 2024 & 2032
- Figure 39: Middle East and Africa Aluminum Cans Market Revenue Share (%), by End-user Industry 2024 & 2032
- Figure 40: Middle East and Africa Aluminum Cans Market Revenue (Million), by Country 2024 & 2032
- Figure 41: Middle East and Africa Aluminum Cans Market Revenue Share (%), by Country 2024 & 2032
List of Tables
- Table 1: Global Aluminum Cans Market Revenue Million Forecast, by Region 2019 & 2032
- Table 2: Global Aluminum Cans Market Revenue Million Forecast, by Type 2019 & 2032
- Table 3: Global Aluminum Cans Market Revenue Million Forecast, by End-user Industry 2019 & 2032
- Table 4: Global Aluminum Cans Market Revenue Million Forecast, by Region 2019 & 2032
- Table 5: Global Aluminum Cans Market Revenue Million Forecast, by Country 2019 & 2032
- Table 6: United States Aluminum Cans Market Revenue (Million) Forecast, by Application 2019 & 2032
- Table 7: Canada Aluminum Cans Market Revenue (Million) Forecast, by Application 2019 & 2032
- Table 8: Global Aluminum Cans Market Revenue Million Forecast, by Country 2019 & 2032
- Table 9: United Kingdom Aluminum Cans Market Revenue (Million) Forecast, by Application 2019 & 2032
- Table 10: Germany Aluminum Cans Market Revenue (Million) Forecast, by Application 2019 & 2032
- Table 11: France Aluminum Cans Market Revenue (Million) Forecast, by Application 2019 & 2032
- Table 12: Spain Aluminum Cans Market Revenue (Million) Forecast, by Application 2019 & 2032
- Table 13: Rest of Europe Aluminum Cans Market Revenue (Million) Forecast, by Application 2019 & 2032
- Table 14: Global Aluminum Cans Market Revenue Million Forecast, by Country 2019 & 2032
- Table 15: China Aluminum Cans Market Revenue (Million) Forecast, by Application 2019 & 2032
- Table 16: India Aluminum Cans Market Revenue (Million) Forecast, by Application 2019 & 2032
- Table 17: Japan Aluminum Cans Market Revenue (Million) Forecast, by Application 2019 & 2032
- Table 18: South Korea Aluminum Cans Market Revenue (Million) Forecast, by Application 2019 & 2032
- Table 19: Thailand Aluminum Cans Market Revenue (Million) Forecast, by Application 2019 & 2032
- Table 20: Rest of Asia Pacific Aluminum Cans Market Revenue (Million) Forecast, by Application 2019 & 2032
- Table 21: Global Aluminum Cans Market Revenue Million Forecast, by Country 2019 & 2032
- Table 22: Brazil Aluminum Cans Market Revenue (Million) Forecast, by Application 2019 & 2032
- Table 23: Mexico Aluminum Cans Market Revenue (Million) Forecast, by Application 2019 & 2032
- Table 24: Rest of Latin America Aluminum Cans Market Revenue (Million) Forecast, by Application 2019 & 2032
- Table 25: Global Aluminum Cans Market Revenue Million Forecast, by Country 2019 & 2032
- Table 26: United Arab Emirates Aluminum Cans Market Revenue (Million) Forecast, by Application 2019 & 2032
- Table 27: Saudi Arabia Aluminum Cans Market Revenue (Million) Forecast, by Application 2019 & 2032
- Table 28: South Africa Aluminum Cans Market Revenue (Million) Forecast, by Application 2019 & 2032
- Table 29: Rest of Middle East Aluminum Cans Market Revenue (Million) Forecast, by Application 2019 & 2032
- Table 30: Global Aluminum Cans Market Revenue Million Forecast, by Type 2019 & 2032
- Table 31: Global Aluminum Cans Market Revenue Million Forecast, by End-user Industry 2019 & 2032
- Table 32: Global Aluminum Cans Market Revenue Million Forecast, by Country 2019 & 2032
- Table 33: United States Aluminum Cans Market Revenue (Million) Forecast, by Application 2019 & 2032
- Table 34: Canada Aluminum Cans Market Revenue (Million) Forecast, by Application 2019 & 2032
- Table 35: Global Aluminum Cans Market Revenue Million Forecast, by Type 2019 & 2032
- Table 36: Global Aluminum Cans Market Revenue Million Forecast, by End-user Industry 2019 & 2032
- Table 37: Global Aluminum Cans Market Revenue Million Forecast, by Country 2019 & 2032
- Table 38: United Kingdom Aluminum Cans Market Revenue (Million) Forecast, by Application 2019 & 2032
- Table 39: Germany Aluminum Cans Market Revenue (Million) Forecast, by Application 2019 & 2032
- Table 40: France Aluminum Cans Market Revenue (Million) Forecast, by Application 2019 & 2032
- Table 41: Spain Aluminum Cans Market Revenue (Million) Forecast, by Application 2019 & 2032
- Table 42: Rest of Europe Aluminum Cans Market Revenue (Million) Forecast, by Application 2019 & 2032
- Table 43: Global Aluminum Cans Market Revenue Million Forecast, by Type 2019 & 2032
- Table 44: Global Aluminum Cans Market Revenue Million Forecast, by End-user Industry 2019 & 2032
- Table 45: Global Aluminum Cans Market Revenue Million Forecast, by Country 2019 & 2032
- Table 46: China Aluminum Cans Market Revenue (Million) Forecast, by Application 2019 & 2032
- Table 47: India Aluminum Cans Market Revenue (Million) Forecast, by Application 2019 & 2032
- Table 48: Japan Aluminum Cans Market Revenue (Million) Forecast, by Application 2019 & 2032
- Table 49: South Korea Aluminum Cans Market Revenue (Million) Forecast, by Application 2019 & 2032
- Table 50: Thailand Aluminum Cans Market Revenue (Million) Forecast, by Application 2019 & 2032
- Table 51: Rest of Asia Pacific Aluminum Cans Market Revenue (Million) Forecast, by Application 2019 & 2032
- Table 52: Global Aluminum Cans Market Revenue Million Forecast, by Type 2019 & 2032
- Table 53: Global Aluminum Cans Market Revenue Million Forecast, by End-user Industry 2019 & 2032
- Table 54: Global Aluminum Cans Market Revenue Million Forecast, by Country 2019 & 2032
- Table 55: Brazil Aluminum Cans Market Revenue (Million) Forecast, by Application 2019 & 2032
- Table 56: Mexico Aluminum Cans Market Revenue (Million) Forecast, by Application 2019 & 2032
- Table 57: Rest of Latin America Aluminum Cans Market Revenue (Million) Forecast, by Application 2019 & 2032
- Table 58: Global Aluminum Cans Market Revenue Million Forecast, by Type 2019 & 2032
- Table 59: Global Aluminum Cans Market Revenue Million Forecast, by End-user Industry 2019 & 2032
- Table 60: Global Aluminum Cans Market Revenue Million Forecast, by Country 2019 & 2032
- Table 61: United Arab Emirates Aluminum Cans Market Revenue (Million) Forecast, by Application 2019 & 2032
- Table 62: Saudi Arabia Aluminum Cans Market Revenue (Million) Forecast, by Application 2019 & 2032
- Table 63: South Africa Aluminum Cans Market Revenue (Million) Forecast, by Application 2019 & 2032
- Table 64: Rest of Middle East Aluminum Cans Market Revenue (Million) Forecast, by Application 2019 & 2032
Frequently Asked Questions
1. What is the projected Compound Annual Growth Rate (CAGR) of the Aluminum Cans Market?
The projected CAGR is approximately 4.53%.
2. Which companies are prominent players in the Aluminum Cans Market?
Key companies in the market include CAN-PACK SA, Ball Corporation, Saudi Arabia Packaging Industry WLL (SAPIN), Massilly Holding SAS, CCL Container Inc (CCL Industries Inc ), Crown Holdings Inc, CPMC HOLDINGS Limited (COFCO Group, Ardagh Group S A, Silgan Holdings Inc, Tecnocap Group.
3. What are the main segments of the Aluminum Cans Market?
The market segments include Type, End-user Industry.
4. Can you provide details about the market size?
The market size is estimated to be USD 51.20 Million as of 2022.
5. What are some drivers contributing to market growth?
High Recyclability Rates of Aluminum Cans; Increasing Demand for Canned Foods driven by Cost and Convenience-related Advantages.
6. What are the notable trends driving market growth?
Food and Beverages Segment to Drive the Market.
7. Are there any restraints impacting market growth?
Availability of Alternative Packaging Solutions.
8. Can you provide examples of recent developments in the market?
February 2024 - Emirates Global Aluminium (EGA), the leading aluminum giant in the UAE, has partnered with beverage can manufacturers Crown and CANPACK to launch "Every Can Counts," an innovative campaign aimed at promoting the recycling of used aluminum drink cans. This initiative, introduced during COP28, represents a crucial step towards fostering a circular economy in the United Arab Emirates.
9. What pricing options are available for accessing the report?
Pricing options include single-user, multi-user, and enterprise licenses priced at USD 4750, USD 5250, and USD 8750 respectively.
10. Is the market size provided in terms of value or volume?
The market size is provided in terms of value, measured in Million.
11. Are there any specific market keywords associated with the report?
Yes, the market keyword associated with the report is "Aluminum Cans Market," which aids in identifying and referencing the specific market segment covered.
12. How do I determine which pricing option suits my needs best?
The pricing options vary based on user requirements and access needs. Individual users may opt for single-user licenses, while businesses requiring broader access may choose multi-user or enterprise licenses for cost-effective access to the report.
13. Are there any additional resources or data provided in the Aluminum Cans Market report?
While the report offers comprehensive insights, it's advisable to review the specific contents or supplementary materials provided to ascertain if additional resources or data are available.
14. How can I stay updated on further developments or reports in the Aluminum Cans Market?
To stay informed about further developments, trends, and reports in the Aluminum Cans Market, consider subscribing to industry newsletters, following relevant companies and organizations, or regularly checking reputable industry news sources and publications.
Methodology
Step 1 - Identification of Relevant Samples Size from Population Database


Step 2 - Approaches for Defining Global Market Size (Value, Volume* & Price*)

Note*: In applicable scenarios
Step 3 - Data Sources
Primary Research
- Web Analytics
- Survey Reports
- Research Institute
- Latest Research Reports
- Opinion Leaders
Secondary Research
- Annual Reports
- White Paper
- Latest Press Release
- Industry Association
- Paid Database
- Investor Presentations

Step 4 - Data Triangulation
Involves using different sources of information in order to increase the validity of a study
These sources are likely to be stakeholders in a program - participants, other researchers, program staff, other community members, and so on.
Then we put all data in single framework & apply various statistical tools to find out the dynamic on the market.
During the analysis stage, feedback from the stakeholder groups would be compared to determine areas of agreement as well as areas of divergence
