

Key Insights
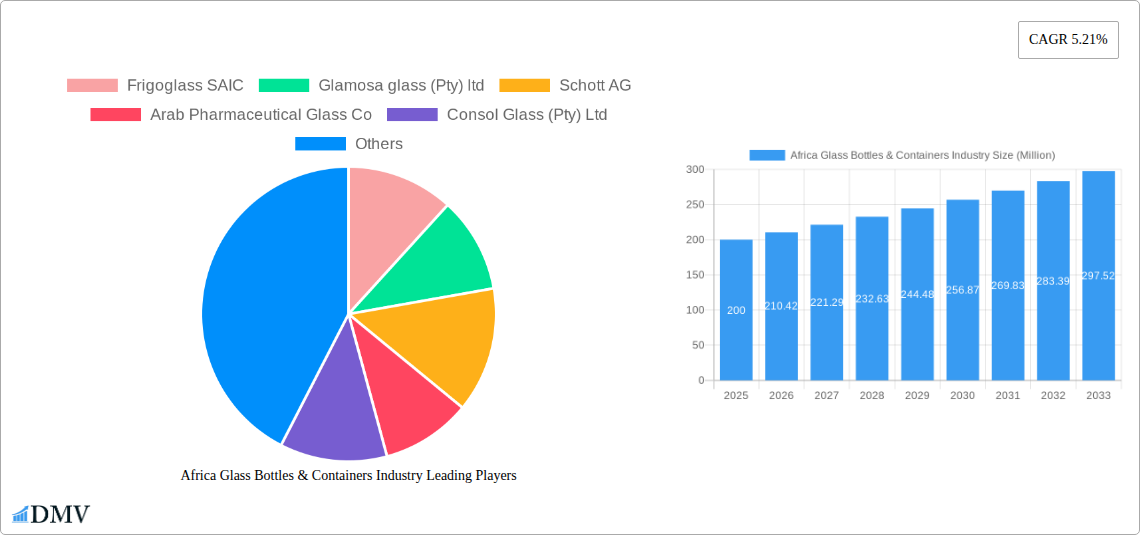
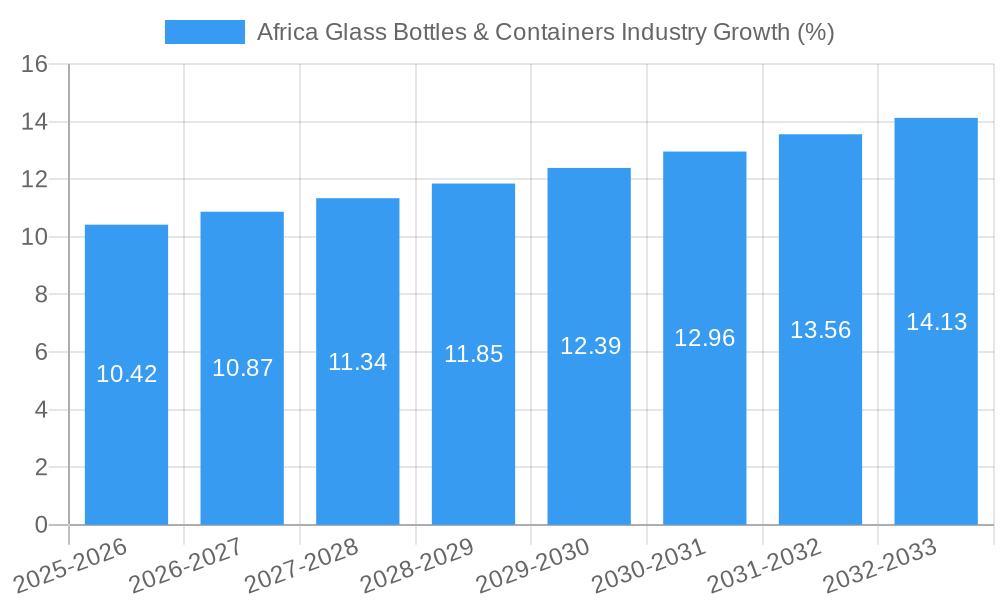
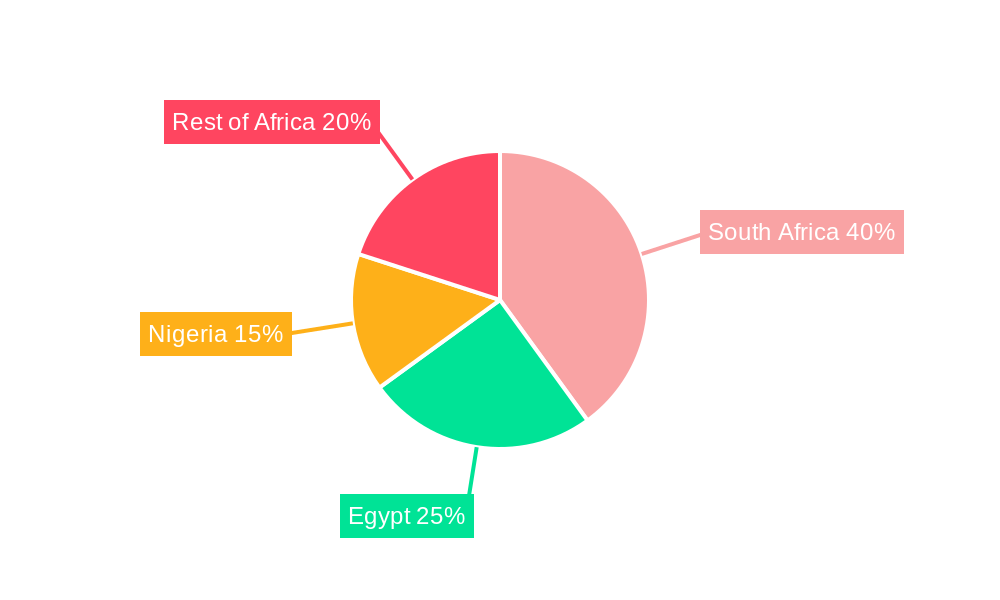
The African glass bottles and containers market, valued at approximately $XX million in 2025, is projected to experience robust growth, exhibiting a compound annual growth rate (CAGR) of 5.21% from 2025 to 2033. This expansion is fueled by several key drivers. The burgeoning food and beverage sector across Africa, particularly in countries like Egypt, Nigeria, and South Africa, is a significant contributor, demanding increased packaging solutions. Growth in the pharmaceutical and cosmetics industries further stimulates demand. Furthermore, evolving consumer preferences towards premium packaging and the increasing adoption of glass as a sustainable and recyclable material are contributing to market growth. South Africa currently holds the largest market share within the region, driven by its advanced infrastructure and established manufacturing base. However, significant untapped potential exists across other African nations, presenting lucrative opportunities for market entrants. Challenges include the fluctuating cost of raw materials (like silica sand and soda ash), potential energy price volatility impacting production costs, and the need for further infrastructural development in certain regions to support efficient logistics and distribution networks. Despite these restraints, the long-term outlook for the African glass bottles and containers market remains positive, driven by sustained economic growth and a growing middle class with rising disposable incomes across the continent.
The market segmentation reveals a diverse landscape. Beverages represent a major end-user industry, followed by the combined food, cosmetics, and pharmaceutical sectors. The “other end-user industries” segment holds potential for growth as new applications for glass packaging emerge. Geographically, South Africa, Egypt, and Nigeria are dominant markets, reflecting their larger economies and established manufacturing sectors. The "Rest of Africa" segment represents a considerable growth opportunity, with several nations poised for significant expansion in their packaging needs. Key players like Frigoglass SAIC, Glamosa glass (Pty) ltd, and Schott AG, along with several regional manufacturers, are actively shaping the market dynamics through innovation in product design, manufacturing capabilities, and sustainability initiatives. Strategic partnerships and investments in local manufacturing capabilities are expected to play a crucial role in shaping the market's future trajectory.
Africa Glass Bottles & Containers Industry: A Comprehensive Market Report (2019-2033)
This insightful report provides a detailed analysis of the Africa Glass Bottles & Containers industry, offering a comprehensive overview of market trends, leading players, and future growth prospects. The study period covers 2019-2033, with 2025 as the base and estimated year, and a forecast period of 2025-2033. This report is crucial for stakeholders seeking to understand the dynamic landscape of this vital sector in Africa. The market is valued at xx Million in 2025 and is projected to reach xx Million by 2033.
Africa Glass Bottles & Containers Industry Market Composition & Trends
This section delves into the competitive landscape, innovation drivers, and regulatory influences shaping the African glass bottles and containers market. We analyze market concentration, revealing the market share distribution among key players like Frigoglass SAIC, Consol Glass (Pty) Ltd, and National Company for Glass and Crystal (SAE), and assess the impact of mergers and acquisitions (M&A) activities, with estimated deal values reaching xx Million in the past five years. Innovation is driven by the increasing demand for sustainable packaging solutions and advancements in glass manufacturing technology. Regulatory landscapes vary across African nations, impacting production costs and market access. Substitute products, such as plastic containers, present a challenge, but growing environmental concerns are boosting demand for glass. The report further profiles key end-users across various sectors, including beverages, food, cosmetics, and pharmaceuticals, providing insights into their packaging preferences and purchasing behaviors.
- Market Concentration: Highly fragmented, with a few dominant players controlling xx% of the market.
- M&A Activity: Significant activity in recent years, totaling an estimated xx Million in deal value.
- Innovation Catalysts: Sustainability concerns, technological advancements in glass manufacturing.
- Regulatory Landscape: Varies significantly across countries; impacts production costs and market access.
- Substitute Products: Plastic containers pose a competitive threat; however, growing environmental awareness is a positive factor for the glass industry.
Africa Glass Bottles & Containers Industry Industry Evolution
The African glass bottles and containers industry has witnessed substantial growth over the past five years, driven by factors such as rising disposable incomes, expanding populations, and increased consumption of packaged goods. Technological advancements, including automation in manufacturing and improved quality control processes, have enhanced efficiency and reduced production costs. Shifting consumer preferences towards premium packaging and eco-friendly solutions are also reshaping the market. Growth trajectories vary by region and segment, with the beverage sector showing the highest growth rate, estimated at xx% annually during the historical period (2019-2024). The adoption of new technologies, such as lightweight glass and innovative closures, is accelerating at an estimated rate of xx% annually.
Leading Regions, Countries, or Segments in Africa Glass Bottles & Containers Industry
South Africa holds the dominant position in the African glass bottles and containers market, followed by Egypt and Nigeria. This dominance is driven by several key factors:
- South Africa: Well-established manufacturing infrastructure, higher per capita income, and presence of major players like Consol Glass (Pty) Ltd.
- Egypt: Large and growing population, significant investments in the food and beverage sector.
- Nigeria: Rapidly expanding consumer market, increasing demand for packaged goods.
- Rest of Africa: Shows significant potential for growth, but faces challenges related to infrastructure and economic development.
The beverage segment leads in terms of end-user industries, driven by the popularity of alcoholic and non-alcoholic beverages. The food sector is also a major driver of demand, followed by the cosmetics and pharmaceutical industries.
- Key Drivers (South Africa): Strong regulatory support, significant foreign direct investment, advanced manufacturing capabilities.
- Key Drivers (Egypt): Large consumer base, expanding domestic food & beverage industries, government initiatives to boost manufacturing.
- Key Drivers (Nigeria): Rising disposable incomes, urbanization, increase in packaged food & beverage consumption.
Africa Glass Bottles & Containers Industry Product Innovations
Recent innovations include the development of lightweight glass bottles to reduce transportation costs and environmental impact, and the introduction of innovative closures that enhance product safety and shelf life. These advancements enhance product appeal and cater to consumer demands for convenient and sustainable packaging. Unique selling propositions include improved aesthetics, enhanced functionality, and reduced environmental footprint. Technological advancements in glass manufacturing have led to increased efficiency and reduced production costs.
Propelling Factors for Africa Glass Bottles & Containers Industry Growth
Several factors contribute to the industry's growth, including increasing urbanization, rising disposable incomes across several African nations, and expanding populations driving consumption of packaged goods. Government initiatives to support local manufacturing, including tax incentives and infrastructure investments, also contribute positively. The growing preference for sustainable packaging options further fuels the industry's growth, alongside technological advancements that enhance efficiency and reduce costs.
Obstacles in the Africa Glass Bottles & Containers Industry Market
The industry faces challenges such as the fluctuating price of raw materials (e.g., natural gas for furnace operations), increasing energy costs, and inconsistent supply chain infrastructure across certain African regions. Stricter environmental regulations in some countries may also pose challenges to manufacturers. Intense competition from substitute products, particularly plastic packaging, continues to pressure margins. These factors can significantly impact production and operational efficiency, leading to fluctuating market growth and profitability.
Future Opportunities in Africa Glass Bottles & Containers Industry
Expanding into new markets across the continent holds significant potential, particularly in rapidly growing economies. Investing in sustainable technologies, such as lightweight glass and recycled glass content, offers both environmental and cost advantages. Catering to consumer preferences for innovative designs and premium packaging creates further opportunities for growth.
Major Players in the Africa Glass Bottles & Containers Industry Ecosystem
- Frigoglass SAIC
- Glamosa glass (Pty) ltd
- Schott AG
- Arab Pharmaceutical Glass Co
- Consol Glass (Pty) Ltd
- Middle East Glass Manufacturing Company SAE (MEG)
- Kandil Glass
- Bonpak (Pty) Ltd
- Nurrin Pharmalab (Pty) Ltd
- National Company for Glass and Crystal (SAE)
- United Glass Company
Key Developments in Africa Glass Bottles & Containers Industry Industry
- November 2022: Ardagh Glass Packaging Africa announced plans to invest in a third furnace at its Nigel, South Africa facility, boosting production capacity.
- June 2022: Bravo Design launched new gin bottles for Cape Saint Blaize Distillery, showcasing innovative package design.
Strategic Africa Glass Bottles & Containers Industry Market Forecast
The African glass bottles and containers market is poised for robust growth driven by rising consumer demand, expanding manufacturing capacity, and increasing investments in sustainable packaging solutions. The market's future hinges on addressing supply chain challenges, adapting to evolving consumer preferences, and leveraging technological advancements to boost efficiency and sustainability. The industry presents significant investment opportunities for companies that can effectively navigate the unique dynamics of the African market.
Africa Glass Bottles & Containers Industry Segmentation
-
1. End-user Industry
-
1.1. Beverages**
- 1.1.1. Wine and Spirits
- 1.1.2. Beer and Cider
- 1.1.3. Other Beverages (Non-alcoholic and Alcoholic)
- 1.2. Food
- 1.3. Cosmetics
- 1.4. Pharmaceuticals
- 1.5. Other End-user Industries
-
1.1. Beverages**
Africa Glass Bottles & Containers Industry Segmentation By Geography
-
1. Africa
- 1.1. Nigeria
- 1.2. South Africa
- 1.3. Egypt
- 1.4. Kenya
- 1.5. Ethiopia
- 1.6. Morocco
- 1.7. Ghana
- 1.8. Algeria
- 1.9. Tanzania
- 1.10. Ivory Coast
Africa Glass Bottles & Containers Industry REPORT HIGHLIGHTS
| Aspects | Details |
|---|---|
| Study Period | 2019-2033 |
| Base Year | 2024 |
| Estimated Year | 2025 |
| Forecast Period | 2025-2033 |
| Historical Period | 2019-2024 |
| Growth Rate | CAGR of 5.21% from 2019-2033 |
| Segmentation |
|
Table of Contents
- 1. Introduction
- 1.1. Research Scope
- 1.2. Market Segmentation
- 1.3. Research Methodology
- 1.4. Definitions and Assumptions
- 2. Executive Summary
- 2.1. Introduction
- 3. Market Dynamics
- 3.1. Introduction
- 3.2. Market Drivers
- 3.2.1. Growing Disposable Income and Integration of Glass Bottles and Containers in Premium Packaging; Shift Toward Glass Bottles and Containers due to Stringent Regulations
- 3.3. Market Restrains
- 3.3.1. Stringent Government Rules and Regulations
- 3.4. Market Trends
- 3.4.1. Beverages is expected to Hold Major Market Share
- 4. Market Factor Analysis
- 4.1. Porters Five Forces
- 4.2. Supply/Value Chain
- 4.3. PESTEL analysis
- 4.4. Market Entropy
- 4.5. Patent/Trademark Analysis
- 5. Africa Glass Bottles & Containers Industry Analysis, Insights and Forecast, 2019-2031
- 5.1. Market Analysis, Insights and Forecast - by End-user Industry
- 5.1.1. Beverages**
- 5.1.1.1. Wine and Spirits
- 5.1.1.2. Beer and Cider
- 5.1.1.3. Other Beverages (Non-alcoholic and Alcoholic)
- 5.1.2. Food
- 5.1.3. Cosmetics
- 5.1.4. Pharmaceuticals
- 5.1.5. Other End-user Industries
- 5.1.1. Beverages**
- 5.2. Market Analysis, Insights and Forecast - by Region
- 5.2.1. Africa
- 5.1. Market Analysis, Insights and Forecast - by End-user Industry
- 6. South Africa Africa Glass Bottles & Containers Industry Analysis, Insights and Forecast, 2019-2031
- 7. Sudan Africa Glass Bottles & Containers Industry Analysis, Insights and Forecast, 2019-2031
- 8. Uganda Africa Glass Bottles & Containers Industry Analysis, Insights and Forecast, 2019-2031
- 9. Tanzania Africa Glass Bottles & Containers Industry Analysis, Insights and Forecast, 2019-2031
- 10. Kenya Africa Glass Bottles & Containers Industry Analysis, Insights and Forecast, 2019-2031
- 11. Rest of Africa Africa Glass Bottles & Containers Industry Analysis, Insights and Forecast, 2019-2031
- 12. Competitive Analysis
- 12.1. Market Share Analysis 2024
- 12.2. Company Profiles
- 12.2.1 Frigoglass SAIC
- 12.2.1.1. Overview
- 12.2.1.2. Products
- 12.2.1.3. SWOT Analysis
- 12.2.1.4. Recent Developments
- 12.2.1.5. Financials (Based on Availability)
- 12.2.2 Glamosa glass (Pty) ltd
- 12.2.2.1. Overview
- 12.2.2.2. Products
- 12.2.2.3. SWOT Analysis
- 12.2.2.4. Recent Developments
- 12.2.2.5. Financials (Based on Availability)
- 12.2.3 Schott AG
- 12.2.3.1. Overview
- 12.2.3.2. Products
- 12.2.3.3. SWOT Analysis
- 12.2.3.4. Recent Developments
- 12.2.3.5. Financials (Based on Availability)
- 12.2.4 Arab Pharmaceutical Glass Co
- 12.2.4.1. Overview
- 12.2.4.2. Products
- 12.2.4.3. SWOT Analysis
- 12.2.4.4. Recent Developments
- 12.2.4.5. Financials (Based on Availability)
- 12.2.5 Consol Glass (Pty) Ltd
- 12.2.5.1. Overview
- 12.2.5.2. Products
- 12.2.5.3. SWOT Analysis
- 12.2.5.4. Recent Developments
- 12.2.5.5. Financials (Based on Availability)
- 12.2.6 Middle East Glass Manufacturing Company SAE (MEG)
- 12.2.6.1. Overview
- 12.2.6.2. Products
- 12.2.6.3. SWOT Analysis
- 12.2.6.4. Recent Developments
- 12.2.6.5. Financials (Based on Availability)
- 12.2.7 Kandil Glass
- 12.2.7.1. Overview
- 12.2.7.2. Products
- 12.2.7.3. SWOT Analysis
- 12.2.7.4. Recent Developments
- 12.2.7.5. Financials (Based on Availability)
- 12.2.8 Bonpak (Pty) Ltd
- 12.2.8.1. Overview
- 12.2.8.2. Products
- 12.2.8.3. SWOT Analysis
- 12.2.8.4. Recent Developments
- 12.2.8.5. Financials (Based on Availability)
- 12.2.9 Nurrin Pharmalab (Pty) Ltd*List Not Exhaustive
- 12.2.9.1. Overview
- 12.2.9.2. Products
- 12.2.9.3. SWOT Analysis
- 12.2.9.4. Recent Developments
- 12.2.9.5. Financials (Based on Availability)
- 12.2.10 National Company for Glass and Crystal (SAE)
- 12.2.10.1. Overview
- 12.2.10.2. Products
- 12.2.10.3. SWOT Analysis
- 12.2.10.4. Recent Developments
- 12.2.10.5. Financials (Based on Availability)
- 12.2.11 United Glass Company
- 12.2.11.1. Overview
- 12.2.11.2. Products
- 12.2.11.3. SWOT Analysis
- 12.2.11.4. Recent Developments
- 12.2.11.5. Financials (Based on Availability)
- 12.2.1 Frigoglass SAIC
List of Figures
- Figure 1: Africa Glass Bottles & Containers Industry Revenue Breakdown (Million, %) by Product 2024 & 2032
- Figure 2: Africa Glass Bottles & Containers Industry Share (%) by Company 2024
List of Tables
- Table 1: Africa Glass Bottles & Containers Industry Revenue Million Forecast, by Region 2019 & 2032
- Table 2: Africa Glass Bottles & Containers Industry Volume Billion Forecast, by Region 2019 & 2032
- Table 3: Africa Glass Bottles & Containers Industry Revenue Million Forecast, by End-user Industry 2019 & 2032
- Table 4: Africa Glass Bottles & Containers Industry Volume Billion Forecast, by End-user Industry 2019 & 2032
- Table 5: Africa Glass Bottles & Containers Industry Revenue Million Forecast, by Region 2019 & 2032
- Table 6: Africa Glass Bottles & Containers Industry Volume Billion Forecast, by Region 2019 & 2032
- Table 7: Africa Glass Bottles & Containers Industry Revenue Million Forecast, by Country 2019 & 2032
- Table 8: Africa Glass Bottles & Containers Industry Volume Billion Forecast, by Country 2019 & 2032
- Table 9: South Africa Africa Glass Bottles & Containers Industry Revenue (Million) Forecast, by Application 2019 & 2032
- Table 10: South Africa Africa Glass Bottles & Containers Industry Volume (Billion) Forecast, by Application 2019 & 2032
- Table 11: Sudan Africa Glass Bottles & Containers Industry Revenue (Million) Forecast, by Application 2019 & 2032
- Table 12: Sudan Africa Glass Bottles & Containers Industry Volume (Billion) Forecast, by Application 2019 & 2032
- Table 13: Uganda Africa Glass Bottles & Containers Industry Revenue (Million) Forecast, by Application 2019 & 2032
- Table 14: Uganda Africa Glass Bottles & Containers Industry Volume (Billion) Forecast, by Application 2019 & 2032
- Table 15: Tanzania Africa Glass Bottles & Containers Industry Revenue (Million) Forecast, by Application 2019 & 2032
- Table 16: Tanzania Africa Glass Bottles & Containers Industry Volume (Billion) Forecast, by Application 2019 & 2032
- Table 17: Kenya Africa Glass Bottles & Containers Industry Revenue (Million) Forecast, by Application 2019 & 2032
- Table 18: Kenya Africa Glass Bottles & Containers Industry Volume (Billion) Forecast, by Application 2019 & 2032
- Table 19: Rest of Africa Africa Glass Bottles & Containers Industry Revenue (Million) Forecast, by Application 2019 & 2032
- Table 20: Rest of Africa Africa Glass Bottles & Containers Industry Volume (Billion) Forecast, by Application 2019 & 2032
- Table 21: Africa Glass Bottles & Containers Industry Revenue Million Forecast, by End-user Industry 2019 & 2032
- Table 22: Africa Glass Bottles & Containers Industry Volume Billion Forecast, by End-user Industry 2019 & 2032
- Table 23: Africa Glass Bottles & Containers Industry Revenue Million Forecast, by Country 2019 & 2032
- Table 24: Africa Glass Bottles & Containers Industry Volume Billion Forecast, by Country 2019 & 2032
- Table 25: Nigeria Africa Glass Bottles & Containers Industry Revenue (Million) Forecast, by Application 2019 & 2032
- Table 26: Nigeria Africa Glass Bottles & Containers Industry Volume (Billion) Forecast, by Application 2019 & 2032
- Table 27: South Africa Africa Glass Bottles & Containers Industry Revenue (Million) Forecast, by Application 2019 & 2032
- Table 28: South Africa Africa Glass Bottles & Containers Industry Volume (Billion) Forecast, by Application 2019 & 2032
- Table 29: Egypt Africa Glass Bottles & Containers Industry Revenue (Million) Forecast, by Application 2019 & 2032
- Table 30: Egypt Africa Glass Bottles & Containers Industry Volume (Billion) Forecast, by Application 2019 & 2032
- Table 31: Kenya Africa Glass Bottles & Containers Industry Revenue (Million) Forecast, by Application 2019 & 2032
- Table 32: Kenya Africa Glass Bottles & Containers Industry Volume (Billion) Forecast, by Application 2019 & 2032
- Table 33: Ethiopia Africa Glass Bottles & Containers Industry Revenue (Million) Forecast, by Application 2019 & 2032
- Table 34: Ethiopia Africa Glass Bottles & Containers Industry Volume (Billion) Forecast, by Application 2019 & 2032
- Table 35: Morocco Africa Glass Bottles & Containers Industry Revenue (Million) Forecast, by Application 2019 & 2032
- Table 36: Morocco Africa Glass Bottles & Containers Industry Volume (Billion) Forecast, by Application 2019 & 2032
- Table 37: Ghana Africa Glass Bottles & Containers Industry Revenue (Million) Forecast, by Application 2019 & 2032
- Table 38: Ghana Africa Glass Bottles & Containers Industry Volume (Billion) Forecast, by Application 2019 & 2032
- Table 39: Algeria Africa Glass Bottles & Containers Industry Revenue (Million) Forecast, by Application 2019 & 2032
- Table 40: Algeria Africa Glass Bottles & Containers Industry Volume (Billion) Forecast, by Application 2019 & 2032
- Table 41: Tanzania Africa Glass Bottles & Containers Industry Revenue (Million) Forecast, by Application 2019 & 2032
- Table 42: Tanzania Africa Glass Bottles & Containers Industry Volume (Billion) Forecast, by Application 2019 & 2032
- Table 43: Ivory Coast Africa Glass Bottles & Containers Industry Revenue (Million) Forecast, by Application 2019 & 2032
- Table 44: Ivory Coast Africa Glass Bottles & Containers Industry Volume (Billion) Forecast, by Application 2019 & 2032
Frequently Asked Questions
1. What is the projected Compound Annual Growth Rate (CAGR) of the Africa Glass Bottles & Containers Industry?
The projected CAGR is approximately 5.21%.
2. Which companies are prominent players in the Africa Glass Bottles & Containers Industry?
Key companies in the market include Frigoglass SAIC, Glamosa glass (Pty) ltd, Schott AG, Arab Pharmaceutical Glass Co, Consol Glass (Pty) Ltd, Middle East Glass Manufacturing Company SAE (MEG), Kandil Glass, Bonpak (Pty) Ltd, Nurrin Pharmalab (Pty) Ltd*List Not Exhaustive, National Company for Glass and Crystal (SAE), United Glass Company.
3. What are the main segments of the Africa Glass Bottles & Containers Industry?
The market segments include End-user Industry.
4. Can you provide details about the market size?
The market size is estimated to be USD XX Million as of 2022.
5. What are some drivers contributing to market growth?
Growing Disposable Income and Integration of Glass Bottles and Containers in Premium Packaging; Shift Toward Glass Bottles and Containers due to Stringent Regulations.
6. What are the notable trends driving market growth?
Beverages is expected to Hold Major Market Share.
7. Are there any restraints impacting market growth?
Stringent Government Rules and Regulations.
8. Can you provide examples of recent developments in the market?
November 2022: At its Nigel manufacturing site in Gauteng, South Africa, Ardagh Glass Packaging Africa revealed plans to invest in a third furnace. Following the recently completed Nigel 2 (N2) extension, investing in a third furnace (N3) would boost the facility's capacity even more. The extension is anticipated to be completed in late 2023 and would take advantage of Ardagh Group's technological expertise and global sourcing.
9. What pricing options are available for accessing the report?
Pricing options include single-user, multi-user, and enterprise licenses priced at USD 3800, USD 4500, and USD 5800 respectively.
10. Is the market size provided in terms of value or volume?
The market size is provided in terms of value, measured in Million and volume, measured in Billion.
11. Are there any specific market keywords associated with the report?
Yes, the market keyword associated with the report is "Africa Glass Bottles & Containers Industry," which aids in identifying and referencing the specific market segment covered.
12. How do I determine which pricing option suits my needs best?
The pricing options vary based on user requirements and access needs. Individual users may opt for single-user licenses, while businesses requiring broader access may choose multi-user or enterprise licenses for cost-effective access to the report.
13. Are there any additional resources or data provided in the Africa Glass Bottles & Containers Industry report?
While the report offers comprehensive insights, it's advisable to review the specific contents or supplementary materials provided to ascertain if additional resources or data are available.
14. How can I stay updated on further developments or reports in the Africa Glass Bottles & Containers Industry?
To stay informed about further developments, trends, and reports in the Africa Glass Bottles & Containers Industry, consider subscribing to industry newsletters, following relevant companies and organizations, or regularly checking reputable industry news sources and publications.
Methodology
Step 1 - Identification of Relevant Samples Size from Population Database


Step 2 - Approaches for Defining Global Market Size (Value, Volume* & Price*)

Note*: In applicable scenarios
Step 3 - Data Sources
Primary Research
- Web Analytics
- Survey Reports
- Research Institute
- Latest Research Reports
- Opinion Leaders
Secondary Research
- Annual Reports
- White Paper
- Latest Press Release
- Industry Association
- Paid Database
- Investor Presentations

Step 4 - Data Triangulation
Involves using different sources of information in order to increase the validity of a study
These sources are likely to be stakeholders in a program - participants, other researchers, program staff, other community members, and so on.
Then we put all data in single framework & apply various statistical tools to find out the dynamic on the market.
During the analysis stage, feedback from the stakeholder groups would be compared to determine areas of agreement as well as areas of divergence
