

Key Insights
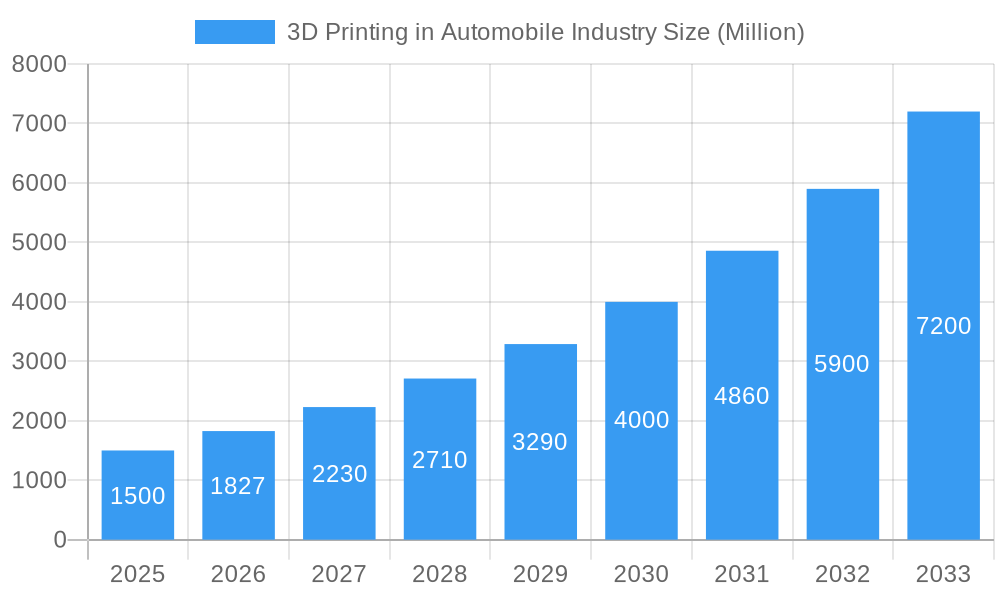
The automotive 3D printing market is poised for substantial expansion, driven by the increasing demand for lightweight, high-strength components and accelerated prototyping. The market, valued at $5.93 billion in 2025, is projected to grow at a Compound Annual Growth Rate (CAGR) of 14.8% from 2025 to 2033. This growth is underpinned by several key factors: the adoption of additive manufacturing (AM) technologies enabling complex geometries and customization; the drive for fuel efficiency and reduced emissions, boosting the use of 3D-printed lightweight components from polymers, ceramics, aluminum, and titanium; and the shift towards on-demand manufacturing and rapid prototyping. Significant investments by automotive OEMs in AM are accelerating adoption for functional parts, interior trims, and tooling.
3D Printing in Automobile Industry Market Size (In Billion)
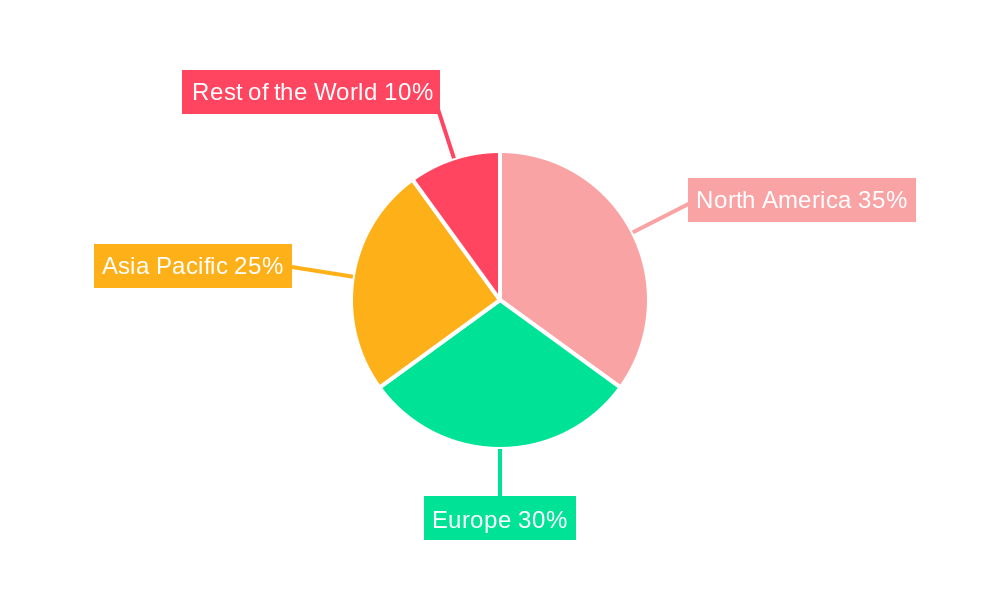
While initial investment costs and scalability concerns for mass production present challenges, ongoing advancements in materials science, software, and printer capabilities are mitigating these restraints. The increasing availability of cost-effective AM solutions and growing industry expertise are expected to foster long-term market growth. The market is segmented by material (metal, polymer, ceramic), application (production, prototyping/R&D), technology (SLS, SLA, DLP, EBM, SLM, FDM), and component (hardware, software, service). Leading players like 3D Systems, Stratasys, and EOS are driving innovation through strategic partnerships and technological advancements. North America, Europe, and Asia Pacific demonstrate strong growth potential, with China and the USA as key markets.
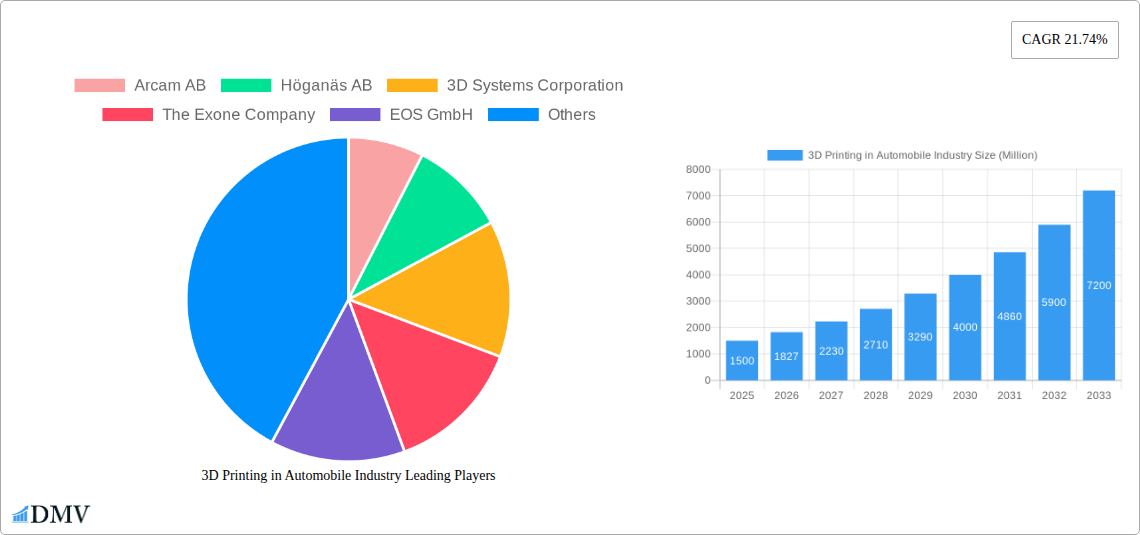
3D Printing in Automobile Industry Company Market Share
3D Printing in the Automobile Industry: A Comprehensive Market Report (2019-2033)
This insightful report provides a detailed analysis of the 3D printing market within the automotive industry, encompassing market size, growth trajectories, technological advancements, and key players. The study period covers 2019-2033, with 2025 as the base and estimated year, and a forecast period of 2025-2033. We delve into the impact of recent mergers and acquisitions, regulatory changes, and emerging technologies on this rapidly evolving sector, offering crucial insights for stakeholders across the value chain. The market is projected to reach xx Million by 2033.
3D Printing in Automobile Industry Market Composition & Trends
This section evaluates the market concentration, identifying key players and their market share distribution. We analyze innovation catalysts, regulatory landscapes, substitute products, and end-user profiles, providing a comprehensive overview of the competitive landscape. The report also meticulously examines M&A activities within the industry, providing details on deal values and their implications. The current market is characterized by a moderately concentrated structure, with major players like 3D Systems Corporation, Stratasys Ltd, and EOS GmbH holding significant market share. However, the emergence of numerous smaller companies and continuous technological advancements contribute to a dynamic environment.
- Market Share Distribution (2024 Estimate): 3D Systems Corporation: xx%; Stratasys Ltd: xx%; EOS GmbH: xx%; Others: xx%
- M&A Deal Values (2019-2024): Total value exceeding USD xx Million, with significant transactions including the Stratasys Ltd-Ultimaker merger and Materialise N.V.'s acquisition of Identify3D.
- Key Innovation Catalysts: Advancements in materials science, software development, and printing technologies are driving innovation.
- Regulatory Landscape: Government regulations regarding safety and environmental standards are increasingly influencing market dynamics.
3D Printing in Automobile Industry Industry Evolution
This section details the evolution of the 3D printing market in the automotive industry from 2019 to 2024, projecting growth trajectories through 2033. We analyze technological advancements, such as the adoption of Selective Laser Melting (SLM) and Fused Deposition Modeling (FDM), and shifting consumer demands, which are pushing the adoption of 3D printing for both prototyping and production purposes. The market experienced a Compound Annual Growth Rate (CAGR) of xx% during the historical period (2019-2024) and is projected to maintain a CAGR of xx% during the forecast period (2025-2033). The increasing demand for lightweight and customized components, coupled with the decreasing cost of 3D printing technologies, is fueling market expansion. Adoption metrics show a significant increase in the number of automotive companies integrating 3D printing into their production processes.
Leading Regions, Countries, or Segments in 3D Printing in Automobile Industry
This section pinpoints the dominant regions, countries, and segments within the automotive 3D printing market. We examine factors contributing to their leadership, providing a detailed analysis of market dynamics.
Dominant Segments:
- By Material Type: Metal dominates due to its strength and durability requirements in automotive parts. Polymer is used extensively in prototyping and for less critical components.
- By Application Type: Production is emerging as a major segment driven by advancements in speed and precision. Prototyping/R&D remains significant for design optimization.
- By Technology Type: SLM and SLS technologies are leading in metal printing, while FDM is prevalent in polymer-based applications.
- By Component Type: Hardware (printers, materials) holds a larger market share, with software and services playing a supporting role.
Key Drivers (Bullet Points):
- Significant investments from major automotive manufacturers
- Supportive government policies and initiatives promoting additive manufacturing
- Favorable economic conditions and reduced production costs.
Factors Contributing to Dominance:
The dominance of specific segments is influenced by factors like material properties, application needs, technological maturity, and cost-effectiveness. The high demand for lightweight and high-strength components makes metal a leading material. The established nature of SLS and SLM technologies, coupled with their suitability for metal printing, contributes to their dominance in this area.
3D Printing in Automobile Industry Product Innovations
Recent innovations include high-speed printers, improved material formulations (e.g., high-strength polymers and specialized alloys), and enhanced software capabilities for design and process optimization. These advancements are leading to faster production cycles, reduced material waste, and improved part quality. Unique selling propositions include customized designs, lightweight components, and reduced tooling costs.
Propelling Factors for 3D Printing in Automobile Industry Growth
Several factors drive market growth. Technological advancements, such as improved printing speed and material options, enable the creation of complex, high-performance components. Economically, 3D printing offers cost savings through reduced tooling and inventory needs. Government regulations encouraging the adoption of sustainable manufacturing practices also support market expansion.
Obstacles in the 3D Printing in Automobile Industry Market
Challenges include high initial investment costs for equipment, limited material choices compared to traditional manufacturing, and potential supply chain disruptions related to material sourcing. Regulatory uncertainties and quality control issues also pose limitations. The competitive landscape, with numerous players vying for market share, presents additional challenges.
Future Opportunities in 3D Printing in Automobile Industry
Future growth will likely be driven by the expansion into new applications, such as personalized automotive parts and on-demand manufacturing. Technological advancements, like the integration of Artificial Intelligence (AI) in design and production, will unlock new possibilities. New materials with enhanced performance characteristics and scalability will also boost market growth.
Major Players in the 3D Printing in Automobile Industry Ecosystem
- Arcam AB
- Höganäs AB
- 3D Systems Corporation
- The Exone Company
- EOS GmbH
- Voxeljet AG
- Materialise NV
- Moog Inc
- Ultimaker BV
- Stratasys Ltd
- Envisiontec GmbH
Key Developments in 3D Printing in Automobile Industry Industry
- November 2022: Desktop Metal secures a USD 9 Million order for binder jet systems from a German automaker for mass production of powertrain components. This signifies growing adoption of 3D printing for high-volume production.
- November 2022: 3D Systems and ALM partner to expand access to 3D printing materials, improving material choices for SLS technology users.
- September 2022: Stratasys Ltd. completes the merger of MakerBot and Ultimaker, creating a larger player in the desktop 3D printing market.
- September 2022: Materialise N.V. acquires Identify3D, enhancing the security of its additive manufacturing platform.
- August 2022: Stratasys Ltd. acquires Covestro AG's additive materials business, expanding its material portfolio and accelerating materials innovation.
- August 2022: Voxeljet AG completes a sale-leaseback agreement, generating USD 26.78 Million in proceeds.
Strategic 3D Printing in Automobile Industry Market Forecast
The 3D printing market in the automotive industry is poised for significant growth, driven by technological innovations, increasing demand for customized components, and the adoption of sustainable manufacturing practices. The market is projected to experience robust expansion, with considerable opportunities in high-volume production, the development of new materials, and the integration of advanced technologies like AI and automation. The continuous refinement of 3D printing techniques and the growing collaboration between automotive manufacturers and 3D printing companies will further accelerate this growth.
3D Printing in Automobile Industry Segmentation
-
1. Technology Type
- 1.1. Selective Laser Sintering (SLS)
- 1.2. Stereo Lithography (SLA)
- 1.3. Digital Light Processing (DLP)
- 1.4. Electronic Beam Melting (EBM)
- 1.5. Selective Laser Melting (SLM)
- 1.6. Fused Deposition Modeling (FDM)
-
2. Component Type
- 2.1. Hardware
- 2.2. Software
- 2.3. Service
-
3. Material Type
- 3.1. Metal
- 3.2. Polymer
- 3.3. Ceramic
-
4. Application Type
- 4.1. Production
- 4.2. Prototyping/R&D
3D Printing in Automobile Industry Segmentation By Geography
-
1. North America
- 1.1. United States
- 1.2. Canada
- 1.3. Rest of North America
-
2. Europe
- 2.1. Germany
- 2.2. United Kingdom
- 2.3. France
- 2.4. Rest of Europe
-
3. Asia Pacific
- 3.1. China
- 3.2. Japan
- 3.3. India
- 3.4. Rest of Asia Pacific
-
4. Rest of the World
- 4.1. Brazil
- 4.2. Argentina
- 4.3. Other Countries
3D Printing in Automobile Industry Regional Market Share
Geographic Coverage of 3D Printing in Automobile Industry
3D Printing in Automobile Industry REPORT HIGHLIGHTS
| Aspects | Details |
|---|---|
| Study Period | 2020-2034 |
| Base Year | 2025 |
| Estimated Year | 2026 |
| Forecast Period | 2026-2034 |
| Historical Period | 2020-2025 |
| Growth Rate | CAGR of 14.8% from 2020-2034 |
| Segmentation |
|
Table of Contents
- 1. Introduction
- 1.1. Research Scope
- 1.2. Market Segmentation
- 1.3. Research Objective
- 1.4. Definitions and Assumptions
- 2. Executive Summary
- 2.1. Market Snapshot
- 3. Market Dynamics
- 3.1. Market Drivers
- 3.2. Market Restrains
- 3.3. Market Trends
- 3.4. Market Opportunities
- 4. Market Factor Analysis
- 4.1. Porters Five Forces
- 4.1.1. Bargaining Power of Suppliers
- 4.1.2. Bargaining Power of Buyers
- 4.1.3. Threat of New Entrants
- 4.1.4. Threat of Substitutes
- 4.1.5. Competitive Rivalry
- 4.2. PESTEL analysis
- 4.3. BCG Analysis
- 4.3.1. Stars (High Growth, High Market Share)
- 4.3.2. Cash Cows (Low Growth, High Market Share)
- 4.3.3. Question Mark (High Growth, Low Market Share)
- 4.3.4. Dogs (Low Growth, Low Market Share)
- 4.4. Ansoff Matrix Analysis
- 4.5. Supply Chain Analysis
- 4.6. Regulatory Landscape
- 4.7. Current Market Potential and Opportunity Assessment (TAM–SAM–SOM Framework)
- 4.8. DMV Analyst Note
- 4.1. Porters Five Forces
- 5. Market Analysis, Insights and Forecast 2021-2033
- 5.1. Market Analysis, Insights and Forecast - by Technology Type
- 5.1.1. Selective Laser Sintering (SLS)
- 5.1.2. Stereo Lithography (SLA)
- 5.1.3. Digital Light Processing (DLP)
- 5.1.4. Electronic Beam Melting (EBM)
- 5.1.5. Selective Laser Melting (SLM)
- 5.1.6. Fused Deposition Modeling (FDM)
- 5.2. Market Analysis, Insights and Forecast - by Component Type
- 5.2.1. Hardware
- 5.2.2. Software
- 5.2.3. Service
- 5.3. Market Analysis, Insights and Forecast - by Material Type
- 5.3.1. Metal
- 5.3.2. Polymer
- 5.3.3. Ceramic
- 5.4. Market Analysis, Insights and Forecast - by Application Type
- 5.4.1. Production
- 5.4.2. Prototyping/R&D
- 5.5. Market Analysis, Insights and Forecast - by Region
- 5.5.1. North America
- 5.5.2. Europe
- 5.5.3. Asia Pacific
- 5.5.4. Rest of the World
- 5.1. Market Analysis, Insights and Forecast - by Technology Type
- 6. Global 3D Printing in Automobile Industry Analysis, Insights and Forecast, 2021-2033
- 6.1. Market Analysis, Insights and Forecast - by Technology Type
- 6.1.1. Selective Laser Sintering (SLS)
- 6.1.2. Stereo Lithography (SLA)
- 6.1.3. Digital Light Processing (DLP)
- 6.1.4. Electronic Beam Melting (EBM)
- 6.1.5. Selective Laser Melting (SLM)
- 6.1.6. Fused Deposition Modeling (FDM)
- 6.2. Market Analysis, Insights and Forecast - by Component Type
- 6.2.1. Hardware
- 6.2.2. Software
- 6.2.3. Service
- 6.3. Market Analysis, Insights and Forecast - by Material Type
- 6.3.1. Metal
- 6.3.2. Polymer
- 6.3.3. Ceramic
- 6.4. Market Analysis, Insights and Forecast - by Application Type
- 6.4.1. Production
- 6.4.2. Prototyping/R&D
- 6.1. Market Analysis, Insights and Forecast - by Technology Type
- 7. North America 3D Printing in Automobile Industry Analysis, Insights and Forecast, 2020-2032
- 7.1. Market Analysis, Insights and Forecast - by Technology Type
- 7.1.1. Selective Laser Sintering (SLS)
- 7.1.2. Stereo Lithography (SLA)
- 7.1.3. Digital Light Processing (DLP)
- 7.1.4. Electronic Beam Melting (EBM)
- 7.1.5. Selective Laser Melting (SLM)
- 7.1.6. Fused Deposition Modeling (FDM)
- 7.2. Market Analysis, Insights and Forecast - by Component Type
- 7.2.1. Hardware
- 7.2.2. Software
- 7.2.3. Service
- 7.3. Market Analysis, Insights and Forecast - by Material Type
- 7.3.1. Metal
- 7.3.2. Polymer
- 7.3.3. Ceramic
- 7.4. Market Analysis, Insights and Forecast - by Application Type
- 7.4.1. Production
- 7.4.2. Prototyping/R&D
- 7.1. Market Analysis, Insights and Forecast - by Technology Type
- 8. Europe 3D Printing in Automobile Industry Analysis, Insights and Forecast, 2020-2032
- 8.1. Market Analysis, Insights and Forecast - by Technology Type
- 8.1.1. Selective Laser Sintering (SLS)
- 8.1.2. Stereo Lithography (SLA)
- 8.1.3. Digital Light Processing (DLP)
- 8.1.4. Electronic Beam Melting (EBM)
- 8.1.5. Selective Laser Melting (SLM)
- 8.1.6. Fused Deposition Modeling (FDM)
- 8.2. Market Analysis, Insights and Forecast - by Component Type
- 8.2.1. Hardware
- 8.2.2. Software
- 8.2.3. Service
- 8.3. Market Analysis, Insights and Forecast - by Material Type
- 8.3.1. Metal
- 8.3.2. Polymer
- 8.3.3. Ceramic
- 8.4. Market Analysis, Insights and Forecast - by Application Type
- 8.4.1. Production
- 8.4.2. Prototyping/R&D
- 8.1. Market Analysis, Insights and Forecast - by Technology Type
- 9. Asia Pacific 3D Printing in Automobile Industry Analysis, Insights and Forecast, 2020-2032
- 9.1. Market Analysis, Insights and Forecast - by Technology Type
- 9.1.1. Selective Laser Sintering (SLS)
- 9.1.2. Stereo Lithography (SLA)
- 9.1.3. Digital Light Processing (DLP)
- 9.1.4. Electronic Beam Melting (EBM)
- 9.1.5. Selective Laser Melting (SLM)
- 9.1.6. Fused Deposition Modeling (FDM)
- 9.2. Market Analysis, Insights and Forecast - by Component Type
- 9.2.1. Hardware
- 9.2.2. Software
- 9.2.3. Service
- 9.3. Market Analysis, Insights and Forecast - by Material Type
- 9.3.1. Metal
- 9.3.2. Polymer
- 9.3.3. Ceramic
- 9.4. Market Analysis, Insights and Forecast - by Application Type
- 9.4.1. Production
- 9.4.2. Prototyping/R&D
- 9.1. Market Analysis, Insights and Forecast - by Technology Type
- 10. Rest of the World 3D Printing in Automobile Industry Analysis, Insights and Forecast, 2020-2032
- 10.1. Market Analysis, Insights and Forecast - by Technology Type
- 10.1.1. Selective Laser Sintering (SLS)
- 10.1.2. Stereo Lithography (SLA)
- 10.1.3. Digital Light Processing (DLP)
- 10.1.4. Electronic Beam Melting (EBM)
- 10.1.5. Selective Laser Melting (SLM)
- 10.1.6. Fused Deposition Modeling (FDM)
- 10.2. Market Analysis, Insights and Forecast - by Component Type
- 10.2.1. Hardware
- 10.2.2. Software
- 10.2.3. Service
- 10.3. Market Analysis, Insights and Forecast - by Material Type
- 10.3.1. Metal
- 10.3.2. Polymer
- 10.3.3. Ceramic
- 10.4. Market Analysis, Insights and Forecast - by Application Type
- 10.4.1. Production
- 10.4.2. Prototyping/R&D
- 10.1. Market Analysis, Insights and Forecast - by Technology Type
- 11. Competitive Analysis
- 11.1. Company Profiles
- 11.1.1 Arcam AB
- 11.1.1.1. Company Overview
- 11.1.1.2. Products
- 11.1.1.3. Company Financials
- 11.1.1.4. SWOT Analysis
- 11.1.2 Höganäs AB
- 11.1.2.1. Company Overview
- 11.1.2.2. Products
- 11.1.2.3. Company Financials
- 11.1.2.4. SWOT Analysis
- 11.1.3 3D Systems Corporation
- 11.1.3.1. Company Overview
- 11.1.3.2. Products
- 11.1.3.3. Company Financials
- 11.1.3.4. SWOT Analysis
- 11.1.4 The Exone Company
- 11.1.4.1. Company Overview
- 11.1.4.2. Products
- 11.1.4.3. Company Financials
- 11.1.4.4. SWOT Analysis
- 11.1.5 EOS GmbH
- 11.1.5.1. Company Overview
- 11.1.5.2. Products
- 11.1.5.3. Company Financials
- 11.1.5.4. SWOT Analysis
- 11.1.6 Voxeljet AG
- 11.1.6.1. Company Overview
- 11.1.6.2. Products
- 11.1.6.3. Company Financials
- 11.1.6.4. SWOT Analysis
- 11.1.7 Materialise NV
- 11.1.7.1. Company Overview
- 11.1.7.2. Products
- 11.1.7.3. Company Financials
- 11.1.7.4. SWOT Analysis
- 11.1.8 Moog Inc *List Not Exhaustive
- 11.1.8.1. Company Overview
- 11.1.8.2. Products
- 11.1.8.3. Company Financials
- 11.1.8.4. SWOT Analysis
- 11.1.9 Ultimaker BV
- 11.1.9.1. Company Overview
- 11.1.9.2. Products
- 11.1.9.3. Company Financials
- 11.1.9.4. SWOT Analysis
- 11.1.10 Stratasys Ltd
- 11.1.10.1. Company Overview
- 11.1.10.2. Products
- 11.1.10.3. Company Financials
- 11.1.10.4. SWOT Analysis
- 11.1.11 Envisiontec GmbH
- 11.1.11.1. Company Overview
- 11.1.11.2. Products
- 11.1.11.3. Company Financials
- 11.1.11.4. SWOT Analysis
- 11.1.1 Arcam AB
- 11.2. Market Entropy
- 11.2.1 Company's Key Areas Served
- 11.2.2 Recent Developments
- 11.3. Company Market Share Analysis 2025
- 11.3.1 Top 5 Companies Market Share Analysis
- 11.3.2 Top 3 Companies Market Share Analysis
- 11.4. List of Potential Customers
- 12. Research Methodology
List of Figures
- Figure 1: Global 3D Printing in Automobile Industry Revenue Breakdown (billion, %) by Region 2025 & 2033
- Figure 2: North America 3D Printing in Automobile Industry Revenue (billion), by Technology Type 2025 & 2033
- Figure 3: North America 3D Printing in Automobile Industry Revenue Share (%), by Technology Type 2025 & 2033
- Figure 4: North America 3D Printing in Automobile Industry Revenue (billion), by Component Type 2025 & 2033
- Figure 5: North America 3D Printing in Automobile Industry Revenue Share (%), by Component Type 2025 & 2033
- Figure 6: North America 3D Printing in Automobile Industry Revenue (billion), by Material Type 2025 & 2033
- Figure 7: North America 3D Printing in Automobile Industry Revenue Share (%), by Material Type 2025 & 2033
- Figure 8: North America 3D Printing in Automobile Industry Revenue (billion), by Application Type 2025 & 2033
- Figure 9: North America 3D Printing in Automobile Industry Revenue Share (%), by Application Type 2025 & 2033
- Figure 10: North America 3D Printing in Automobile Industry Revenue (billion), by Country 2025 & 2033
- Figure 11: North America 3D Printing in Automobile Industry Revenue Share (%), by Country 2025 & 2033
- Figure 12: Europe 3D Printing in Automobile Industry Revenue (billion), by Technology Type 2025 & 2033
- Figure 13: Europe 3D Printing in Automobile Industry Revenue Share (%), by Technology Type 2025 & 2033
- Figure 14: Europe 3D Printing in Automobile Industry Revenue (billion), by Component Type 2025 & 2033
- Figure 15: Europe 3D Printing in Automobile Industry Revenue Share (%), by Component Type 2025 & 2033
- Figure 16: Europe 3D Printing in Automobile Industry Revenue (billion), by Material Type 2025 & 2033
- Figure 17: Europe 3D Printing in Automobile Industry Revenue Share (%), by Material Type 2025 & 2033
- Figure 18: Europe 3D Printing in Automobile Industry Revenue (billion), by Application Type 2025 & 2033
- Figure 19: Europe 3D Printing in Automobile Industry Revenue Share (%), by Application Type 2025 & 2033
- Figure 20: Europe 3D Printing in Automobile Industry Revenue (billion), by Country 2025 & 2033
- Figure 21: Europe 3D Printing in Automobile Industry Revenue Share (%), by Country 2025 & 2033
- Figure 22: Asia Pacific 3D Printing in Automobile Industry Revenue (billion), by Technology Type 2025 & 2033
- Figure 23: Asia Pacific 3D Printing in Automobile Industry Revenue Share (%), by Technology Type 2025 & 2033
- Figure 24: Asia Pacific 3D Printing in Automobile Industry Revenue (billion), by Component Type 2025 & 2033
- Figure 25: Asia Pacific 3D Printing in Automobile Industry Revenue Share (%), by Component Type 2025 & 2033
- Figure 26: Asia Pacific 3D Printing in Automobile Industry Revenue (billion), by Material Type 2025 & 2033
- Figure 27: Asia Pacific 3D Printing in Automobile Industry Revenue Share (%), by Material Type 2025 & 2033
- Figure 28: Asia Pacific 3D Printing in Automobile Industry Revenue (billion), by Application Type 2025 & 2033
- Figure 29: Asia Pacific 3D Printing in Automobile Industry Revenue Share (%), by Application Type 2025 & 2033
- Figure 30: Asia Pacific 3D Printing in Automobile Industry Revenue (billion), by Country 2025 & 2033
- Figure 31: Asia Pacific 3D Printing in Automobile Industry Revenue Share (%), by Country 2025 & 2033
- Figure 32: Rest of the World 3D Printing in Automobile Industry Revenue (billion), by Technology Type 2025 & 2033
- Figure 33: Rest of the World 3D Printing in Automobile Industry Revenue Share (%), by Technology Type 2025 & 2033
- Figure 34: Rest of the World 3D Printing in Automobile Industry Revenue (billion), by Component Type 2025 & 2033
- Figure 35: Rest of the World 3D Printing in Automobile Industry Revenue Share (%), by Component Type 2025 & 2033
- Figure 36: Rest of the World 3D Printing in Automobile Industry Revenue (billion), by Material Type 2025 & 2033
- Figure 37: Rest of the World 3D Printing in Automobile Industry Revenue Share (%), by Material Type 2025 & 2033
- Figure 38: Rest of the World 3D Printing in Automobile Industry Revenue (billion), by Application Type 2025 & 2033
- Figure 39: Rest of the World 3D Printing in Automobile Industry Revenue Share (%), by Application Type 2025 & 2033
- Figure 40: Rest of the World 3D Printing in Automobile Industry Revenue (billion), by Country 2025 & 2033
- Figure 41: Rest of the World 3D Printing in Automobile Industry Revenue Share (%), by Country 2025 & 2033
List of Tables
- Table 1: Global 3D Printing in Automobile Industry Revenue billion Forecast, by Technology Type 2020 & 2033
- Table 2: Global 3D Printing in Automobile Industry Revenue billion Forecast, by Component Type 2020 & 2033
- Table 3: Global 3D Printing in Automobile Industry Revenue billion Forecast, by Material Type 2020 & 2033
- Table 4: Global 3D Printing in Automobile Industry Revenue billion Forecast, by Application Type 2020 & 2033
- Table 5: Global 3D Printing in Automobile Industry Revenue billion Forecast, by Region 2020 & 2033
- Table 6: Global 3D Printing in Automobile Industry Revenue billion Forecast, by Technology Type 2020 & 2033
- Table 7: Global 3D Printing in Automobile Industry Revenue billion Forecast, by Component Type 2020 & 2033
- Table 8: Global 3D Printing in Automobile Industry Revenue billion Forecast, by Material Type 2020 & 2033
- Table 9: Global 3D Printing in Automobile Industry Revenue billion Forecast, by Application Type 2020 & 2033
- Table 10: Global 3D Printing in Automobile Industry Revenue billion Forecast, by Country 2020 & 2033
- Table 11: United States 3D Printing in Automobile Industry Revenue (billion) Forecast, by Application 2020 & 2033
- Table 12: Canada 3D Printing in Automobile Industry Revenue (billion) Forecast, by Application 2020 & 2033
- Table 13: Rest of North America 3D Printing in Automobile Industry Revenue (billion) Forecast, by Application 2020 & 2033
- Table 14: Global 3D Printing in Automobile Industry Revenue billion Forecast, by Technology Type 2020 & 2033
- Table 15: Global 3D Printing in Automobile Industry Revenue billion Forecast, by Component Type 2020 & 2033
- Table 16: Global 3D Printing in Automobile Industry Revenue billion Forecast, by Material Type 2020 & 2033
- Table 17: Global 3D Printing in Automobile Industry Revenue billion Forecast, by Application Type 2020 & 2033
- Table 18: Global 3D Printing in Automobile Industry Revenue billion Forecast, by Country 2020 & 2033
- Table 19: Germany 3D Printing in Automobile Industry Revenue (billion) Forecast, by Application 2020 & 2033
- Table 20: United Kingdom 3D Printing in Automobile Industry Revenue (billion) Forecast, by Application 2020 & 2033
- Table 21: France 3D Printing in Automobile Industry Revenue (billion) Forecast, by Application 2020 & 2033
- Table 22: Rest of Europe 3D Printing in Automobile Industry Revenue (billion) Forecast, by Application 2020 & 2033
- Table 23: Global 3D Printing in Automobile Industry Revenue billion Forecast, by Technology Type 2020 & 2033
- Table 24: Global 3D Printing in Automobile Industry Revenue billion Forecast, by Component Type 2020 & 2033
- Table 25: Global 3D Printing in Automobile Industry Revenue billion Forecast, by Material Type 2020 & 2033
- Table 26: Global 3D Printing in Automobile Industry Revenue billion Forecast, by Application Type 2020 & 2033
- Table 27: Global 3D Printing in Automobile Industry Revenue billion Forecast, by Country 2020 & 2033
- Table 28: China 3D Printing in Automobile Industry Revenue (billion) Forecast, by Application 2020 & 2033
- Table 29: Japan 3D Printing in Automobile Industry Revenue (billion) Forecast, by Application 2020 & 2033
- Table 30: India 3D Printing in Automobile Industry Revenue (billion) Forecast, by Application 2020 & 2033
- Table 31: Rest of Asia Pacific 3D Printing in Automobile Industry Revenue (billion) Forecast, by Application 2020 & 2033
- Table 32: Global 3D Printing in Automobile Industry Revenue billion Forecast, by Technology Type 2020 & 2033
- Table 33: Global 3D Printing in Automobile Industry Revenue billion Forecast, by Component Type 2020 & 2033
- Table 34: Global 3D Printing in Automobile Industry Revenue billion Forecast, by Material Type 2020 & 2033
- Table 35: Global 3D Printing in Automobile Industry Revenue billion Forecast, by Application Type 2020 & 2033
- Table 36: Global 3D Printing in Automobile Industry Revenue billion Forecast, by Country 2020 & 2033
- Table 37: Brazil 3D Printing in Automobile Industry Revenue (billion) Forecast, by Application 2020 & 2033
- Table 38: Argentina 3D Printing in Automobile Industry Revenue (billion) Forecast, by Application 2020 & 2033
- Table 39: Other Countries 3D Printing in Automobile Industry Revenue (billion) Forecast, by Application 2020 & 2033
Frequently Asked Questions
1. What is the projected Compound Annual Growth Rate (CAGR) of the 3D Printing in Automobile Industry?
The projected CAGR is approximately 14.8%.
2. Which companies are prominent players in the 3D Printing in Automobile Industry?
Key companies in the market include Arcam AB, Höganäs AB, 3D Systems Corporation, The Exone Company, EOS GmbH, Voxeljet AG, Materialise NV, Moog Inc *List Not Exhaustive, Ultimaker BV, Stratasys Ltd, Envisiontec GmbH.
3. What are the main segments of the 3D Printing in Automobile Industry?
The market segments include Technology Type, Component Type, Material Type, Application Type.
4. Can you provide details about the market size?
The market size is estimated to be USD 5.93 billion as of 2022.
5. What are some drivers contributing to market growth?
Increasingly Focused On Lightweighting Vehicles.
6. What are the notable trends driving market growth?
Growing Adoption of Fused Deposition Modeling Technology.
7. Are there any restraints impacting market growth?
High Production Cost.
8. Can you provide examples of recent developments in the market?
November 2022- Desktop Metal, the parent company of ExOne, announced that it had won a USD 9 million order from one of the major German car manufacturers for binder jet additive manufacturing systems used for the mass production of powertrain components.
9. What pricing options are available for accessing the report?
Pricing options include single-user, multi-user, and enterprise licenses priced at USD 4750, USD 5250, and USD 8750 respectively.
10. Is the market size provided in terms of value or volume?
The market size is provided in terms of value, measured in billion.
11. Are there any specific market keywords associated with the report?
Yes, the market keyword associated with the report is "3D Printing in Automobile Industry," which aids in identifying and referencing the specific market segment covered.
12. How do I determine which pricing option suits my needs best?
The pricing options vary based on user requirements and access needs. Individual users may opt for single-user licenses, while businesses requiring broader access may choose multi-user or enterprise licenses for cost-effective access to the report.
13. Are there any additional resources or data provided in the 3D Printing in Automobile Industry report?
While the report offers comprehensive insights, it's advisable to review the specific contents or supplementary materials provided to ascertain if additional resources or data are available.
14. How can I stay updated on further developments or reports in the 3D Printing in Automobile Industry?
To stay informed about further developments, trends, and reports in the 3D Printing in Automobile Industry, consider subscribing to industry newsletters, following relevant companies and organizations, or regularly checking reputable industry news sources and publications.
Methodology
Step 1 - Identification of Relevant Samples Size from Population Database


Step 2 - Approaches for Defining Global Market Size (Value, Volume* & Price*)

Note*: In applicable scenarios
Step 3 - Data Sources
Primary Research
- Web Analytics
- Survey Reports
- Research Institute
- Latest Research Reports
- Opinion Leaders
Secondary Research
- Annual Reports
- White Paper
- Latest Press Release
- Industry Association
- Paid Database
- Investor Presentations

Step 4 - Data Triangulation
Involves using different sources of information in order to increase the validity of a study
These sources are likely to be stakeholders in a program - participants, other researchers, program staff, other community members, and so on.
Then we put all data in single framework & apply various statistical tools to find out the dynamic on the market.
During the analysis stage, feedback from the stakeholder groups would be compared to determine areas of agreement as well as areas of divergence