

Key Insights
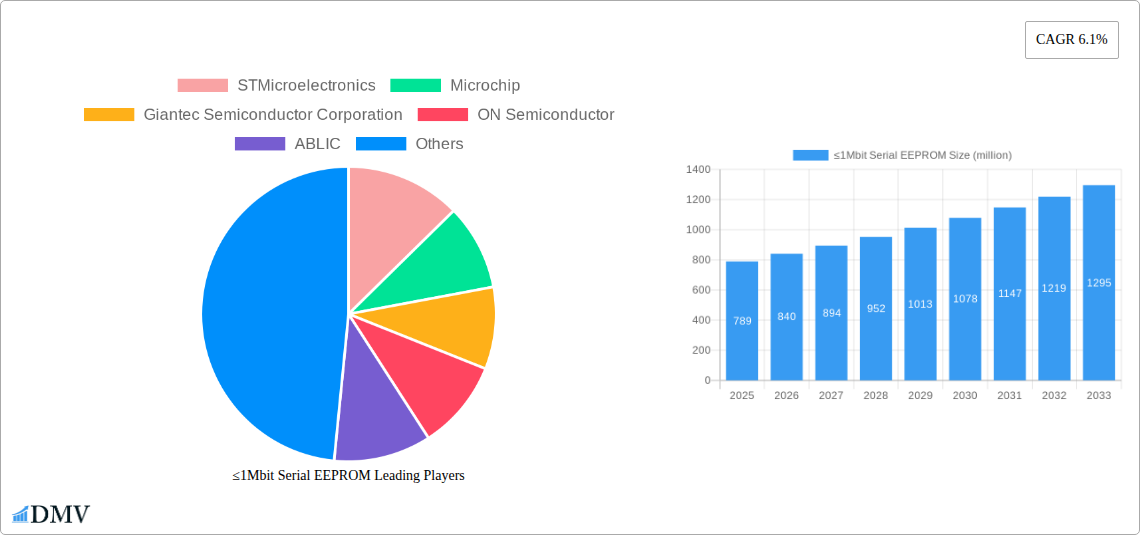
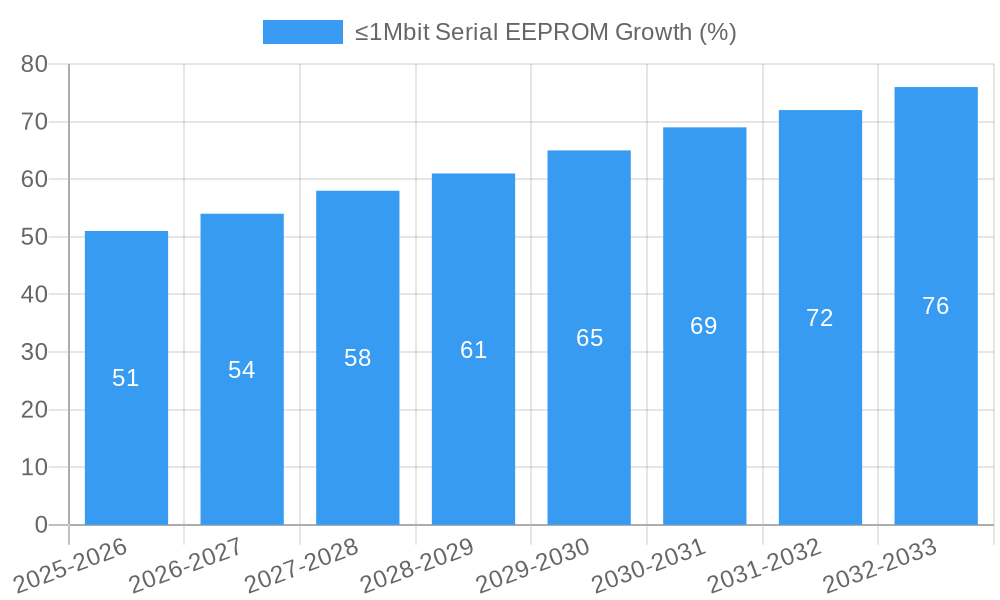
The ≤1Mbit Serial EEPROM market, valued at $789 million in 2025, is projected to experience robust growth, driven by the increasing demand for data storage in diverse applications such as automotive electronics, industrial automation, and consumer electronics. The market's Compound Annual Growth Rate (CAGR) of 6.1% from 2025 to 2033 indicates a steady expansion, fueled by factors like miniaturization trends in electronic devices, the rise of IoT (Internet of Things) applications requiring non-volatile memory solutions, and the increasing need for secure data storage in various sectors. Key players like STMicroelectronics, Microchip, and Renesas Electronics are actively shaping the market landscape through continuous innovation and product diversification. The market segmentation, while not explicitly detailed, likely includes variations based on memory density, interface type, and voltage requirements, each catering to specific application needs. Growth is anticipated across all segments, with the automotive sector potentially showing the most significant expansion due to the increasing adoption of advanced driver-assistance systems (ADAS) and electric vehicles.
Despite the positive outlook, the market may face certain challenges. Competition from alternative memory technologies, fluctuating raw material prices, and potential supply chain disruptions could act as restraints. However, ongoing technological advancements, such as improved power efficiency and enhanced security features, are expected to mitigate these challenges and sustain market growth. The forecast period (2025-2033) presents significant opportunities for existing players to consolidate their market share and for new entrants to establish a strong foothold. The continued development of smaller, more energy-efficient, and secure EEPROM solutions will be critical to capitalize on the expanding market potential.
≤1Mbit Serial EEPROM Market Report: A Comprehensive Analysis (2019-2033)
This insightful report provides a comprehensive analysis of the ≤1Mbit Serial EEPROM market, offering a detailed understanding of its current state, future trajectory, and key players. Covering the period from 2019 to 2033, with a focus on 2025 as the base and estimated year, this study unveils crucial market dynamics and trends for stakeholders in the electronics and semiconductor industries. The report examines market size exceeding millions of units, delving into technological advancements, regional variations, and competitive landscapes. It's an essential resource for businesses seeking to navigate the evolving ≤1Mbit Serial EEPROM landscape and capitalize on emerging opportunities.
≤1Mbit Serial EEPROM Market Composition & Trends
This section analyzes the competitive landscape of the ≤1Mbit Serial EEPROM market, evaluating market concentration, innovation drivers, regulatory influences, substitute technologies, end-user segments, and mergers & acquisitions (M&A) activity. The report incorporates data from the historical period (2019-2024), base year (2025), and forecast period (2025-2033) to provide a holistic perspective.
- Market Concentration: The report details market share distribution among key players like STMicroelectronics, Microchip, and others, identifying potential monopolies or oligopolies. We estimate that the top 5 players hold approximately xx% of the market share in 2025.
- Innovation Catalysts: Analysis covers technological advancements driving innovation, such as improved density, power efficiency, and data retention capabilities.
- Regulatory Landscape: The report assesses the impact of global and regional regulations on market growth and development. This includes examining compliance requirements and potential barriers to entry.
- Substitute Products: An in-depth analysis of substitute products and technologies, along with their market penetration and potential impact on ≤1Mbit Serial EEPROM demand.
- End-User Profiles: The report identifies key end-user segments, analyzing their specific needs and contribution to overall market demand across various applications such as automotive, industrial, and consumer electronics.
- M&A Activities: A comprehensive overview of recent M&A activities within the industry, including deal values and their impact on market consolidation and competitive dynamics. For example, the xx merger between Company A and Company B in 2024 resulted in an estimated xx million increase in market capitalization.
≤1Mbit Serial EEPROM Industry Evolution
This section presents a detailed analysis of the ≤1Mbit Serial EEPROM market's evolution, examining growth trajectories, technological advancements, and evolving consumer demands. The analysis covers the historical period (2019-2024), base year (2025), and forecast period (2025-2033). We observe a Compound Annual Growth Rate (CAGR) of xx% during the historical period, driven primarily by increased demand in the automotive and industrial sectors. Technological advancements such as the integration of xx technology have significantly improved performance and reduced costs, further fueling market growth. Emerging trends like the Internet of Things (IoT) are expected to drive significant demand in the forecast period, pushing the CAGR to xx% by 2033. Increased adoption in xx applications is projected to contribute significantly to this growth. The shift towards more energy-efficient devices is influencing product design and will further drive market growth in the coming years. Specific data points on adoption rates, growth rates, and technological advancements will further illustrate these market trends.
Leading Regions, Countries, or Segments in ≤1Mbit Serial EEPROM
This section identifies the dominant regions, countries, or segments within the ≤1Mbit Serial EEPROM market, examining the factors contributing to their leadership.
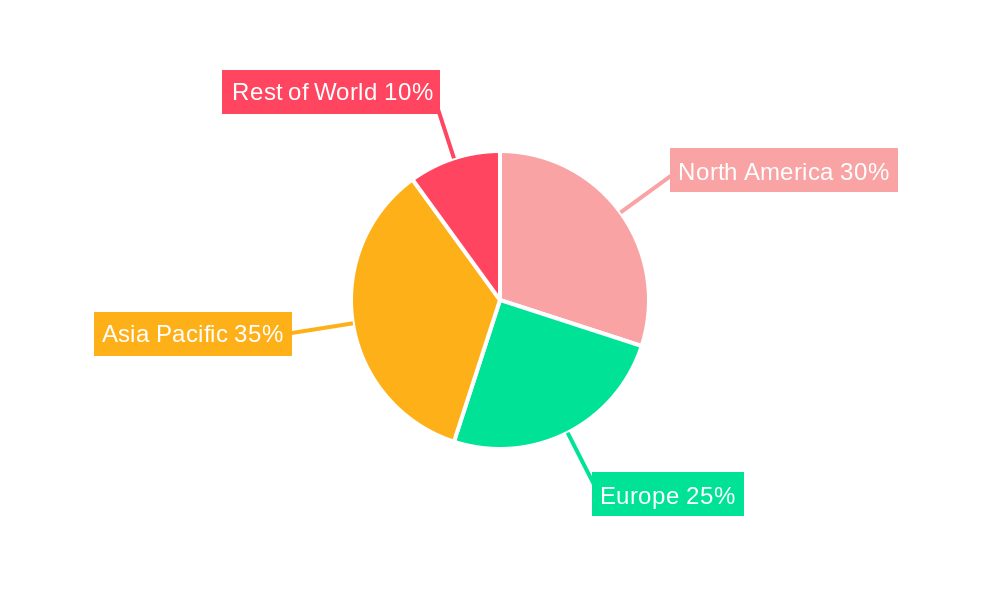
- Dominant Region/Country/Segment: Asia-Pacific is projected to be the leading region due to the high concentration of electronics manufacturing and strong demand from rapidly growing markets like China and India.
- Key Drivers:
- Investment Trends: Significant investments in research and development within the region have fueled innovation and production capacity.
- Regulatory Support: Government policies promoting the electronics industry and technological advancement in the region support market growth.
- Strong Manufacturing Base: Established manufacturing capabilities and infrastructure within Asia-Pacific provides a cost advantage and facilitates market growth.
- High Demand from Key End-User Sectors: The high demand for electronic devices from automotive, industrial, and consumer electronics sectors fuels the market's expansion.
The detailed analysis will highlight the specific factors driving the dominance of this region, comparing it to other key regions like North America and Europe, and evaluating differences in market dynamics, regulatory environments, and consumer behavior.
≤1Mbit Serial EEPROM Product Innovations
Recent innovations in ≤1Mbit Serial EEPROM technology include improved data retention capabilities, enhanced power efficiency, and smaller form factors. These advancements are driven by increasing demand for higher performance and lower power consumption in applications such as automotive electronics, industrial automation, and consumer devices. Unique selling propositions include enhanced data security features and improved reliability under harsh operating conditions. The integration of advanced manufacturing processes has led to cost reductions and increased production volumes, making the technology more accessible to a wider range of applications.
Propelling Factors for ≤1Mbit Serial EEPROM Growth
Several key factors are driving the growth of the ≤1Mbit Serial EEPROM market. Firstly, the increasing adoption of IoT devices necessitates reliable and cost-effective non-volatile memory solutions. Secondly, the expansion of the automotive sector and its growing demand for sophisticated electronic control units (ECUs) fuels this market growth. Furthermore, advancements in semiconductor manufacturing technologies have led to improved performance and reduced costs, making ≤1Mbit Serial EEPROM a more attractive solution for various applications. Government regulations promoting energy efficiency are also a driving force.
Obstacles in the ≤1Mbit Serial EEPROM Market
The ≤1Mbit Serial EEPROM market faces several challenges. Fluctuations in raw material prices and potential supply chain disruptions can impact production costs and availability. Intense competition from alternative memory technologies poses a significant challenge. Finally, stringent regulatory requirements related to data security and environmental compliance can increase production costs and hinder market expansion. These obstacles could collectively impact the growth trajectory by an estimated xx% if not mitigated effectively.
Future Opportunities in ≤1Mbit Serial EEPROM
Emerging opportunities lie in the development of specialized ≤1Mbit Serial EEPROM solutions for high-reliability applications in areas like aerospace and medical devices. The integration of advanced security features, such as encryption and tamper detection, presents a promising avenue for growth. Furthermore, the rising demand for energy-efficient electronics will further drive the development of low-power ≤1Mbit Serial EEPROM solutions. Expansion into emerging markets with a growing consumer electronics base will also present significant opportunities.
Major Players in the ≤1Mbit Serial EEPROM Ecosystem
- STMicroelectronics
- Microchip
- Giantec Semiconductor Corporation
- ON Semiconductor
- ABLIC
- FMD
- Fudan microelectronic
- ROHM
- Hua Hong Semiconductor
- Renesas Electronics
- Adesto Technologies Corporation,Inc
Key Developments in ≤1Mbit Serial EEPROM Industry
- 2023-Q3: STMicroelectronics launched a new series of ≤1Mbit Serial EEPROMs with enhanced data retention capabilities.
- 2022-Q4: Microchip acquired a smaller EEPROM manufacturer, further consolidating its market share.
- 2021-Q2: New industry standards for data security in ≤1Mbit Serial EEPROMs were introduced.
- (Further developments with year/month and impact will be included)
Strategic ≤1Mbit Serial EEPROM Market Forecast
The ≤1Mbit Serial EEPROM market is poised for robust growth in the forecast period (2025-2033), driven by several factors: continued expansion of the IoT market, rising demand in the automotive and industrial sectors, and ongoing technological advancements. The increasing focus on energy efficiency and data security will further propel market expansion. The market is expected to witness a significant increase in demand, reaching an estimated xx million units by 2033, presenting substantial opportunities for existing players and new entrants alike. The report provides detailed forecasts segmented by region, application, and technology.
≤1Mbit Serial EEPROM Segmentation
-
1. Application
- 1.1. Automotive
- 1.2. Consumer Electronics
- 1.3. Medical
- 1.4. Industrial
- 1.5. Others
-
2. Types
- 2.1. Below 16Kbit Serial EEPROM
- 2.2. 32Kbit Serial EEPROM
- 2.3. 64Kbit Serial EEPROM
- 2.4. 128Kbit Serial EEPROM
- 2.5. 256Kbit Serial EEPROM
- 2.6. 512Kbit Serial EEPROM
- 2.7. 1Mbit Serial EEPROM
≤1Mbit Serial EEPROM Segmentation By Geography
-
1. North America
- 1.1. United States
- 1.2. Canada
- 1.3. Mexico
-
2. South America
- 2.1. Brazil
- 2.2. Argentina
- 2.3. Rest of South America
-
3. Europe
- 3.1. United Kingdom
- 3.2. Germany
- 3.3. France
- 3.4. Italy
- 3.5. Spain
- 3.6. Russia
- 3.7. Benelux
- 3.8. Nordics
- 3.9. Rest of Europe
-
4. Middle East & Africa
- 4.1. Turkey
- 4.2. Israel
- 4.3. GCC
- 4.4. North Africa
- 4.5. South Africa
- 4.6. Rest of Middle East & Africa
-
5. Asia Pacific
- 5.1. China
- 5.2. India
- 5.3. Japan
- 5.4. South Korea
- 5.5. ASEAN
- 5.6. Oceania
- 5.7. Rest of Asia Pacific
≤1Mbit Serial EEPROM REPORT HIGHLIGHTS
| Aspects | Details |
|---|---|
| Study Period | 2019-2033 |
| Base Year | 2024 |
| Estimated Year | 2025 |
| Forecast Period | 2025-2033 |
| Historical Period | 2019-2024 |
| Growth Rate | CAGR of 6.1% from 2019-2033 |
| Segmentation |
|
Table of Contents
- 1. Introduction
- 1.1. Research Scope
- 1.2. Market Segmentation
- 1.3. Research Methodology
- 1.4. Definitions and Assumptions
- 2. Executive Summary
- 2.1. Introduction
- 3. Market Dynamics
- 3.1. Introduction
- 3.2. Market Drivers
- 3.3. Market Restrains
- 3.4. Market Trends
- 4. Market Factor Analysis
- 4.1. Porters Five Forces
- 4.2. Supply/Value Chain
- 4.3. PESTEL analysis
- 4.4. Market Entropy
- 4.5. Patent/Trademark Analysis
- 5. Global ≤1Mbit Serial EEPROM Analysis, Insights and Forecast, 2019-2031
- 5.1. Market Analysis, Insights and Forecast - by Application
- 5.1.1. Automotive
- 5.1.2. Consumer Electronics
- 5.1.3. Medical
- 5.1.4. Industrial
- 5.1.5. Others
- 5.2. Market Analysis, Insights and Forecast - by Types
- 5.2.1. Below 16Kbit Serial EEPROM
- 5.2.2. 32Kbit Serial EEPROM
- 5.2.3. 64Kbit Serial EEPROM
- 5.2.4. 128Kbit Serial EEPROM
- 5.2.5. 256Kbit Serial EEPROM
- 5.2.6. 512Kbit Serial EEPROM
- 5.2.7. 1Mbit Serial EEPROM
- 5.3. Market Analysis, Insights and Forecast - by Region
- 5.3.1. North America
- 5.3.2. South America
- 5.3.3. Europe
- 5.3.4. Middle East & Africa
- 5.3.5. Asia Pacific
- 5.1. Market Analysis, Insights and Forecast - by Application
- 6. North America ≤1Mbit Serial EEPROM Analysis, Insights and Forecast, 2019-2031
- 6.1. Market Analysis, Insights and Forecast - by Application
- 6.1.1. Automotive
- 6.1.2. Consumer Electronics
- 6.1.3. Medical
- 6.1.4. Industrial
- 6.1.5. Others
- 6.2. Market Analysis, Insights and Forecast - by Types
- 6.2.1. Below 16Kbit Serial EEPROM
- 6.2.2. 32Kbit Serial EEPROM
- 6.2.3. 64Kbit Serial EEPROM
- 6.2.4. 128Kbit Serial EEPROM
- 6.2.5. 256Kbit Serial EEPROM
- 6.2.6. 512Kbit Serial EEPROM
- 6.2.7. 1Mbit Serial EEPROM
- 6.1. Market Analysis, Insights and Forecast - by Application
- 7. South America ≤1Mbit Serial EEPROM Analysis, Insights and Forecast, 2019-2031
- 7.1. Market Analysis, Insights and Forecast - by Application
- 7.1.1. Automotive
- 7.1.2. Consumer Electronics
- 7.1.3. Medical
- 7.1.4. Industrial
- 7.1.5. Others
- 7.2. Market Analysis, Insights and Forecast - by Types
- 7.2.1. Below 16Kbit Serial EEPROM
- 7.2.2. 32Kbit Serial EEPROM
- 7.2.3. 64Kbit Serial EEPROM
- 7.2.4. 128Kbit Serial EEPROM
- 7.2.5. 256Kbit Serial EEPROM
- 7.2.6. 512Kbit Serial EEPROM
- 7.2.7. 1Mbit Serial EEPROM
- 7.1. Market Analysis, Insights and Forecast - by Application
- 8. Europe ≤1Mbit Serial EEPROM Analysis, Insights and Forecast, 2019-2031
- 8.1. Market Analysis, Insights and Forecast - by Application
- 8.1.1. Automotive
- 8.1.2. Consumer Electronics
- 8.1.3. Medical
- 8.1.4. Industrial
- 8.1.5. Others
- 8.2. Market Analysis, Insights and Forecast - by Types
- 8.2.1. Below 16Kbit Serial EEPROM
- 8.2.2. 32Kbit Serial EEPROM
- 8.2.3. 64Kbit Serial EEPROM
- 8.2.4. 128Kbit Serial EEPROM
- 8.2.5. 256Kbit Serial EEPROM
- 8.2.6. 512Kbit Serial EEPROM
- 8.2.7. 1Mbit Serial EEPROM
- 8.1. Market Analysis, Insights and Forecast - by Application
- 9. Middle East & Africa ≤1Mbit Serial EEPROM Analysis, Insights and Forecast, 2019-2031
- 9.1. Market Analysis, Insights and Forecast - by Application
- 9.1.1. Automotive
- 9.1.2. Consumer Electronics
- 9.1.3. Medical
- 9.1.4. Industrial
- 9.1.5. Others
- 9.2. Market Analysis, Insights and Forecast - by Types
- 9.2.1. Below 16Kbit Serial EEPROM
- 9.2.2. 32Kbit Serial EEPROM
- 9.2.3. 64Kbit Serial EEPROM
- 9.2.4. 128Kbit Serial EEPROM
- 9.2.5. 256Kbit Serial EEPROM
- 9.2.6. 512Kbit Serial EEPROM
- 9.2.7. 1Mbit Serial EEPROM
- 9.1. Market Analysis, Insights and Forecast - by Application
- 10. Asia Pacific ≤1Mbit Serial EEPROM Analysis, Insights and Forecast, 2019-2031
- 10.1. Market Analysis, Insights and Forecast - by Application
- 10.1.1. Automotive
- 10.1.2. Consumer Electronics
- 10.1.3. Medical
- 10.1.4. Industrial
- 10.1.5. Others
- 10.2. Market Analysis, Insights and Forecast - by Types
- 10.2.1. Below 16Kbit Serial EEPROM
- 10.2.2. 32Kbit Serial EEPROM
- 10.2.3. 64Kbit Serial EEPROM
- 10.2.4. 128Kbit Serial EEPROM
- 10.2.5. 256Kbit Serial EEPROM
- 10.2.6. 512Kbit Serial EEPROM
- 10.2.7. 1Mbit Serial EEPROM
- 10.1. Market Analysis, Insights and Forecast - by Application
- 11. Competitive Analysis
- 11.1. Global Market Share Analysis 2024
- 11.2. Company Profiles
- 11.2.1 STMicroelectronics
- 11.2.1.1. Overview
- 11.2.1.2. Products
- 11.2.1.3. SWOT Analysis
- 11.2.1.4. Recent Developments
- 11.2.1.5. Financials (Based on Availability)
- 11.2.2 Microchip
- 11.2.2.1. Overview
- 11.2.2.2. Products
- 11.2.2.3. SWOT Analysis
- 11.2.2.4. Recent Developments
- 11.2.2.5. Financials (Based on Availability)
- 11.2.3 Giantec Semiconductor Corporation
- 11.2.3.1. Overview
- 11.2.3.2. Products
- 11.2.3.3. SWOT Analysis
- 11.2.3.4. Recent Developments
- 11.2.3.5. Financials (Based on Availability)
- 11.2.4 ON Semiconductor
- 11.2.4.1. Overview
- 11.2.4.2. Products
- 11.2.4.3. SWOT Analysis
- 11.2.4.4. Recent Developments
- 11.2.4.5. Financials (Based on Availability)
- 11.2.5 ABLIC
- 11.2.5.1. Overview
- 11.2.5.2. Products
- 11.2.5.3. SWOT Analysis
- 11.2.5.4. Recent Developments
- 11.2.5.5. Financials (Based on Availability)
- 11.2.6 FMD
- 11.2.6.1. Overview
- 11.2.6.2. Products
- 11.2.6.3. SWOT Analysis
- 11.2.6.4. Recent Developments
- 11.2.6.5. Financials (Based on Availability)
- 11.2.7 Fudan microelectronic
- 11.2.7.1. Overview
- 11.2.7.2. Products
- 11.2.7.3. SWOT Analysis
- 11.2.7.4. Recent Developments
- 11.2.7.5. Financials (Based on Availability)
- 11.2.8 ROHM
- 11.2.8.1. Overview
- 11.2.8.2. Products
- 11.2.8.3. SWOT Analysis
- 11.2.8.4. Recent Developments
- 11.2.8.5. Financials (Based on Availability)
- 11.2.9 Hua Hong Semiconductor
- 11.2.9.1. Overview
- 11.2.9.2. Products
- 11.2.9.3. SWOT Analysis
- 11.2.9.4. Recent Developments
- 11.2.9.5. Financials (Based on Availability)
- 11.2.10 Renesas Electronics
- 11.2.10.1. Overview
- 11.2.10.2. Products
- 11.2.10.3. SWOT Analysis
- 11.2.10.4. Recent Developments
- 11.2.10.5. Financials (Based on Availability)
- 11.2.11 Adesto Technologies Corporation
- 11.2.11.1. Overview
- 11.2.11.2. Products
- 11.2.11.3. SWOT Analysis
- 11.2.11.4. Recent Developments
- 11.2.11.5. Financials (Based on Availability)
- 11.2.12 Inc
- 11.2.12.1. Overview
- 11.2.12.2. Products
- 11.2.12.3. SWOT Analysis
- 11.2.12.4. Recent Developments
- 11.2.12.5. Financials (Based on Availability)
- 11.2.1 STMicroelectronics
List of Figures
- Figure 1: Global ≤1Mbit Serial EEPROM Revenue Breakdown (million, %) by Region 2024 & 2032
- Figure 2: North America ≤1Mbit Serial EEPROM Revenue (million), by Application 2024 & 2032
- Figure 3: North America ≤1Mbit Serial EEPROM Revenue Share (%), by Application 2024 & 2032
- Figure 4: North America ≤1Mbit Serial EEPROM Revenue (million), by Types 2024 & 2032
- Figure 5: North America ≤1Mbit Serial EEPROM Revenue Share (%), by Types 2024 & 2032
- Figure 6: North America ≤1Mbit Serial EEPROM Revenue (million), by Country 2024 & 2032
- Figure 7: North America ≤1Mbit Serial EEPROM Revenue Share (%), by Country 2024 & 2032
- Figure 8: South America ≤1Mbit Serial EEPROM Revenue (million), by Application 2024 & 2032
- Figure 9: South America ≤1Mbit Serial EEPROM Revenue Share (%), by Application 2024 & 2032
- Figure 10: South America ≤1Mbit Serial EEPROM Revenue (million), by Types 2024 & 2032
- Figure 11: South America ≤1Mbit Serial EEPROM Revenue Share (%), by Types 2024 & 2032
- Figure 12: South America ≤1Mbit Serial EEPROM Revenue (million), by Country 2024 & 2032
- Figure 13: South America ≤1Mbit Serial EEPROM Revenue Share (%), by Country 2024 & 2032
- Figure 14: Europe ≤1Mbit Serial EEPROM Revenue (million), by Application 2024 & 2032
- Figure 15: Europe ≤1Mbit Serial EEPROM Revenue Share (%), by Application 2024 & 2032
- Figure 16: Europe ≤1Mbit Serial EEPROM Revenue (million), by Types 2024 & 2032
- Figure 17: Europe ≤1Mbit Serial EEPROM Revenue Share (%), by Types 2024 & 2032
- Figure 18: Europe ≤1Mbit Serial EEPROM Revenue (million), by Country 2024 & 2032
- Figure 19: Europe ≤1Mbit Serial EEPROM Revenue Share (%), by Country 2024 & 2032
- Figure 20: Middle East & Africa ≤1Mbit Serial EEPROM Revenue (million), by Application 2024 & 2032
- Figure 21: Middle East & Africa ≤1Mbit Serial EEPROM Revenue Share (%), by Application 2024 & 2032
- Figure 22: Middle East & Africa ≤1Mbit Serial EEPROM Revenue (million), by Types 2024 & 2032
- Figure 23: Middle East & Africa ≤1Mbit Serial EEPROM Revenue Share (%), by Types 2024 & 2032
- Figure 24: Middle East & Africa ≤1Mbit Serial EEPROM Revenue (million), by Country 2024 & 2032
- Figure 25: Middle East & Africa ≤1Mbit Serial EEPROM Revenue Share (%), by Country 2024 & 2032
- Figure 26: Asia Pacific ≤1Mbit Serial EEPROM Revenue (million), by Application 2024 & 2032
- Figure 27: Asia Pacific ≤1Mbit Serial EEPROM Revenue Share (%), by Application 2024 & 2032
- Figure 28: Asia Pacific ≤1Mbit Serial EEPROM Revenue (million), by Types 2024 & 2032
- Figure 29: Asia Pacific ≤1Mbit Serial EEPROM Revenue Share (%), by Types 2024 & 2032
- Figure 30: Asia Pacific ≤1Mbit Serial EEPROM Revenue (million), by Country 2024 & 2032
- Figure 31: Asia Pacific ≤1Mbit Serial EEPROM Revenue Share (%), by Country 2024 & 2032
List of Tables
- Table 1: Global ≤1Mbit Serial EEPROM Revenue million Forecast, by Region 2019 & 2032
- Table 2: Global ≤1Mbit Serial EEPROM Revenue million Forecast, by Application 2019 & 2032
- Table 3: Global ≤1Mbit Serial EEPROM Revenue million Forecast, by Types 2019 & 2032
- Table 4: Global ≤1Mbit Serial EEPROM Revenue million Forecast, by Region 2019 & 2032
- Table 5: Global ≤1Mbit Serial EEPROM Revenue million Forecast, by Application 2019 & 2032
- Table 6: Global ≤1Mbit Serial EEPROM Revenue million Forecast, by Types 2019 & 2032
- Table 7: Global ≤1Mbit Serial EEPROM Revenue million Forecast, by Country 2019 & 2032
- Table 8: United States ≤1Mbit Serial EEPROM Revenue (million) Forecast, by Application 2019 & 2032
- Table 9: Canada ≤1Mbit Serial EEPROM Revenue (million) Forecast, by Application 2019 & 2032
- Table 10: Mexico ≤1Mbit Serial EEPROM Revenue (million) Forecast, by Application 2019 & 2032
- Table 11: Global ≤1Mbit Serial EEPROM Revenue million Forecast, by Application 2019 & 2032
- Table 12: Global ≤1Mbit Serial EEPROM Revenue million Forecast, by Types 2019 & 2032
- Table 13: Global ≤1Mbit Serial EEPROM Revenue million Forecast, by Country 2019 & 2032
- Table 14: Brazil ≤1Mbit Serial EEPROM Revenue (million) Forecast, by Application 2019 & 2032
- Table 15: Argentina ≤1Mbit Serial EEPROM Revenue (million) Forecast, by Application 2019 & 2032
- Table 16: Rest of South America ≤1Mbit Serial EEPROM Revenue (million) Forecast, by Application 2019 & 2032
- Table 17: Global ≤1Mbit Serial EEPROM Revenue million Forecast, by Application 2019 & 2032
- Table 18: Global ≤1Mbit Serial EEPROM Revenue million Forecast, by Types 2019 & 2032
- Table 19: Global ≤1Mbit Serial EEPROM Revenue million Forecast, by Country 2019 & 2032
- Table 20: United Kingdom ≤1Mbit Serial EEPROM Revenue (million) Forecast, by Application 2019 & 2032
- Table 21: Germany ≤1Mbit Serial EEPROM Revenue (million) Forecast, by Application 2019 & 2032
- Table 22: France ≤1Mbit Serial EEPROM Revenue (million) Forecast, by Application 2019 & 2032
- Table 23: Italy ≤1Mbit Serial EEPROM Revenue (million) Forecast, by Application 2019 & 2032
- Table 24: Spain ≤1Mbit Serial EEPROM Revenue (million) Forecast, by Application 2019 & 2032
- Table 25: Russia ≤1Mbit Serial EEPROM Revenue (million) Forecast, by Application 2019 & 2032
- Table 26: Benelux ≤1Mbit Serial EEPROM Revenue (million) Forecast, by Application 2019 & 2032
- Table 27: Nordics ≤1Mbit Serial EEPROM Revenue (million) Forecast, by Application 2019 & 2032
- Table 28: Rest of Europe ≤1Mbit Serial EEPROM Revenue (million) Forecast, by Application 2019 & 2032
- Table 29: Global ≤1Mbit Serial EEPROM Revenue million Forecast, by Application 2019 & 2032
- Table 30: Global ≤1Mbit Serial EEPROM Revenue million Forecast, by Types 2019 & 2032
- Table 31: Global ≤1Mbit Serial EEPROM Revenue million Forecast, by Country 2019 & 2032
- Table 32: Turkey ≤1Mbit Serial EEPROM Revenue (million) Forecast, by Application 2019 & 2032
- Table 33: Israel ≤1Mbit Serial EEPROM Revenue (million) Forecast, by Application 2019 & 2032
- Table 34: GCC ≤1Mbit Serial EEPROM Revenue (million) Forecast, by Application 2019 & 2032
- Table 35: North Africa ≤1Mbit Serial EEPROM Revenue (million) Forecast, by Application 2019 & 2032
- Table 36: South Africa ≤1Mbit Serial EEPROM Revenue (million) Forecast, by Application 2019 & 2032
- Table 37: Rest of Middle East & Africa ≤1Mbit Serial EEPROM Revenue (million) Forecast, by Application 2019 & 2032
- Table 38: Global ≤1Mbit Serial EEPROM Revenue million Forecast, by Application 2019 & 2032
- Table 39: Global ≤1Mbit Serial EEPROM Revenue million Forecast, by Types 2019 & 2032
- Table 40: Global ≤1Mbit Serial EEPROM Revenue million Forecast, by Country 2019 & 2032
- Table 41: China ≤1Mbit Serial EEPROM Revenue (million) Forecast, by Application 2019 & 2032
- Table 42: India ≤1Mbit Serial EEPROM Revenue (million) Forecast, by Application 2019 & 2032
- Table 43: Japan ≤1Mbit Serial EEPROM Revenue (million) Forecast, by Application 2019 & 2032
- Table 44: South Korea ≤1Mbit Serial EEPROM Revenue (million) Forecast, by Application 2019 & 2032
- Table 45: ASEAN ≤1Mbit Serial EEPROM Revenue (million) Forecast, by Application 2019 & 2032
- Table 46: Oceania ≤1Mbit Serial EEPROM Revenue (million) Forecast, by Application 2019 & 2032
- Table 47: Rest of Asia Pacific ≤1Mbit Serial EEPROM Revenue (million) Forecast, by Application 2019 & 2032
Frequently Asked Questions
1. What is the projected Compound Annual Growth Rate (CAGR) of the ≤1Mbit Serial EEPROM?
The projected CAGR is approximately 6.1%.
2. Which companies are prominent players in the ≤1Mbit Serial EEPROM?
Key companies in the market include STMicroelectronics, Microchip, Giantec Semiconductor Corporation, ON Semiconductor, ABLIC, FMD, Fudan microelectronic, ROHM, Hua Hong Semiconductor, Renesas Electronics, Adesto Technologies Corporation, Inc.
3. What are the main segments of the ≤1Mbit Serial EEPROM?
The market segments include Application, Types.
4. Can you provide details about the market size?
The market size is estimated to be USD 789 million as of 2022.
5. What are some drivers contributing to market growth?
N/A
6. What are the notable trends driving market growth?
N/A
7. Are there any restraints impacting market growth?
N/A
8. Can you provide examples of recent developments in the market?
N/A
9. What pricing options are available for accessing the report?
Pricing options include single-user, multi-user, and enterprise licenses priced at USD 4900.00, USD 7350.00, and USD 9800.00 respectively.
10. Is the market size provided in terms of value or volume?
The market size is provided in terms of value, measured in million.
11. Are there any specific market keywords associated with the report?
Yes, the market keyword associated with the report is "≤1Mbit Serial EEPROM," which aids in identifying and referencing the specific market segment covered.
12. How do I determine which pricing option suits my needs best?
The pricing options vary based on user requirements and access needs. Individual users may opt for single-user licenses, while businesses requiring broader access may choose multi-user or enterprise licenses for cost-effective access to the report.
13. Are there any additional resources or data provided in the ≤1Mbit Serial EEPROM report?
While the report offers comprehensive insights, it's advisable to review the specific contents or supplementary materials provided to ascertain if additional resources or data are available.
14. How can I stay updated on further developments or reports in the ≤1Mbit Serial EEPROM?
To stay informed about further developments, trends, and reports in the ≤1Mbit Serial EEPROM, consider subscribing to industry newsletters, following relevant companies and organizations, or regularly checking reputable industry news sources and publications.
Methodology
Step 1 - Identification of Relevant Samples Size from Population Database


Step 2 - Approaches for Defining Global Market Size (Value, Volume* & Price*)

Note*: In applicable scenarios
Step 3 - Data Sources
Primary Research
- Web Analytics
- Survey Reports
- Research Institute
- Latest Research Reports
- Opinion Leaders
Secondary Research
- Annual Reports
- White Paper
- Latest Press Release
- Industry Association
- Paid Database
- Investor Presentations

Step 4 - Data Triangulation
Involves using different sources of information in order to increase the validity of a study
These sources are likely to be stakeholders in a program - participants, other researchers, program staff, other community members, and so on.
Then we put all data in single framework & apply various statistical tools to find out the dynamic on the market.
During the analysis stage, feedback from the stakeholder groups would be compared to determine areas of agreement as well as areas of divergence
