

Key Insights
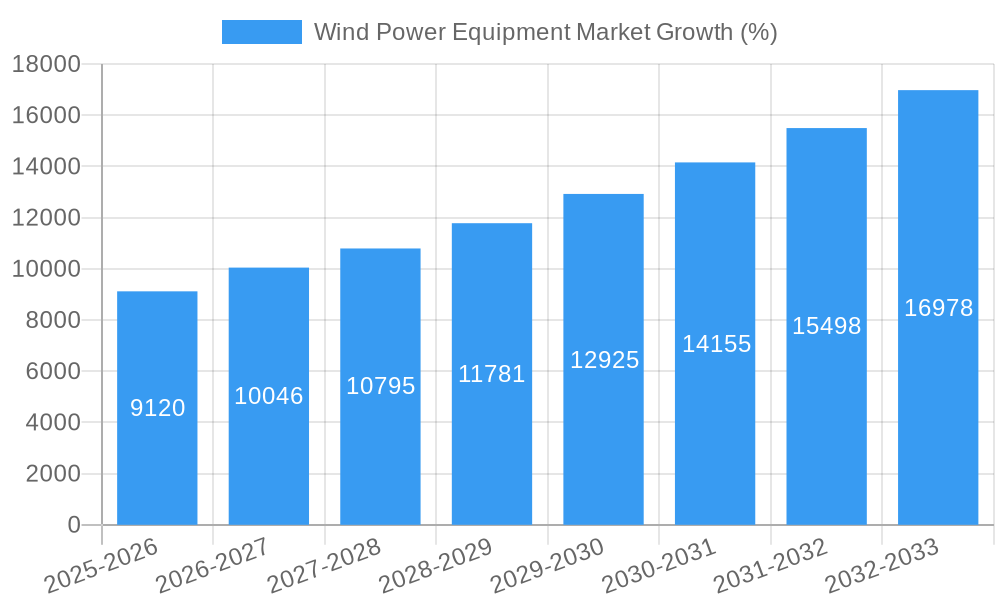
The global wind power equipment market is experiencing robust growth, projected to reach a significant value by 2033. A Compound Annual Growth Rate (CAGR) of 9.12% from 2025 to 2033 indicates a substantial expansion driven by several key factors. The increasing demand for renewable energy sources to combat climate change and achieve carbon neutrality goals is a primary driver. Governments worldwide are implementing supportive policies, including tax incentives and subsidies, to accelerate the adoption of wind energy. Technological advancements, leading to more efficient and cost-effective wind turbines (particularly in offshore wind farms which are less susceptible to fluctuating weather patterns) and improved energy storage solutions, are further propelling market growth. The market is segmented by location (onshore and offshore), with offshore wind power exhibiting faster growth due to its higher energy yield potential and increasing technological feasibility. Equipment type segmentation includes rotors/blades, towers, generators, and other components. Major players like Vestas, Siemens Gamesa, Goldwind, and GE are actively engaged in innovation and expansion, driving competition and technological advancements. Despite the positive outlook, challenges remain, including the high initial investment costs associated with wind farm projects, land acquisition issues, and the intermittent nature of wind energy. However, the long-term benefits and supportive policy environments are expected to mitigate these constraints.
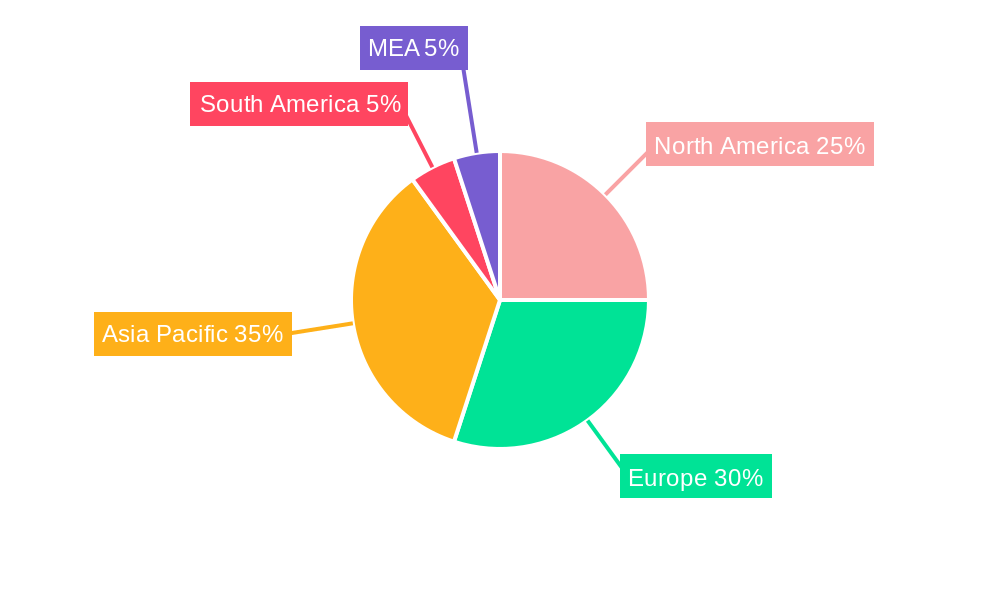
The regional distribution of the market reveals significant opportunities across various geographical locations. North America, Europe, and Asia-Pacific are currently the leading regions, with China exhibiting especially strong growth. However, developing economies in other regions, such as South America and the Middle East & Africa, are also showing increasing interest in wind power, opening up new market avenues. The ongoing expansion of offshore wind projects is expected to significantly contribute to the market's overall growth in the coming years, particularly in regions with suitable coastal resources. The consistent technological advancements in wind turbine design and manufacturing are expected to drive down costs, further enhancing the market's attractiveness for investors and developers alike. Furthermore, the growing integration of wind power into smart grids and microgrids is expected to enhance grid stability and improve overall energy management, creating additional growth opportunities within the market.
Wind Power Equipment Market: A Comprehensive Report (2019-2033)
This insightful report provides a detailed analysis of the global Wind Power Equipment Market, covering the period from 2019 to 2033. It delves into market dynamics, technological advancements, competitive landscapes, and future growth projections, offering crucial insights for stakeholders across the renewable energy sector. The report utilizes data from 2019-2024 (historical period), with 2025 as the base and estimated year, and forecasts extending to 2033. The market is segmented by location (onshore, offshore), equipment type (rotor/blade, tower, generator, other equipment types), and key players, enabling a granular understanding of this rapidly evolving market. The total market size is expected to reach xx Million by 2033.
Wind Power Equipment Market Composition & Trends
This section analyzes the market's competitive landscape, identifying key trends and drivers shaping its evolution. We explore market concentration, examining the market share distribution among major players like Vestas Wind Systems AS, Siemens Gamesa Renewable Energy, and Goldwind, highlighting the impact of mergers and acquisitions (M&A) activities. The report details the value of significant M&A deals and their influence on market consolidation. Further, it explores innovation catalysts, including technological breakthroughs in turbine design and smart grid integration, alongside regulatory landscapes and their impact on market expansion. The analysis also incorporates the influence of substitute products, profiles key end-users (e.g., utility companies, independent power producers), and assesses the overall market structure.
- Market Concentration: The market is moderately concentrated, with the top five players holding approximately xx% of the market share in 2024.
- M&A Activity: Significant M&A deals totaling xx Million were recorded between 2019 and 2024, predominantly driven by consolidation efforts and expansion into new geographical markets.
- Innovation Catalysts: Advancements in blade design, digitalization, and AI-powered predictive maintenance are key drivers of innovation.
- Regulatory Landscape: Government policies promoting renewable energy adoption significantly influence market growth, varying across regions.
- Substitute Products: While wind power holds a strong competitive advantage, solar power remains a key substitute.
Wind Power Equipment Market Industry Evolution
This section provides a comprehensive analysis of the Wind Power Equipment Market's growth trajectory, from 2019 to 2033. We examine the historical growth rates, technological advancements influencing market expansion, and the evolution of consumer demands. The impact of shifting energy policies and the increasing focus on sustainability are meticulously assessed. Specific data points, including growth rates (e.g., a CAGR of xx% between 2019 and 2024), and adoption rates of new technologies are presented. We also analyze the influence of fluctuating commodity prices and their effect on manufacturing costs and market pricing strategies. The role of technological advancements, such as the integration of AI and IoT in wind turbine operations, and the shift towards larger turbine capacities are explored in detail.
Leading Regions, Countries, or Segments in Wind Power Equipment Market
This section identifies the dominant regions, countries, and segments within the Wind Power Equipment Market, focusing on onshore vs. offshore wind and specific equipment types. A detailed breakdown of market performance across various geographical locations and equipment categories is provided. The analysis explores the underlying drivers fueling the dominance of specific regions or segments.
- Onshore Wind: Remains the dominant segment due to lower installation costs and established infrastructure.
- Offshore Wind: Shows significant growth potential, driven by increasing capacity and government incentives, but faces higher capital expenditure constraints.
- Rotor/Blade Segment: Holds the largest market share, due to the continuous innovation and technological advancements in blade design.
- Key Drivers:
- Investment Trends: Significant investments in renewable energy projects globally are boosting market growth.
- Regulatory Support: Government policies and subsidies are incentivizing wind energy adoption.
- Technological Advancements: Innovation in turbine design, materials, and manufacturing processes enhances efficiency and reduces costs.
Wind Power Equipment Market Product Innovations
Recent product innovations include advancements in blade design, leading to increased energy capture, improved turbine efficiency, and enhanced durability. The integration of smart sensors and data analytics allows for predictive maintenance and optimized operational strategies. These innovations are resulting in lower levelized cost of energy (LCOE), making wind power increasingly competitive with traditional energy sources. Unique selling propositions include longer lifespans, increased energy yield, and reduced maintenance requirements.
Propelling Factors for Wind Power Equipment Market Growth
The growth of the Wind Power Equipment Market is driven by several factors. The increasing global demand for clean energy sources, fueled by climate change concerns and stringent environmental regulations, is a primary driver. Government incentives and subsidies for renewable energy projects in many countries further stimulate market growth. Technological advancements, such as improved turbine designs and energy storage solutions, are also contributing factors. Furthermore, decreasing costs of wind energy technologies are making it increasingly competitive with fossil fuels.
Obstacles in the Wind Power Equipment Market
Despite the positive growth outlook, several challenges hinder the market's expansion. Intermittency of wind power necessitates efficient energy storage solutions, currently a significant cost and technological challenge. Supply chain disruptions, particularly related to raw materials like rare earth elements, can impact production and delivery schedules. Furthermore, intense competition among established players and new entrants leads to price pressures.
Future Opportunities in Wind Power Equipment Market
Future opportunities lie in expanding into new markets, particularly in developing economies with high energy demands and supportive government policies. Technological advancements such as floating offshore wind turbines and advancements in energy storage solutions will unlock new possibilities. The integration of wind power into smart grids and the development of hybrid renewable energy systems are promising avenues for future growth.
Major Players in the Wind Power Equipment Market Ecosystem
- Guodian United Power Technology Company Limited
- Xinjiang Goldwind Science & Technology Co Ltd
- Siemens Gamesa Renewable Energy
- Envision Energy
- Senvion SA
- Vestas Wind Systems AS
- General Electric Company
- Enercon GmbH
- Ming Yang Wind Power Group Limited
- Nordex SE
Key Developments in Wind Power Equipment Market Industry
- May 2023: Suzlon secures a 69 MW wind energy order from a Nordic Energy Company in India, deploying 23 x 3 MW WTGs with HLT towers. This highlights increasing demand in the Indian market.
- October 2022: Suzlon Group wins a 144.9 MW order from the Aditya Birla Group in India, involving 69 x 2.1 MW WTGs with HLT towers, signifying substantial growth in the Indian wind energy sector.
- January 2022: The Blue Circle and CleanTech Global Renewables Inc. secure a contract for a 1.2 GW offshore wind project in the Philippines, featuring 100 x 12 MW turbines, demonstrating the expansion of offshore wind in Southeast Asia.
Strategic Wind Power Equipment Market Forecast
The Wind Power Equipment Market is poised for significant growth over the forecast period (2025-2033). Driven by increasing demand for renewable energy, supportive government policies, and continuous technological advancements, the market is expected to experience substantial expansion. The adoption of larger turbine capacities, improved energy storage solutions, and the development of offshore wind farms will be key catalysts for future growth. The market's potential is vast, presenting lucrative opportunities for investors and industry players.
Wind Power Equipment Market Segmentation
-
1. Location
- 1.1. Onshore
- 1.2. Offshore
-
2. Equipment Type
- 2.1. Rotor/Blade
- 2.2. Tower
- 2.3. Generator
- 2.4. Other Equipment Types
Wind Power Equipment Market Segmentation By Geography
-
1. North America
- 1.1. United States of America
- 1.2. Canada
- 1.3. Rest of the North America
-
2. Europe
- 2.1. United Kingdom
- 2.2. France
- 2.3. Norway
- 2.4. Italy
- 2.5. Germany
- 2.6. Rest of the Europe
-
3. Asia Pacific
- 3.1. China
- 3.2. India
- 3.3. Japan
- 3.4. Rest of the Asia Pacific
-
4. Middle East and Africa
- 4.1. United Arab Emirates
- 4.2. Saudi Arabia
- 4.3. South Africa
- 4.4. Rest of the Middle East and Africa
-
5. South America
- 5.1. Brazil
- 5.2. Argentina
- 5.3. Rest of the South America
Wind Power Equipment Market REPORT HIGHLIGHTS
| Aspects | Details |
|---|---|
| Study Period | 2019-2033 |
| Base Year | 2024 |
| Estimated Year | 2025 |
| Forecast Period | 2025-2033 |
| Historical Period | 2019-2024 |
| Growth Rate | CAGR of 9.12% from 2019-2033 |
| Segmentation |
|
Table of Contents
- 1. Introduction
- 1.1. Research Scope
- 1.2. Market Segmentation
- 1.3. Research Methodology
- 1.4. Definitions and Assumptions
- 2. Executive Summary
- 2.1. Introduction
- 3. Market Dynamics
- 3.1. Introduction
- 3.2. Market Drivers
- 3.2.1. 4.; The Declining Cost of Wind Energy4.; Increasing Investments in the Wind Power Sector
- 3.3. Market Restrains
- 3.3.1. 4.; Substitution From Solar Energy and Gas-Fired Power Plants
- 3.4. Market Trends
- 3.4.1. Increasing Demand from Onshore Wind Power Industry
- 4. Market Factor Analysis
- 4.1. Porters Five Forces
- 4.2. Supply/Value Chain
- 4.3. PESTEL analysis
- 4.4. Market Entropy
- 4.5. Patent/Trademark Analysis
- 5. Global Wind Power Equipment Market Analysis, Insights and Forecast, 2019-2031
- 5.1. Market Analysis, Insights and Forecast - by Location
- 5.1.1. Onshore
- 5.1.2. Offshore
- 5.2. Market Analysis, Insights and Forecast - by Equipment Type
- 5.2.1. Rotor/Blade
- 5.2.2. Tower
- 5.2.3. Generator
- 5.2.4. Other Equipment Types
- 5.3. Market Analysis, Insights and Forecast - by Region
- 5.3.1. North America
- 5.3.2. Europe
- 5.3.3. Asia Pacific
- 5.3.4. Middle East and Africa
- 5.3.5. South America
- 5.1. Market Analysis, Insights and Forecast - by Location
- 6. North America Wind Power Equipment Market Analysis, Insights and Forecast, 2019-2031
- 6.1. Market Analysis, Insights and Forecast - by Location
- 6.1.1. Onshore
- 6.1.2. Offshore
- 6.2. Market Analysis, Insights and Forecast - by Equipment Type
- 6.2.1. Rotor/Blade
- 6.2.2. Tower
- 6.2.3. Generator
- 6.2.4. Other Equipment Types
- 6.1. Market Analysis, Insights and Forecast - by Location
- 7. Europe Wind Power Equipment Market Analysis, Insights and Forecast, 2019-2031
- 7.1. Market Analysis, Insights and Forecast - by Location
- 7.1.1. Onshore
- 7.1.2. Offshore
- 7.2. Market Analysis, Insights and Forecast - by Equipment Type
- 7.2.1. Rotor/Blade
- 7.2.2. Tower
- 7.2.3. Generator
- 7.2.4. Other Equipment Types
- 7.1. Market Analysis, Insights and Forecast - by Location
- 8. Asia Pacific Wind Power Equipment Market Analysis, Insights and Forecast, 2019-2031
- 8.1. Market Analysis, Insights and Forecast - by Location
- 8.1.1. Onshore
- 8.1.2. Offshore
- 8.2. Market Analysis, Insights and Forecast - by Equipment Type
- 8.2.1. Rotor/Blade
- 8.2.2. Tower
- 8.2.3. Generator
- 8.2.4. Other Equipment Types
- 8.1. Market Analysis, Insights and Forecast - by Location
- 9. Middle East and Africa Wind Power Equipment Market Analysis, Insights and Forecast, 2019-2031
- 9.1. Market Analysis, Insights and Forecast - by Location
- 9.1.1. Onshore
- 9.1.2. Offshore
- 9.2. Market Analysis, Insights and Forecast - by Equipment Type
- 9.2.1. Rotor/Blade
- 9.2.2. Tower
- 9.2.3. Generator
- 9.2.4. Other Equipment Types
- 9.1. Market Analysis, Insights and Forecast - by Location
- 10. South America Wind Power Equipment Market Analysis, Insights and Forecast, 2019-2031
- 10.1. Market Analysis, Insights and Forecast - by Location
- 10.1.1. Onshore
- 10.1.2. Offshore
- 10.2. Market Analysis, Insights and Forecast - by Equipment Type
- 10.2.1. Rotor/Blade
- 10.2.2. Tower
- 10.2.3. Generator
- 10.2.4. Other Equipment Types
- 10.1. Market Analysis, Insights and Forecast - by Location
- 11. North America Wind Power Equipment Market Analysis, Insights and Forecast, 2019-2031
- 11.1. Market Analysis, Insights and Forecast - By Country/Sub-region
- 11.1.1 United States
- 11.1.2 Canada
- 11.1.3 Mexico
- 12. Europe Wind Power Equipment Market Analysis, Insights and Forecast, 2019-2031
- 12.1. Market Analysis, Insights and Forecast - By Country/Sub-region
- 12.1.1 Germany
- 12.1.2 United Kingdom
- 12.1.3 France
- 12.1.4 Spain
- 12.1.5 Italy
- 12.1.6 Spain
- 12.1.7 Belgium
- 12.1.8 Netherland
- 12.1.9 Nordics
- 12.1.10 Rest of Europe
- 13. Asia Pacific Wind Power Equipment Market Analysis, Insights and Forecast, 2019-2031
- 13.1. Market Analysis, Insights and Forecast - By Country/Sub-region
- 13.1.1 China
- 13.1.2 Japan
- 13.1.3 India
- 13.1.4 South Korea
- 13.1.5 Southeast Asia
- 13.1.6 Australia
- 13.1.7 Indonesia
- 13.1.8 Phillipes
- 13.1.9 Singapore
- 13.1.10 Thailandc
- 13.1.11 Rest of Asia Pacific
- 14. South America Wind Power Equipment Market Analysis, Insights and Forecast, 2019-2031
- 14.1. Market Analysis, Insights and Forecast - By Country/Sub-region
- 14.1.1 Brazil
- 14.1.2 Argentina
- 14.1.3 Peru
- 14.1.4 Chile
- 14.1.5 Colombia
- 14.1.6 Ecuador
- 14.1.7 Venezuela
- 14.1.8 Rest of South America
- 15. North America Wind Power Equipment Market Analysis, Insights and Forecast, 2019-2031
- 15.1. Market Analysis, Insights and Forecast - By Country/Sub-region
- 15.1.1 United States
- 15.1.2 Canada
- 15.1.3 Mexico
- 16. MEA Wind Power Equipment Market Analysis, Insights and Forecast, 2019-2031
- 16.1. Market Analysis, Insights and Forecast - By Country/Sub-region
- 16.1.1 United Arab Emirates
- 16.1.2 Saudi Arabia
- 16.1.3 South Africa
- 16.1.4 Rest of Middle East and Africa
- 17. Competitive Analysis
- 17.1. Global Market Share Analysis 2024
- 17.2. Company Profiles
- 17.2.1 Guodian United Power Technology Company Limited
- 17.2.1.1. Overview
- 17.2.1.2. Products
- 17.2.1.3. SWOT Analysis
- 17.2.1.4. Recent Developments
- 17.2.1.5. Financials (Based on Availability)
- 17.2.2 Xinjiang Goldwind Science & Technology Co Ltd *List Not Exhaustive
- 17.2.2.1. Overview
- 17.2.2.2. Products
- 17.2.2.3. SWOT Analysis
- 17.2.2.4. Recent Developments
- 17.2.2.5. Financials (Based on Availability)
- 17.2.3 Siemens Gamesa Renewable Energy
- 17.2.3.1. Overview
- 17.2.3.2. Products
- 17.2.3.3. SWOT Analysis
- 17.2.3.4. Recent Developments
- 17.2.3.5. Financials (Based on Availability)
- 17.2.4 Envision Energy
- 17.2.4.1. Overview
- 17.2.4.2. Products
- 17.2.4.3. SWOT Analysis
- 17.2.4.4. Recent Developments
- 17.2.4.5. Financials (Based on Availability)
- 17.2.5 Senvion SA
- 17.2.5.1. Overview
- 17.2.5.2. Products
- 17.2.5.3. SWOT Analysis
- 17.2.5.4. Recent Developments
- 17.2.5.5. Financials (Based on Availability)
- 17.2.6 Vestas Wind Systems AS
- 17.2.6.1. Overview
- 17.2.6.2. Products
- 17.2.6.3. SWOT Analysis
- 17.2.6.4. Recent Developments
- 17.2.6.5. Financials (Based on Availability)
- 17.2.7 General Electric Company
- 17.2.7.1. Overview
- 17.2.7.2. Products
- 17.2.7.3. SWOT Analysis
- 17.2.7.4. Recent Developments
- 17.2.7.5. Financials (Based on Availability)
- 17.2.8 Enercon GmbH
- 17.2.8.1. Overview
- 17.2.8.2. Products
- 17.2.8.3. SWOT Analysis
- 17.2.8.4. Recent Developments
- 17.2.8.5. Financials (Based on Availability)
- 17.2.9 Ming Yang Wind Power Group Limited
- 17.2.9.1. Overview
- 17.2.9.2. Products
- 17.2.9.3. SWOT Analysis
- 17.2.9.4. Recent Developments
- 17.2.9.5. Financials (Based on Availability)
- 17.2.10 Nordex SE
- 17.2.10.1. Overview
- 17.2.10.2. Products
- 17.2.10.3. SWOT Analysis
- 17.2.10.4. Recent Developments
- 17.2.10.5. Financials (Based on Availability)
- 17.2.1 Guodian United Power Technology Company Limited
List of Figures
- Figure 1: Global Wind Power Equipment Market Revenue Breakdown (Million, %) by Region 2024 & 2032
- Figure 2: Global Wind Power Equipment Market Volume Breakdown (K Units, %) by Region 2024 & 2032
- Figure 3: North America Wind Power Equipment Market Revenue (Million), by Country 2024 & 2032
- Figure 4: North America Wind Power Equipment Market Volume (K Units), by Country 2024 & 2032
- Figure 5: North America Wind Power Equipment Market Revenue Share (%), by Country 2024 & 2032
- Figure 6: North America Wind Power Equipment Market Volume Share (%), by Country 2024 & 2032
- Figure 7: Europe Wind Power Equipment Market Revenue (Million), by Country 2024 & 2032
- Figure 8: Europe Wind Power Equipment Market Volume (K Units), by Country 2024 & 2032
- Figure 9: Europe Wind Power Equipment Market Revenue Share (%), by Country 2024 & 2032
- Figure 10: Europe Wind Power Equipment Market Volume Share (%), by Country 2024 & 2032
- Figure 11: Asia Pacific Wind Power Equipment Market Revenue (Million), by Country 2024 & 2032
- Figure 12: Asia Pacific Wind Power Equipment Market Volume (K Units), by Country 2024 & 2032
- Figure 13: Asia Pacific Wind Power Equipment Market Revenue Share (%), by Country 2024 & 2032
- Figure 14: Asia Pacific Wind Power Equipment Market Volume Share (%), by Country 2024 & 2032
- Figure 15: South America Wind Power Equipment Market Revenue (Million), by Country 2024 & 2032
- Figure 16: South America Wind Power Equipment Market Volume (K Units), by Country 2024 & 2032
- Figure 17: South America Wind Power Equipment Market Revenue Share (%), by Country 2024 & 2032
- Figure 18: South America Wind Power Equipment Market Volume Share (%), by Country 2024 & 2032
- Figure 19: North America Wind Power Equipment Market Revenue (Million), by Country 2024 & 2032
- Figure 20: North America Wind Power Equipment Market Volume (K Units), by Country 2024 & 2032
- Figure 21: North America Wind Power Equipment Market Revenue Share (%), by Country 2024 & 2032
- Figure 22: North America Wind Power Equipment Market Volume Share (%), by Country 2024 & 2032
- Figure 23: MEA Wind Power Equipment Market Revenue (Million), by Country 2024 & 2032
- Figure 24: MEA Wind Power Equipment Market Volume (K Units), by Country 2024 & 2032
- Figure 25: MEA Wind Power Equipment Market Revenue Share (%), by Country 2024 & 2032
- Figure 26: MEA Wind Power Equipment Market Volume Share (%), by Country 2024 & 2032
- Figure 27: North America Wind Power Equipment Market Revenue (Million), by Location 2024 & 2032
- Figure 28: North America Wind Power Equipment Market Volume (K Units), by Location 2024 & 2032
- Figure 29: North America Wind Power Equipment Market Revenue Share (%), by Location 2024 & 2032
- Figure 30: North America Wind Power Equipment Market Volume Share (%), by Location 2024 & 2032
- Figure 31: North America Wind Power Equipment Market Revenue (Million), by Equipment Type 2024 & 2032
- Figure 32: North America Wind Power Equipment Market Volume (K Units), by Equipment Type 2024 & 2032
- Figure 33: North America Wind Power Equipment Market Revenue Share (%), by Equipment Type 2024 & 2032
- Figure 34: North America Wind Power Equipment Market Volume Share (%), by Equipment Type 2024 & 2032
- Figure 35: North America Wind Power Equipment Market Revenue (Million), by Country 2024 & 2032
- Figure 36: North America Wind Power Equipment Market Volume (K Units), by Country 2024 & 2032
- Figure 37: North America Wind Power Equipment Market Revenue Share (%), by Country 2024 & 2032
- Figure 38: North America Wind Power Equipment Market Volume Share (%), by Country 2024 & 2032
- Figure 39: Europe Wind Power Equipment Market Revenue (Million), by Location 2024 & 2032
- Figure 40: Europe Wind Power Equipment Market Volume (K Units), by Location 2024 & 2032
- Figure 41: Europe Wind Power Equipment Market Revenue Share (%), by Location 2024 & 2032
- Figure 42: Europe Wind Power Equipment Market Volume Share (%), by Location 2024 & 2032
- Figure 43: Europe Wind Power Equipment Market Revenue (Million), by Equipment Type 2024 & 2032
- Figure 44: Europe Wind Power Equipment Market Volume (K Units), by Equipment Type 2024 & 2032
- Figure 45: Europe Wind Power Equipment Market Revenue Share (%), by Equipment Type 2024 & 2032
- Figure 46: Europe Wind Power Equipment Market Volume Share (%), by Equipment Type 2024 & 2032
- Figure 47: Europe Wind Power Equipment Market Revenue (Million), by Country 2024 & 2032
- Figure 48: Europe Wind Power Equipment Market Volume (K Units), by Country 2024 & 2032
- Figure 49: Europe Wind Power Equipment Market Revenue Share (%), by Country 2024 & 2032
- Figure 50: Europe Wind Power Equipment Market Volume Share (%), by Country 2024 & 2032
- Figure 51: Asia Pacific Wind Power Equipment Market Revenue (Million), by Location 2024 & 2032
- Figure 52: Asia Pacific Wind Power Equipment Market Volume (K Units), by Location 2024 & 2032
- Figure 53: Asia Pacific Wind Power Equipment Market Revenue Share (%), by Location 2024 & 2032
- Figure 54: Asia Pacific Wind Power Equipment Market Volume Share (%), by Location 2024 & 2032
- Figure 55: Asia Pacific Wind Power Equipment Market Revenue (Million), by Equipment Type 2024 & 2032
- Figure 56: Asia Pacific Wind Power Equipment Market Volume (K Units), by Equipment Type 2024 & 2032
- Figure 57: Asia Pacific Wind Power Equipment Market Revenue Share (%), by Equipment Type 2024 & 2032
- Figure 58: Asia Pacific Wind Power Equipment Market Volume Share (%), by Equipment Type 2024 & 2032
- Figure 59: Asia Pacific Wind Power Equipment Market Revenue (Million), by Country 2024 & 2032
- Figure 60: Asia Pacific Wind Power Equipment Market Volume (K Units), by Country 2024 & 2032
- Figure 61: Asia Pacific Wind Power Equipment Market Revenue Share (%), by Country 2024 & 2032
- Figure 62: Asia Pacific Wind Power Equipment Market Volume Share (%), by Country 2024 & 2032
- Figure 63: Middle East and Africa Wind Power Equipment Market Revenue (Million), by Location 2024 & 2032
- Figure 64: Middle East and Africa Wind Power Equipment Market Volume (K Units), by Location 2024 & 2032
- Figure 65: Middle East and Africa Wind Power Equipment Market Revenue Share (%), by Location 2024 & 2032
- Figure 66: Middle East and Africa Wind Power Equipment Market Volume Share (%), by Location 2024 & 2032
- Figure 67: Middle East and Africa Wind Power Equipment Market Revenue (Million), by Equipment Type 2024 & 2032
- Figure 68: Middle East and Africa Wind Power Equipment Market Volume (K Units), by Equipment Type 2024 & 2032
- Figure 69: Middle East and Africa Wind Power Equipment Market Revenue Share (%), by Equipment Type 2024 & 2032
- Figure 70: Middle East and Africa Wind Power Equipment Market Volume Share (%), by Equipment Type 2024 & 2032
- Figure 71: Middle East and Africa Wind Power Equipment Market Revenue (Million), by Country 2024 & 2032
- Figure 72: Middle East and Africa Wind Power Equipment Market Volume (K Units), by Country 2024 & 2032
- Figure 73: Middle East and Africa Wind Power Equipment Market Revenue Share (%), by Country 2024 & 2032
- Figure 74: Middle East and Africa Wind Power Equipment Market Volume Share (%), by Country 2024 & 2032
- Figure 75: South America Wind Power Equipment Market Revenue (Million), by Location 2024 & 2032
- Figure 76: South America Wind Power Equipment Market Volume (K Units), by Location 2024 & 2032
- Figure 77: South America Wind Power Equipment Market Revenue Share (%), by Location 2024 & 2032
- Figure 78: South America Wind Power Equipment Market Volume Share (%), by Location 2024 & 2032
- Figure 79: South America Wind Power Equipment Market Revenue (Million), by Equipment Type 2024 & 2032
- Figure 80: South America Wind Power Equipment Market Volume (K Units), by Equipment Type 2024 & 2032
- Figure 81: South America Wind Power Equipment Market Revenue Share (%), by Equipment Type 2024 & 2032
- Figure 82: South America Wind Power Equipment Market Volume Share (%), by Equipment Type 2024 & 2032
- Figure 83: South America Wind Power Equipment Market Revenue (Million), by Country 2024 & 2032
- Figure 84: South America Wind Power Equipment Market Volume (K Units), by Country 2024 & 2032
- Figure 85: South America Wind Power Equipment Market Revenue Share (%), by Country 2024 & 2032
- Figure 86: South America Wind Power Equipment Market Volume Share (%), by Country 2024 & 2032
List of Tables
- Table 1: Global Wind Power Equipment Market Revenue Million Forecast, by Region 2019 & 2032
- Table 2: Global Wind Power Equipment Market Volume K Units Forecast, by Region 2019 & 2032
- Table 3: Global Wind Power Equipment Market Revenue Million Forecast, by Location 2019 & 2032
- Table 4: Global Wind Power Equipment Market Volume K Units Forecast, by Location 2019 & 2032
- Table 5: Global Wind Power Equipment Market Revenue Million Forecast, by Equipment Type 2019 & 2032
- Table 6: Global Wind Power Equipment Market Volume K Units Forecast, by Equipment Type 2019 & 2032
- Table 7: Global Wind Power Equipment Market Revenue Million Forecast, by Region 2019 & 2032
- Table 8: Global Wind Power Equipment Market Volume K Units Forecast, by Region 2019 & 2032
- Table 9: Global Wind Power Equipment Market Revenue Million Forecast, by Country 2019 & 2032
- Table 10: Global Wind Power Equipment Market Volume K Units Forecast, by Country 2019 & 2032
- Table 11: United States Wind Power Equipment Market Revenue (Million) Forecast, by Application 2019 & 2032
- Table 12: United States Wind Power Equipment Market Volume (K Units) Forecast, by Application 2019 & 2032
- Table 13: Canada Wind Power Equipment Market Revenue (Million) Forecast, by Application 2019 & 2032
- Table 14: Canada Wind Power Equipment Market Volume (K Units) Forecast, by Application 2019 & 2032
- Table 15: Mexico Wind Power Equipment Market Revenue (Million) Forecast, by Application 2019 & 2032
- Table 16: Mexico Wind Power Equipment Market Volume (K Units) Forecast, by Application 2019 & 2032
- Table 17: Global Wind Power Equipment Market Revenue Million Forecast, by Country 2019 & 2032
- Table 18: Global Wind Power Equipment Market Volume K Units Forecast, by Country 2019 & 2032
- Table 19: Germany Wind Power Equipment Market Revenue (Million) Forecast, by Application 2019 & 2032
- Table 20: Germany Wind Power Equipment Market Volume (K Units) Forecast, by Application 2019 & 2032
- Table 21: United Kingdom Wind Power Equipment Market Revenue (Million) Forecast, by Application 2019 & 2032
- Table 22: United Kingdom Wind Power Equipment Market Volume (K Units) Forecast, by Application 2019 & 2032
- Table 23: France Wind Power Equipment Market Revenue (Million) Forecast, by Application 2019 & 2032
- Table 24: France Wind Power Equipment Market Volume (K Units) Forecast, by Application 2019 & 2032
- Table 25: Spain Wind Power Equipment Market Revenue (Million) Forecast, by Application 2019 & 2032
- Table 26: Spain Wind Power Equipment Market Volume (K Units) Forecast, by Application 2019 & 2032
- Table 27: Italy Wind Power Equipment Market Revenue (Million) Forecast, by Application 2019 & 2032
- Table 28: Italy Wind Power Equipment Market Volume (K Units) Forecast, by Application 2019 & 2032
- Table 29: Spain Wind Power Equipment Market Revenue (Million) Forecast, by Application 2019 & 2032
- Table 30: Spain Wind Power Equipment Market Volume (K Units) Forecast, by Application 2019 & 2032
- Table 31: Belgium Wind Power Equipment Market Revenue (Million) Forecast, by Application 2019 & 2032
- Table 32: Belgium Wind Power Equipment Market Volume (K Units) Forecast, by Application 2019 & 2032
- Table 33: Netherland Wind Power Equipment Market Revenue (Million) Forecast, by Application 2019 & 2032
- Table 34: Netherland Wind Power Equipment Market Volume (K Units) Forecast, by Application 2019 & 2032
- Table 35: Nordics Wind Power Equipment Market Revenue (Million) Forecast, by Application 2019 & 2032
- Table 36: Nordics Wind Power Equipment Market Volume (K Units) Forecast, by Application 2019 & 2032
- Table 37: Rest of Europe Wind Power Equipment Market Revenue (Million) Forecast, by Application 2019 & 2032
- Table 38: Rest of Europe Wind Power Equipment Market Volume (K Units) Forecast, by Application 2019 & 2032
- Table 39: Global Wind Power Equipment Market Revenue Million Forecast, by Country 2019 & 2032
- Table 40: Global Wind Power Equipment Market Volume K Units Forecast, by Country 2019 & 2032
- Table 41: China Wind Power Equipment Market Revenue (Million) Forecast, by Application 2019 & 2032
- Table 42: China Wind Power Equipment Market Volume (K Units) Forecast, by Application 2019 & 2032
- Table 43: Japan Wind Power Equipment Market Revenue (Million) Forecast, by Application 2019 & 2032
- Table 44: Japan Wind Power Equipment Market Volume (K Units) Forecast, by Application 2019 & 2032
- Table 45: India Wind Power Equipment Market Revenue (Million) Forecast, by Application 2019 & 2032
- Table 46: India Wind Power Equipment Market Volume (K Units) Forecast, by Application 2019 & 2032
- Table 47: South Korea Wind Power Equipment Market Revenue (Million) Forecast, by Application 2019 & 2032
- Table 48: South Korea Wind Power Equipment Market Volume (K Units) Forecast, by Application 2019 & 2032
- Table 49: Southeast Asia Wind Power Equipment Market Revenue (Million) Forecast, by Application 2019 & 2032
- Table 50: Southeast Asia Wind Power Equipment Market Volume (K Units) Forecast, by Application 2019 & 2032
- Table 51: Australia Wind Power Equipment Market Revenue (Million) Forecast, by Application 2019 & 2032
- Table 52: Australia Wind Power Equipment Market Volume (K Units) Forecast, by Application 2019 & 2032
- Table 53: Indonesia Wind Power Equipment Market Revenue (Million) Forecast, by Application 2019 & 2032
- Table 54: Indonesia Wind Power Equipment Market Volume (K Units) Forecast, by Application 2019 & 2032
- Table 55: Phillipes Wind Power Equipment Market Revenue (Million) Forecast, by Application 2019 & 2032
- Table 56: Phillipes Wind Power Equipment Market Volume (K Units) Forecast, by Application 2019 & 2032
- Table 57: Singapore Wind Power Equipment Market Revenue (Million) Forecast, by Application 2019 & 2032
- Table 58: Singapore Wind Power Equipment Market Volume (K Units) Forecast, by Application 2019 & 2032
- Table 59: Thailandc Wind Power Equipment Market Revenue (Million) Forecast, by Application 2019 & 2032
- Table 60: Thailandc Wind Power Equipment Market Volume (K Units) Forecast, by Application 2019 & 2032
- Table 61: Rest of Asia Pacific Wind Power Equipment Market Revenue (Million) Forecast, by Application 2019 & 2032
- Table 62: Rest of Asia Pacific Wind Power Equipment Market Volume (K Units) Forecast, by Application 2019 & 2032
- Table 63: Global Wind Power Equipment Market Revenue Million Forecast, by Country 2019 & 2032
- Table 64: Global Wind Power Equipment Market Volume K Units Forecast, by Country 2019 & 2032
- Table 65: Brazil Wind Power Equipment Market Revenue (Million) Forecast, by Application 2019 & 2032
- Table 66: Brazil Wind Power Equipment Market Volume (K Units) Forecast, by Application 2019 & 2032
- Table 67: Argentina Wind Power Equipment Market Revenue (Million) Forecast, by Application 2019 & 2032
- Table 68: Argentina Wind Power Equipment Market Volume (K Units) Forecast, by Application 2019 & 2032
- Table 69: Peru Wind Power Equipment Market Revenue (Million) Forecast, by Application 2019 & 2032
- Table 70: Peru Wind Power Equipment Market Volume (K Units) Forecast, by Application 2019 & 2032
- Table 71: Chile Wind Power Equipment Market Revenue (Million) Forecast, by Application 2019 & 2032
- Table 72: Chile Wind Power Equipment Market Volume (K Units) Forecast, by Application 2019 & 2032
- Table 73: Colombia Wind Power Equipment Market Revenue (Million) Forecast, by Application 2019 & 2032
- Table 74: Colombia Wind Power Equipment Market Volume (K Units) Forecast, by Application 2019 & 2032
- Table 75: Ecuador Wind Power Equipment Market Revenue (Million) Forecast, by Application 2019 & 2032
- Table 76: Ecuador Wind Power Equipment Market Volume (K Units) Forecast, by Application 2019 & 2032
- Table 77: Venezuela Wind Power Equipment Market Revenue (Million) Forecast, by Application 2019 & 2032
- Table 78: Venezuela Wind Power Equipment Market Volume (K Units) Forecast, by Application 2019 & 2032
- Table 79: Rest of South America Wind Power Equipment Market Revenue (Million) Forecast, by Application 2019 & 2032
- Table 80: Rest of South America Wind Power Equipment Market Volume (K Units) Forecast, by Application 2019 & 2032
- Table 81: Global Wind Power Equipment Market Revenue Million Forecast, by Country 2019 & 2032
- Table 82: Global Wind Power Equipment Market Volume K Units Forecast, by Country 2019 & 2032
- Table 83: United States Wind Power Equipment Market Revenue (Million) Forecast, by Application 2019 & 2032
- Table 84: United States Wind Power Equipment Market Volume (K Units) Forecast, by Application 2019 & 2032
- Table 85: Canada Wind Power Equipment Market Revenue (Million) Forecast, by Application 2019 & 2032
- Table 86: Canada Wind Power Equipment Market Volume (K Units) Forecast, by Application 2019 & 2032
- Table 87: Mexico Wind Power Equipment Market Revenue (Million) Forecast, by Application 2019 & 2032
- Table 88: Mexico Wind Power Equipment Market Volume (K Units) Forecast, by Application 2019 & 2032
- Table 89: Global Wind Power Equipment Market Revenue Million Forecast, by Country 2019 & 2032
- Table 90: Global Wind Power Equipment Market Volume K Units Forecast, by Country 2019 & 2032
- Table 91: United Arab Emirates Wind Power Equipment Market Revenue (Million) Forecast, by Application 2019 & 2032
- Table 92: United Arab Emirates Wind Power Equipment Market Volume (K Units) Forecast, by Application 2019 & 2032
- Table 93: Saudi Arabia Wind Power Equipment Market Revenue (Million) Forecast, by Application 2019 & 2032
- Table 94: Saudi Arabia Wind Power Equipment Market Volume (K Units) Forecast, by Application 2019 & 2032
- Table 95: South Africa Wind Power Equipment Market Revenue (Million) Forecast, by Application 2019 & 2032
- Table 96: South Africa Wind Power Equipment Market Volume (K Units) Forecast, by Application 2019 & 2032
- Table 97: Rest of Middle East and Africa Wind Power Equipment Market Revenue (Million) Forecast, by Application 2019 & 2032
- Table 98: Rest of Middle East and Africa Wind Power Equipment Market Volume (K Units) Forecast, by Application 2019 & 2032
- Table 99: Global Wind Power Equipment Market Revenue Million Forecast, by Location 2019 & 2032
- Table 100: Global Wind Power Equipment Market Volume K Units Forecast, by Location 2019 & 2032
- Table 101: Global Wind Power Equipment Market Revenue Million Forecast, by Equipment Type 2019 & 2032
- Table 102: Global Wind Power Equipment Market Volume K Units Forecast, by Equipment Type 2019 & 2032
- Table 103: Global Wind Power Equipment Market Revenue Million Forecast, by Country 2019 & 2032
- Table 104: Global Wind Power Equipment Market Volume K Units Forecast, by Country 2019 & 2032
- Table 105: United States of America Wind Power Equipment Market Revenue (Million) Forecast, by Application 2019 & 2032
- Table 106: United States of America Wind Power Equipment Market Volume (K Units) Forecast, by Application 2019 & 2032
- Table 107: Canada Wind Power Equipment Market Revenue (Million) Forecast, by Application 2019 & 2032
- Table 108: Canada Wind Power Equipment Market Volume (K Units) Forecast, by Application 2019 & 2032
- Table 109: Rest of the North America Wind Power Equipment Market Revenue (Million) Forecast, by Application 2019 & 2032
- Table 110: Rest of the North America Wind Power Equipment Market Volume (K Units) Forecast, by Application 2019 & 2032
- Table 111: Global Wind Power Equipment Market Revenue Million Forecast, by Location 2019 & 2032
- Table 112: Global Wind Power Equipment Market Volume K Units Forecast, by Location 2019 & 2032
- Table 113: Global Wind Power Equipment Market Revenue Million Forecast, by Equipment Type 2019 & 2032
- Table 114: Global Wind Power Equipment Market Volume K Units Forecast, by Equipment Type 2019 & 2032
- Table 115: Global Wind Power Equipment Market Revenue Million Forecast, by Country 2019 & 2032
- Table 116: Global Wind Power Equipment Market Volume K Units Forecast, by Country 2019 & 2032
- Table 117: United Kingdom Wind Power Equipment Market Revenue (Million) Forecast, by Application 2019 & 2032
- Table 118: United Kingdom Wind Power Equipment Market Volume (K Units) Forecast, by Application 2019 & 2032
- Table 119: France Wind Power Equipment Market Revenue (Million) Forecast, by Application 2019 & 2032
- Table 120: France Wind Power Equipment Market Volume (K Units) Forecast, by Application 2019 & 2032
- Table 121: Norway Wind Power Equipment Market Revenue (Million) Forecast, by Application 2019 & 2032
- Table 122: Norway Wind Power Equipment Market Volume (K Units) Forecast, by Application 2019 & 2032
- Table 123: Italy Wind Power Equipment Market Revenue (Million) Forecast, by Application 2019 & 2032
- Table 124: Italy Wind Power Equipment Market Volume (K Units) Forecast, by Application 2019 & 2032
- Table 125: Germany Wind Power Equipment Market Revenue (Million) Forecast, by Application 2019 & 2032
- Table 126: Germany Wind Power Equipment Market Volume (K Units) Forecast, by Application 2019 & 2032
- Table 127: Rest of the Europe Wind Power Equipment Market Revenue (Million) Forecast, by Application 2019 & 2032
- Table 128: Rest of the Europe Wind Power Equipment Market Volume (K Units) Forecast, by Application 2019 & 2032
- Table 129: Global Wind Power Equipment Market Revenue Million Forecast, by Location 2019 & 2032
- Table 130: Global Wind Power Equipment Market Volume K Units Forecast, by Location 2019 & 2032
- Table 131: Global Wind Power Equipment Market Revenue Million Forecast, by Equipment Type 2019 & 2032
- Table 132: Global Wind Power Equipment Market Volume K Units Forecast, by Equipment Type 2019 & 2032
- Table 133: Global Wind Power Equipment Market Revenue Million Forecast, by Country 2019 & 2032
- Table 134: Global Wind Power Equipment Market Volume K Units Forecast, by Country 2019 & 2032
- Table 135: China Wind Power Equipment Market Revenue (Million) Forecast, by Application 2019 & 2032
- Table 136: China Wind Power Equipment Market Volume (K Units) Forecast, by Application 2019 & 2032
- Table 137: India Wind Power Equipment Market Revenue (Million) Forecast, by Application 2019 & 2032
- Table 138: India Wind Power Equipment Market Volume (K Units) Forecast, by Application 2019 & 2032
- Table 139: Japan Wind Power Equipment Market Revenue (Million) Forecast, by Application 2019 & 2032
- Table 140: Japan Wind Power Equipment Market Volume (K Units) Forecast, by Application 2019 & 2032
- Table 141: Rest of the Asia Pacific Wind Power Equipment Market Revenue (Million) Forecast, by Application 2019 & 2032
- Table 142: Rest of the Asia Pacific Wind Power Equipment Market Volume (K Units) Forecast, by Application 2019 & 2032
- Table 143: Global Wind Power Equipment Market Revenue Million Forecast, by Location 2019 & 2032
- Table 144: Global Wind Power Equipment Market Volume K Units Forecast, by Location 2019 & 2032
- Table 145: Global Wind Power Equipment Market Revenue Million Forecast, by Equipment Type 2019 & 2032
- Table 146: Global Wind Power Equipment Market Volume K Units Forecast, by Equipment Type 2019 & 2032
- Table 147: Global Wind Power Equipment Market Revenue Million Forecast, by Country 2019 & 2032
- Table 148: Global Wind Power Equipment Market Volume K Units Forecast, by Country 2019 & 2032
- Table 149: United Arab Emirates Wind Power Equipment Market Revenue (Million) Forecast, by Application 2019 & 2032
- Table 150: United Arab Emirates Wind Power Equipment Market Volume (K Units) Forecast, by Application 2019 & 2032
- Table 151: Saudi Arabia Wind Power Equipment Market Revenue (Million) Forecast, by Application 2019 & 2032
- Table 152: Saudi Arabia Wind Power Equipment Market Volume (K Units) Forecast, by Application 2019 & 2032
- Table 153: South Africa Wind Power Equipment Market Revenue (Million) Forecast, by Application 2019 & 2032
- Table 154: South Africa Wind Power Equipment Market Volume (K Units) Forecast, by Application 2019 & 2032
- Table 155: Rest of the Middle East and Africa Wind Power Equipment Market Revenue (Million) Forecast, by Application 2019 & 2032
- Table 156: Rest of the Middle East and Africa Wind Power Equipment Market Volume (K Units) Forecast, by Application 2019 & 2032
- Table 157: Global Wind Power Equipment Market Revenue Million Forecast, by Location 2019 & 2032
- Table 158: Global Wind Power Equipment Market Volume K Units Forecast, by Location 2019 & 2032
- Table 159: Global Wind Power Equipment Market Revenue Million Forecast, by Equipment Type 2019 & 2032
- Table 160: Global Wind Power Equipment Market Volume K Units Forecast, by Equipment Type 2019 & 2032
- Table 161: Global Wind Power Equipment Market Revenue Million Forecast, by Country 2019 & 2032
- Table 162: Global Wind Power Equipment Market Volume K Units Forecast, by Country 2019 & 2032
- Table 163: Brazil Wind Power Equipment Market Revenue (Million) Forecast, by Application 2019 & 2032
- Table 164: Brazil Wind Power Equipment Market Volume (K Units) Forecast, by Application 2019 & 2032
- Table 165: Argentina Wind Power Equipment Market Revenue (Million) Forecast, by Application 2019 & 2032
- Table 166: Argentina Wind Power Equipment Market Volume (K Units) Forecast, by Application 2019 & 2032
- Table 167: Rest of the South America Wind Power Equipment Market Revenue (Million) Forecast, by Application 2019 & 2032
- Table 168: Rest of the South America Wind Power Equipment Market Volume (K Units) Forecast, by Application 2019 & 2032
Frequently Asked Questions
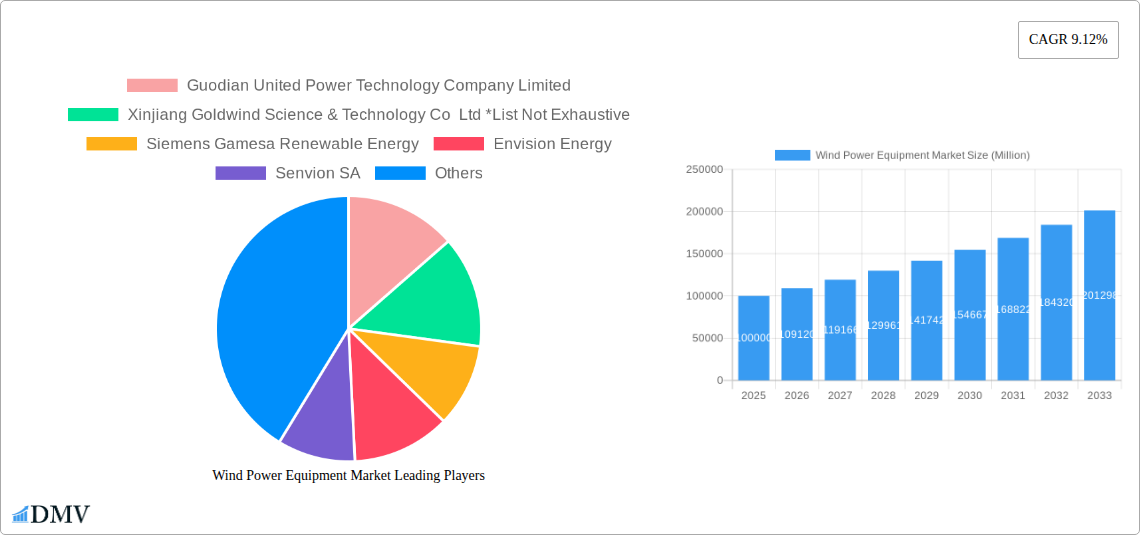
1. What is the projected Compound Annual Growth Rate (CAGR) of the Wind Power Equipment Market?
The projected CAGR is approximately 9.12%.
2. Which companies are prominent players in the Wind Power Equipment Market?
Key companies in the market include Guodian United Power Technology Company Limited, Xinjiang Goldwind Science & Technology Co Ltd *List Not Exhaustive, Siemens Gamesa Renewable Energy, Envision Energy, Senvion SA, Vestas Wind Systems AS, General Electric Company, Enercon GmbH, Ming Yang Wind Power Group Limited, Nordex SE.
3. What are the main segments of the Wind Power Equipment Market?
The market segments include Location, Equipment Type.
4. Can you provide details about the market size?
The market size is estimated to be USD XX Million as of 2022.
5. What are some drivers contributing to market growth?
4.; The Declining Cost of Wind Energy4.; Increasing Investments in the Wind Power Sector.
6. What are the notable trends driving market growth?
Increasing Demand from Onshore Wind Power Industry.
7. Are there any restraints impacting market growth?
4.; Substitution From Solar Energy and Gas-Fired Power Plants.
8. Can you provide examples of recent developments in the market?
May 2023: Suzlon, a developer of renewable energy solutions, has received a 69 MW wind energy order from the Indian division of a renowned Nordic Energy Company. Suzlon will deploy 23 wind turbine generators (WTGs) with 3 MW rated capacity and a Hybrid Lattice Tubular (HLT) tower.
9. What pricing options are available for accessing the report?
Pricing options include single-user, multi-user, and enterprise licenses priced at USD 4750, USD 5250, and USD 8750 respectively.
10. Is the market size provided in terms of value or volume?
The market size is provided in terms of value, measured in Million and volume, measured in K Units.
11. Are there any specific market keywords associated with the report?
Yes, the market keyword associated with the report is "Wind Power Equipment Market," which aids in identifying and referencing the specific market segment covered.
12. How do I determine which pricing option suits my needs best?
The pricing options vary based on user requirements and access needs. Individual users may opt for single-user licenses, while businesses requiring broader access may choose multi-user or enterprise licenses for cost-effective access to the report.
13. Are there any additional resources or data provided in the Wind Power Equipment Market report?
While the report offers comprehensive insights, it's advisable to review the specific contents or supplementary materials provided to ascertain if additional resources or data are available.
14. How can I stay updated on further developments or reports in the Wind Power Equipment Market?
To stay informed about further developments, trends, and reports in the Wind Power Equipment Market, consider subscribing to industry newsletters, following relevant companies and organizations, or regularly checking reputable industry news sources and publications.
Methodology
Step 1 - Identification of Relevant Samples Size from Population Database


Step 2 - Approaches for Defining Global Market Size (Value, Volume* & Price*)

Note*: In applicable scenarios
Step 3 - Data Sources
Primary Research
- Web Analytics
- Survey Reports
- Research Institute
- Latest Research Reports
- Opinion Leaders
Secondary Research
- Annual Reports
- White Paper
- Latest Press Release
- Industry Association
- Paid Database
- Investor Presentations

Step 4 - Data Triangulation
Involves using different sources of information in order to increase the validity of a study
These sources are likely to be stakeholders in a program - participants, other researchers, program staff, other community members, and so on.
Then we put all data in single framework & apply various statistical tools to find out the dynamic on the market.
During the analysis stage, feedback from the stakeholder groups would be compared to determine areas of agreement as well as areas of divergence
