

Key Insights
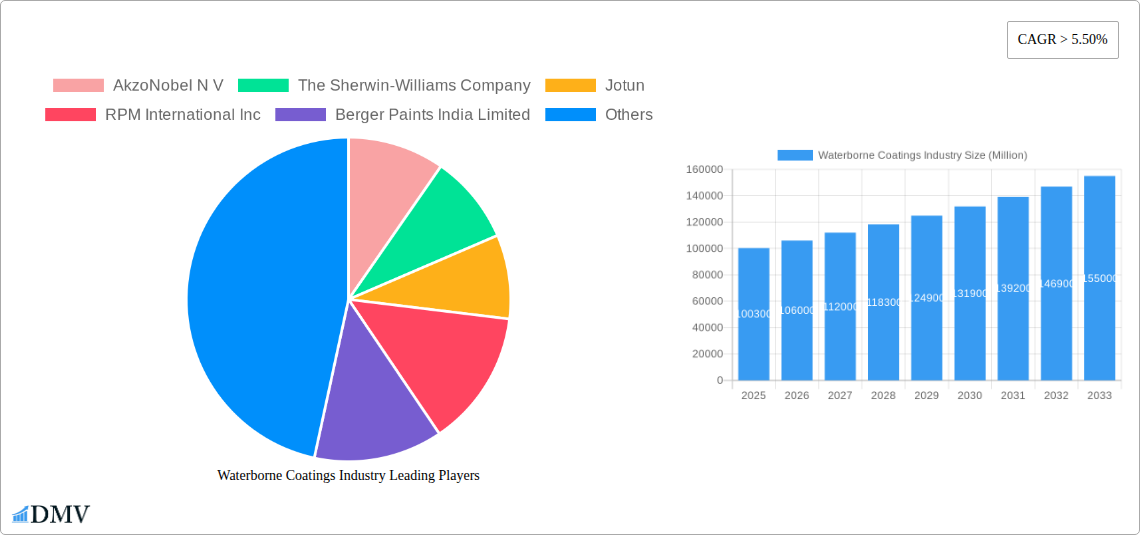
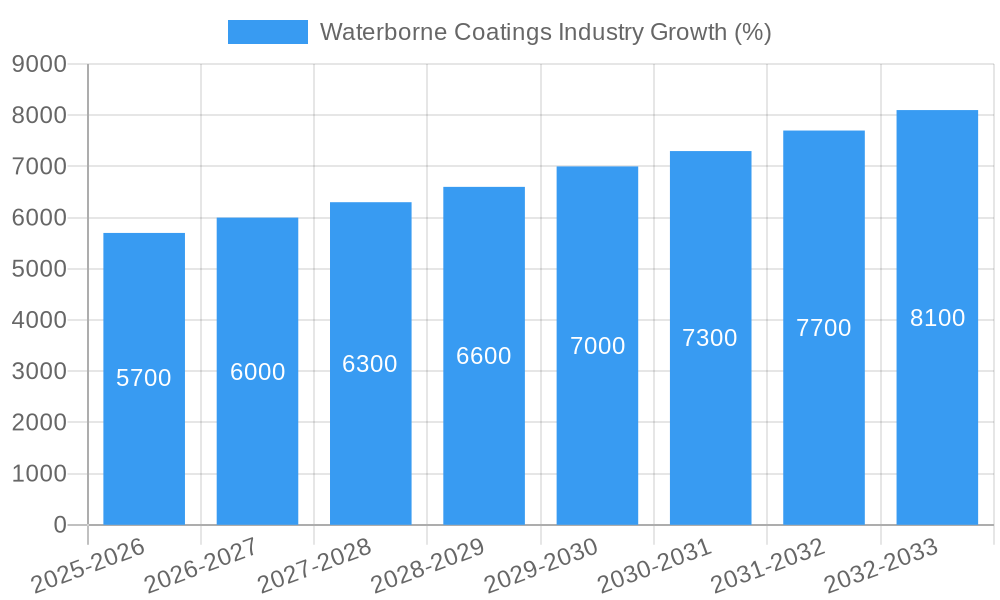
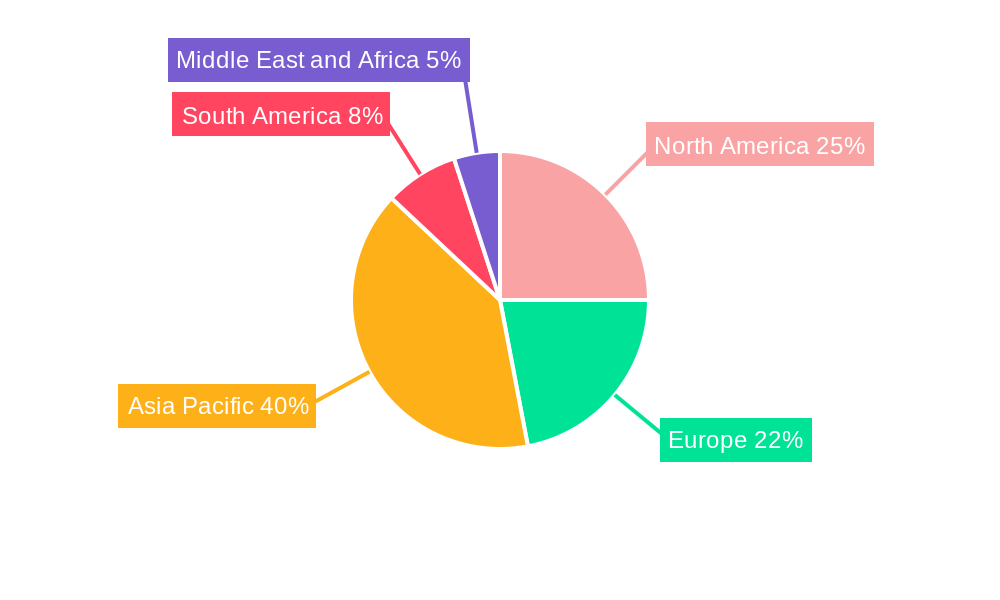
The global waterborne coatings market, valued at $100.3 billion in 2025, is projected to experience robust growth, exhibiting a Compound Annual Growth Rate (CAGR) exceeding 5.5% from 2025 to 2033. This expansion is driven by several key factors. The increasing demand for eco-friendly and sustainable coatings across various end-use industries, particularly building and construction and automotive, is a primary driver. Stringent environmental regulations globally are pushing manufacturers to adopt waterborne coatings due to their lower volatile organic compound (VOC) emissions compared to solvent-based alternatives. Furthermore, advancements in resin technology, leading to improved performance characteristics such as durability, adhesion, and faster drying times, are boosting market adoption. The Asia-Pacific region, spearheaded by strong growth in China and India's construction sectors, is expected to dominate the market share, followed by North America and Europe. Growth within specific resin types like acrylics and polyurethanes will also contribute significantly to overall market expansion. However, price volatility of raw materials and potential economic slowdowns in certain regions could act as restraints on market growth.
The competitive landscape is characterized by a mix of multinational corporations and regional players. Key players like AkzoNobel, Sherwin-Williams, and PPG Industries are investing heavily in research and development to improve their product portfolios and expand their geographical reach. The market is also witnessing increased consolidation through mergers and acquisitions as companies seek to strengthen their market positions and gain access to new technologies. The increasing adoption of sustainable manufacturing practices and the development of high-performance waterborne coatings tailored to specific applications will be crucial factors shaping the market's future trajectory. Future market success will hinge on companies' ability to innovate, meet evolving environmental regulations, and effectively cater to the specific needs of diverse end-user industries.
Waterborne Coatings Industry: A Comprehensive Market Analysis (2019-2033)
This insightful report provides a detailed analysis of the global waterborne coatings industry, offering a comprehensive overview of market dynamics, key players, and future growth prospects. Valued at $XX Million in 2025, the market is poised for significant expansion, reaching $XX Million by 2033. This report covers the period from 2019 to 2033, with 2025 serving as both the base and estimated year. The forecast period spans 2025-2033, while the historical period encompasses 2019-2024.
Waterborne Coatings Industry Market Composition & Trends
This section delves into the intricate structure of the waterborne coatings market, analyzing its competitive landscape, innovation drivers, and regulatory influences. We examine market concentration, revealing the market share distribution amongst key players such as AkzoNobel N V, The Sherwin-Williams Company, Jotun, and PPG Industries Inc. The report also explores the impact of mergers and acquisitions (M&A) activities, detailing notable deals and their valuations (e.g., a $XX Million acquisition in 2023). Furthermore, we analyze the role of regulatory landscapes, examining their influence on product development and market access. The impact of substitute products and evolving end-user preferences across segments like building and construction, automotive, and industrial applications are thoroughly assessed.
- Market Share Distribution: AkzoNobel N V holds approximately XX% market share, followed by Sherwin-Williams with XX%, and Jotun with XX%. The remaining share is distributed amongst other significant players.
- M&A Activity: Significant M&A activity observed in the period 2019-2024 resulted in a combined deal value exceeding $XX Million, significantly shaping the competitive landscape.
- Innovation Catalysts: Stringent environmental regulations are driving innovation towards low-VOC waterborne coatings, while increasing demand for high-performance coatings is prompting the development of advanced formulations.
- End-User Profiles: The building and construction sector remains the largest end-user, accounting for approximately XX% of total demand.
Waterborne Coatings Industry Evolution
This section traces the evolutionary trajectory of the waterborne coatings market, examining market growth trajectories, technological advancements, and evolving consumer preferences. We present detailed data on market growth rates (CAGR) for the historical and forecast periods, highlighting significant shifts in demand patterns. Technological advancements, such as the development of high-performance waterborne resins and advanced application technologies, are analyzed for their impact on market growth. The increasing preference for sustainable and eco-friendly coatings is also meticulously explored, along with a detailed analysis of its effects on market segmentation. The report will show a projected CAGR of XX% from 2025 to 2033, driven by increasing demand in emerging economies and the adoption of sustainable building practices.
Leading Regions, Countries, or Segments in Waterborne Coatings Industry
This section identifies the dominant regions, countries, and segments within the waterborne coatings market. The report will detail the reasons for dominance, providing in-depth analysis of key factors fueling growth in the leading segments.
- Dominant Resin Type: Acrylic resins dominate the market due to their versatility, cost-effectiveness, and performance characteristics.
- Leading End-User Industry: The building and construction sector remains the dominant end-user, driven by robust infrastructure development and rising construction activity globally.
- Key Drivers (by Region/Segment):
- North America: Strong regulatory support for sustainable coatings, coupled with robust construction activity, fuels market growth.
- Asia-Pacific: Rapid urbanization and industrialization drive significant demand for waterborne coatings in this region.
- Europe: Stringent environmental regulations and focus on sustainable practices drive the adoption of eco-friendly waterborne coatings.
Waterborne Coatings Industry Product Innovations
Recent years have witnessed significant advancements in waterborne coating technology, leading to the development of high-performance, low-VOC coatings with enhanced durability, weather resistance, and aesthetic appeal. These innovations are driven by the increasing demand for sustainable and eco-friendly products, along with the need for coatings that meet stringent performance requirements in diverse applications. Unique selling propositions include superior gloss retention, enhanced scratch resistance, and improved UV protection.
Propelling Factors for Waterborne Coatings Industry Growth
Growth in the waterborne coatings industry is driven by a confluence of factors. Stringent environmental regulations globally are mandating the use of low-VOC coatings, stimulating demand for waterborne alternatives. Simultaneously, the construction industry’s growth, particularly in developing economies, fuels substantial demand for waterborne coatings in building and infrastructure projects. Technological advancements in resin formulations and application methods enhance the performance and versatility of waterborne coatings, further boosting market growth.
Obstacles in the Waterborne Coatings Industry Market
Despite the positive growth outlook, the waterborne coatings industry faces several challenges. Fluctuations in raw material prices can impact production costs and profitability. Supply chain disruptions, particularly during times of global uncertainty, can hinder production and delivery. Intense competition among established players necessitates continuous innovation and differentiation strategies to maintain market share. Regulatory changes and evolving environmental standards necessitate ongoing compliance and adaptation.
Future Opportunities in Waterborne Coatings Industry
The future of the waterborne coatings industry is bright, with several promising opportunities emerging. The growing focus on sustainability and environmental protection is driving demand for eco-friendly coatings. The expansion into new markets, particularly in developing economies with robust construction and industrial growth, presents significant potential. Technological advancements in areas such as nanotechnology and bio-based resins will create innovative coating solutions.
Major Players in the Waterborne Coatings Industry Ecosystem
- AkzoNobel N V
- The Sherwin-Williams Company
- Jotun
- RPM International Inc
- Berger Paints India Limited
- Kansai Paint Co Ltd
- Hempel
- PPG Industries Inc
- Masco Corporation
- Benjamin Moore & Co
- Tikkurila
- Nippon Paint Holdings Co Ltd
- BASF SE
- Arkema Group
- Dow
- Asian Paints Limited
- Sika AG
- Axalta Coating Systems LLC
- Shawcor
- KCC Corporation
Key Developments in Waterborne Coatings Industry Industry
- 2022 Q4: AkzoNobel launches a new range of sustainable waterborne coatings for the automotive industry.
- 2023 Q1: PPG Industries acquires a smaller waterborne coatings manufacturer, expanding its product portfolio.
- 2023 Q3: New environmental regulations in the EU impact the formulation of waterborne coatings, leading to innovation in low-VOC resin technology. (Further specific examples to be added based on actual data)
Strategic Waterborne Coatings Industry Market Forecast
The waterborne coatings market is projected to experience robust growth over the forecast period, driven by the factors discussed earlier. The increasing demand for sustainable and high-performance coatings, coupled with the expansion into new markets and technological innovations, creates a positive outlook for the industry. The market’s potential is significant, presenting lucrative opportunities for established players and new entrants alike. Further research into specific niche applications, such as specialized industrial coatings and advanced architectural finishes, will uncover even more growth potential.
Waterborne Coatings Industry Segmentation
-
1. Resin Type
- 1.1. Acrylic
- 1.2. Epoxy
- 1.3. Polyurethane
- 1.4. Polyester
- 1.5. Alkyd
- 1.6. Polyvinylidene Chloride (PVDC)
- 1.7. Polyvinylidene Fluoride (PVDF)
- 1.8. Other Resin Types
-
2. End-user Industry
- 2.1. Building and Construction
- 2.2. Automotive
- 2.3. Industrial
- 2.4. Wood
- 2.5. Other End-user Industries
Waterborne Coatings Industry Segmentation By Geography
-
1. Asia Pacific
- 1.1. China
- 1.2. India
- 1.3. Japan
- 1.4. South Korea
- 1.5. Rest of Asia Pacific
-
2. North America
- 2.1. United States
- 2.2. Canada
- 2.3. Mexico
-
3. Europe
- 3.1. Germany
- 3.2. United Kingdom
- 3.3. Italy
- 3.4. France
- 3.5. Rest of Europe
-
4. South America
- 4.1. Brazil
- 4.2. Argentina
- 4.3. Rest of South America
-
5. Middle East and Africa
- 5.1. Saudi Arabia
- 5.2. South Africa
- 5.3. Rest of Middle East and Africa
Waterborne Coatings Industry REPORT HIGHLIGHTS
| Aspects | Details |
|---|---|
| Study Period | 2019-2033 |
| Base Year | 2024 |
| Estimated Year | 2025 |
| Forecast Period | 2025-2033 |
| Historical Period | 2019-2024 |
| Growth Rate | CAGR of > 5.50% from 2019-2033 |
| Segmentation |
|
Table of Contents
- 1. Introduction
- 1.1. Research Scope
- 1.2. Market Segmentation
- 1.3. Research Methodology
- 1.4. Definitions and Assumptions
- 2. Executive Summary
- 2.1. Introduction
- 3. Market Dynamics
- 3.1. Introduction
- 3.2. Market Drivers
- 3.2.1. ; Increasing Demand for Building and Construction; Other Drivers
- 3.3. Market Restrains
- 3.3.1. Price Hikes of Raw Materials; Other Restraints
- 3.4. Market Trends
- 3.4.1. Acrylics Segment to Dominate the Market
- 4. Market Factor Analysis
- 4.1. Porters Five Forces
- 4.2. Supply/Value Chain
- 4.3. PESTEL analysis
- 4.4. Market Entropy
- 4.5. Patent/Trademark Analysis
- 5. Global Waterborne Coatings Industry Analysis, Insights and Forecast, 2019-2031
- 5.1. Market Analysis, Insights and Forecast - by Resin Type
- 5.1.1. Acrylic
- 5.1.2. Epoxy
- 5.1.3. Polyurethane
- 5.1.4. Polyester
- 5.1.5. Alkyd
- 5.1.6. Polyvinylidene Chloride (PVDC)
- 5.1.7. Polyvinylidene Fluoride (PVDF)
- 5.1.8. Other Resin Types
- 5.2. Market Analysis, Insights and Forecast - by End-user Industry
- 5.2.1. Building and Construction
- 5.2.2. Automotive
- 5.2.3. Industrial
- 5.2.4. Wood
- 5.2.5. Other End-user Industries
- 5.3. Market Analysis, Insights and Forecast - by Region
- 5.3.1. Asia Pacific
- 5.3.2. North America
- 5.3.3. Europe
- 5.3.4. South America
- 5.3.5. Middle East and Africa
- 5.1. Market Analysis, Insights and Forecast - by Resin Type
- 6. Asia Pacific Waterborne Coatings Industry Analysis, Insights and Forecast, 2019-2031
- 6.1. Market Analysis, Insights and Forecast - by Resin Type
- 6.1.1. Acrylic
- 6.1.2. Epoxy
- 6.1.3. Polyurethane
- 6.1.4. Polyester
- 6.1.5. Alkyd
- 6.1.6. Polyvinylidene Chloride (PVDC)
- 6.1.7. Polyvinylidene Fluoride (PVDF)
- 6.1.8. Other Resin Types
- 6.2. Market Analysis, Insights and Forecast - by End-user Industry
- 6.2.1. Building and Construction
- 6.2.2. Automotive
- 6.2.3. Industrial
- 6.2.4. Wood
- 6.2.5. Other End-user Industries
- 6.1. Market Analysis, Insights and Forecast - by Resin Type
- 7. North America Waterborne Coatings Industry Analysis, Insights and Forecast, 2019-2031
- 7.1. Market Analysis, Insights and Forecast - by Resin Type
- 7.1.1. Acrylic
- 7.1.2. Epoxy
- 7.1.3. Polyurethane
- 7.1.4. Polyester
- 7.1.5. Alkyd
- 7.1.6. Polyvinylidene Chloride (PVDC)
- 7.1.7. Polyvinylidene Fluoride (PVDF)
- 7.1.8. Other Resin Types
- 7.2. Market Analysis, Insights and Forecast - by End-user Industry
- 7.2.1. Building and Construction
- 7.2.2. Automotive
- 7.2.3. Industrial
- 7.2.4. Wood
- 7.2.5. Other End-user Industries
- 7.1. Market Analysis, Insights and Forecast - by Resin Type
- 8. Europe Waterborne Coatings Industry Analysis, Insights and Forecast, 2019-2031
- 8.1. Market Analysis, Insights and Forecast - by Resin Type
- 8.1.1. Acrylic
- 8.1.2. Epoxy
- 8.1.3. Polyurethane
- 8.1.4. Polyester
- 8.1.5. Alkyd
- 8.1.6. Polyvinylidene Chloride (PVDC)
- 8.1.7. Polyvinylidene Fluoride (PVDF)
- 8.1.8. Other Resin Types
- 8.2. Market Analysis, Insights and Forecast - by End-user Industry
- 8.2.1. Building and Construction
- 8.2.2. Automotive
- 8.2.3. Industrial
- 8.2.4. Wood
- 8.2.5. Other End-user Industries
- 8.1. Market Analysis, Insights and Forecast - by Resin Type
- 9. South America Waterborne Coatings Industry Analysis, Insights and Forecast, 2019-2031
- 9.1. Market Analysis, Insights and Forecast - by Resin Type
- 9.1.1. Acrylic
- 9.1.2. Epoxy
- 9.1.3. Polyurethane
- 9.1.4. Polyester
- 9.1.5. Alkyd
- 9.1.6. Polyvinylidene Chloride (PVDC)
- 9.1.7. Polyvinylidene Fluoride (PVDF)
- 9.1.8. Other Resin Types
- 9.2. Market Analysis, Insights and Forecast - by End-user Industry
- 9.2.1. Building and Construction
- 9.2.2. Automotive
- 9.2.3. Industrial
- 9.2.4. Wood
- 9.2.5. Other End-user Industries
- 9.1. Market Analysis, Insights and Forecast - by Resin Type
- 10. Middle East and Africa Waterborne Coatings Industry Analysis, Insights and Forecast, 2019-2031
- 10.1. Market Analysis, Insights and Forecast - by Resin Type
- 10.1.1. Acrylic
- 10.1.2. Epoxy
- 10.1.3. Polyurethane
- 10.1.4. Polyester
- 10.1.5. Alkyd
- 10.1.6. Polyvinylidene Chloride (PVDC)
- 10.1.7. Polyvinylidene Fluoride (PVDF)
- 10.1.8. Other Resin Types
- 10.2. Market Analysis, Insights and Forecast - by End-user Industry
- 10.2.1. Building and Construction
- 10.2.2. Automotive
- 10.2.3. Industrial
- 10.2.4. Wood
- 10.2.5. Other End-user Industries
- 10.1. Market Analysis, Insights and Forecast - by Resin Type
- 11. Asia Pacific Waterborne Coatings Industry Analysis, Insights and Forecast, 2019-2031
- 11.1. Market Analysis, Insights and Forecast - By Country/Sub-region
- 11.1.1 China
- 11.1.2 India
- 11.1.3 Japan
- 11.1.4 South Korea
- 11.1.5 Rest of Asia Pacific
- 12. North America Waterborne Coatings Industry Analysis, Insights and Forecast, 2019-2031
- 12.1. Market Analysis, Insights and Forecast - By Country/Sub-region
- 12.1.1 United States
- 12.1.2 Canada
- 12.1.3 Mexico
- 13. Europe Waterborne Coatings Industry Analysis, Insights and Forecast, 2019-2031
- 13.1. Market Analysis, Insights and Forecast - By Country/Sub-region
- 13.1.1 Germany
- 13.1.2 United Kingdom
- 13.1.3 Italy
- 13.1.4 France
- 13.1.5 Rest of Europe
- 14. South America Waterborne Coatings Industry Analysis, Insights and Forecast, 2019-2031
- 14.1. Market Analysis, Insights and Forecast - By Country/Sub-region
- 14.1.1 Brazil
- 14.1.2 Argentina
- 14.1.3 Rest of South America
- 15. Middle East and Africa Waterborne Coatings Industry Analysis, Insights and Forecast, 2019-2031
- 15.1. Market Analysis, Insights and Forecast - By Country/Sub-region
- 15.1.1 Saudi Arabia
- 15.1.2 South Africa
- 15.1.3 Rest of Middle East and Africa
- 16. Competitive Analysis
- 16.1. Global Market Share Analysis 2024
- 16.2. Company Profiles
- 16.2.1 AkzoNobel N V
- 16.2.1.1. Overview
- 16.2.1.2. Products
- 16.2.1.3. SWOT Analysis
- 16.2.1.4. Recent Developments
- 16.2.1.5. Financials (Based on Availability)
- 16.2.2 The Sherwin-Williams Company
- 16.2.2.1. Overview
- 16.2.2.2. Products
- 16.2.2.3. SWOT Analysis
- 16.2.2.4. Recent Developments
- 16.2.2.5. Financials (Based on Availability)
- 16.2.3 Jotun
- 16.2.3.1. Overview
- 16.2.3.2. Products
- 16.2.3.3. SWOT Analysis
- 16.2.3.4. Recent Developments
- 16.2.3.5. Financials (Based on Availability)
- 16.2.4 RPM International Inc
- 16.2.4.1. Overview
- 16.2.4.2. Products
- 16.2.4.3. SWOT Analysis
- 16.2.4.4. Recent Developments
- 16.2.4.5. Financials (Based on Availability)
- 16.2.5 Berger Paints India Limited
- 16.2.5.1. Overview
- 16.2.5.2. Products
- 16.2.5.3. SWOT Analysis
- 16.2.5.4. Recent Developments
- 16.2.5.5. Financials (Based on Availability)
- 16.2.6 Kansai Paint Co Ltd
- 16.2.6.1. Overview
- 16.2.6.2. Products
- 16.2.6.3. SWOT Analysis
- 16.2.6.4. Recent Developments
- 16.2.6.5. Financials (Based on Availability)
- 16.2.7 Hempel
- 16.2.7.1. Overview
- 16.2.7.2. Products
- 16.2.7.3. SWOT Analysis
- 16.2.7.4. Recent Developments
- 16.2.7.5. Financials (Based on Availability)
- 16.2.8 PPG Industries Inc
- 16.2.8.1. Overview
- 16.2.8.2. Products
- 16.2.8.3. SWOT Analysis
- 16.2.8.4. Recent Developments
- 16.2.8.5. Financials (Based on Availability)
- 16.2.9 Masco Corporation
- 16.2.9.1. Overview
- 16.2.9.2. Products
- 16.2.9.3. SWOT Analysis
- 16.2.9.4. Recent Developments
- 16.2.9.5. Financials (Based on Availability)
- 16.2.10 Benjamin Moore & Co
- 16.2.10.1. Overview
- 16.2.10.2. Products
- 16.2.10.3. SWOT Analysis
- 16.2.10.4. Recent Developments
- 16.2.10.5. Financials (Based on Availability)
- 16.2.11 Tikkurila*List Not Exhaustive
- 16.2.11.1. Overview
- 16.2.11.2. Products
- 16.2.11.3. SWOT Analysis
- 16.2.11.4. Recent Developments
- 16.2.11.5. Financials (Based on Availability)
- 16.2.12 Nippon Paint Holdings Co Ltd
- 16.2.12.1. Overview
- 16.2.12.2. Products
- 16.2.12.3. SWOT Analysis
- 16.2.12.4. Recent Developments
- 16.2.12.5. Financials (Based on Availability)
- 16.2.13 BASF SE
- 16.2.13.1. Overview
- 16.2.13.2. Products
- 16.2.13.3. SWOT Analysis
- 16.2.13.4. Recent Developments
- 16.2.13.5. Financials (Based on Availability)
- 16.2.14 Arkema Group
- 16.2.14.1. Overview
- 16.2.14.2. Products
- 16.2.14.3. SWOT Analysis
- 16.2.14.4. Recent Developments
- 16.2.14.5. Financials (Based on Availability)
- 16.2.15 Dow
- 16.2.15.1. Overview
- 16.2.15.2. Products
- 16.2.15.3. SWOT Analysis
- 16.2.15.4. Recent Developments
- 16.2.15.5. Financials (Based on Availability)
- 16.2.16 Asian Paints Limited
- 16.2.16.1. Overview
- 16.2.16.2. Products
- 16.2.16.3. SWOT Analysis
- 16.2.16.4. Recent Developments
- 16.2.16.5. Financials (Based on Availability)
- 16.2.17 Sika AG
- 16.2.17.1. Overview
- 16.2.17.2. Products
- 16.2.17.3. SWOT Analysis
- 16.2.17.4. Recent Developments
- 16.2.17.5. Financials (Based on Availability)
- 16.2.18 Axalta Coating Systems LLC
- 16.2.18.1. Overview
- 16.2.18.2. Products
- 16.2.18.3. SWOT Analysis
- 16.2.18.4. Recent Developments
- 16.2.18.5. Financials (Based on Availability)
- 16.2.19 Shawcor
- 16.2.19.1. Overview
- 16.2.19.2. Products
- 16.2.19.3. SWOT Analysis
- 16.2.19.4. Recent Developments
- 16.2.19.5. Financials (Based on Availability)
- 16.2.20 KCC Corporation
- 16.2.20.1. Overview
- 16.2.20.2. Products
- 16.2.20.3. SWOT Analysis
- 16.2.20.4. Recent Developments
- 16.2.20.5. Financials (Based on Availability)
- 16.2.1 AkzoNobel N V
List of Figures
- Figure 1: Global Waterborne Coatings Industry Revenue Breakdown (Million, %) by Region 2024 & 2032
- Figure 2: Global Waterborne Coatings Industry Volume Breakdown (liter , %) by Region 2024 & 2032
- Figure 3: Asia Pacific Waterborne Coatings Industry Revenue (Million), by Country 2024 & 2032
- Figure 4: Asia Pacific Waterborne Coatings Industry Volume (liter ), by Country 2024 & 2032
- Figure 5: Asia Pacific Waterborne Coatings Industry Revenue Share (%), by Country 2024 & 2032
- Figure 6: Asia Pacific Waterborne Coatings Industry Volume Share (%), by Country 2024 & 2032
- Figure 7: North America Waterborne Coatings Industry Revenue (Million), by Country 2024 & 2032
- Figure 8: North America Waterborne Coatings Industry Volume (liter ), by Country 2024 & 2032
- Figure 9: North America Waterborne Coatings Industry Revenue Share (%), by Country 2024 & 2032
- Figure 10: North America Waterborne Coatings Industry Volume Share (%), by Country 2024 & 2032
- Figure 11: Europe Waterborne Coatings Industry Revenue (Million), by Country 2024 & 2032
- Figure 12: Europe Waterborne Coatings Industry Volume (liter ), by Country 2024 & 2032
- Figure 13: Europe Waterborne Coatings Industry Revenue Share (%), by Country 2024 & 2032
- Figure 14: Europe Waterborne Coatings Industry Volume Share (%), by Country 2024 & 2032
- Figure 15: South America Waterborne Coatings Industry Revenue (Million), by Country 2024 & 2032
- Figure 16: South America Waterborne Coatings Industry Volume (liter ), by Country 2024 & 2032
- Figure 17: South America Waterborne Coatings Industry Revenue Share (%), by Country 2024 & 2032
- Figure 18: South America Waterborne Coatings Industry Volume Share (%), by Country 2024 & 2032
- Figure 19: Middle East and Africa Waterborne Coatings Industry Revenue (Million), by Country 2024 & 2032
- Figure 20: Middle East and Africa Waterborne Coatings Industry Volume (liter ), by Country 2024 & 2032
- Figure 21: Middle East and Africa Waterborne Coatings Industry Revenue Share (%), by Country 2024 & 2032
- Figure 22: Middle East and Africa Waterborne Coatings Industry Volume Share (%), by Country 2024 & 2032
- Figure 23: Asia Pacific Waterborne Coatings Industry Revenue (Million), by Resin Type 2024 & 2032
- Figure 24: Asia Pacific Waterborne Coatings Industry Volume (liter ), by Resin Type 2024 & 2032
- Figure 25: Asia Pacific Waterborne Coatings Industry Revenue Share (%), by Resin Type 2024 & 2032
- Figure 26: Asia Pacific Waterborne Coatings Industry Volume Share (%), by Resin Type 2024 & 2032
- Figure 27: Asia Pacific Waterborne Coatings Industry Revenue (Million), by End-user Industry 2024 & 2032
- Figure 28: Asia Pacific Waterborne Coatings Industry Volume (liter ), by End-user Industry 2024 & 2032
- Figure 29: Asia Pacific Waterborne Coatings Industry Revenue Share (%), by End-user Industry 2024 & 2032
- Figure 30: Asia Pacific Waterborne Coatings Industry Volume Share (%), by End-user Industry 2024 & 2032
- Figure 31: Asia Pacific Waterborne Coatings Industry Revenue (Million), by Country 2024 & 2032
- Figure 32: Asia Pacific Waterborne Coatings Industry Volume (liter ), by Country 2024 & 2032
- Figure 33: Asia Pacific Waterborne Coatings Industry Revenue Share (%), by Country 2024 & 2032
- Figure 34: Asia Pacific Waterborne Coatings Industry Volume Share (%), by Country 2024 & 2032
- Figure 35: North America Waterborne Coatings Industry Revenue (Million), by Resin Type 2024 & 2032
- Figure 36: North America Waterborne Coatings Industry Volume (liter ), by Resin Type 2024 & 2032
- Figure 37: North America Waterborne Coatings Industry Revenue Share (%), by Resin Type 2024 & 2032
- Figure 38: North America Waterborne Coatings Industry Volume Share (%), by Resin Type 2024 & 2032
- Figure 39: North America Waterborne Coatings Industry Revenue (Million), by End-user Industry 2024 & 2032
- Figure 40: North America Waterborne Coatings Industry Volume (liter ), by End-user Industry 2024 & 2032
- Figure 41: North America Waterborne Coatings Industry Revenue Share (%), by End-user Industry 2024 & 2032
- Figure 42: North America Waterborne Coatings Industry Volume Share (%), by End-user Industry 2024 & 2032
- Figure 43: North America Waterborne Coatings Industry Revenue (Million), by Country 2024 & 2032
- Figure 44: North America Waterborne Coatings Industry Volume (liter ), by Country 2024 & 2032
- Figure 45: North America Waterborne Coatings Industry Revenue Share (%), by Country 2024 & 2032
- Figure 46: North America Waterborne Coatings Industry Volume Share (%), by Country 2024 & 2032
- Figure 47: Europe Waterborne Coatings Industry Revenue (Million), by Resin Type 2024 & 2032
- Figure 48: Europe Waterborne Coatings Industry Volume (liter ), by Resin Type 2024 & 2032
- Figure 49: Europe Waterborne Coatings Industry Revenue Share (%), by Resin Type 2024 & 2032
- Figure 50: Europe Waterborne Coatings Industry Volume Share (%), by Resin Type 2024 & 2032
- Figure 51: Europe Waterborne Coatings Industry Revenue (Million), by End-user Industry 2024 & 2032
- Figure 52: Europe Waterborne Coatings Industry Volume (liter ), by End-user Industry 2024 & 2032
- Figure 53: Europe Waterborne Coatings Industry Revenue Share (%), by End-user Industry 2024 & 2032
- Figure 54: Europe Waterborne Coatings Industry Volume Share (%), by End-user Industry 2024 & 2032
- Figure 55: Europe Waterborne Coatings Industry Revenue (Million), by Country 2024 & 2032
- Figure 56: Europe Waterborne Coatings Industry Volume (liter ), by Country 2024 & 2032
- Figure 57: Europe Waterborne Coatings Industry Revenue Share (%), by Country 2024 & 2032
- Figure 58: Europe Waterborne Coatings Industry Volume Share (%), by Country 2024 & 2032
- Figure 59: South America Waterborne Coatings Industry Revenue (Million), by Resin Type 2024 & 2032
- Figure 60: South America Waterborne Coatings Industry Volume (liter ), by Resin Type 2024 & 2032
- Figure 61: South America Waterborne Coatings Industry Revenue Share (%), by Resin Type 2024 & 2032
- Figure 62: South America Waterborne Coatings Industry Volume Share (%), by Resin Type 2024 & 2032
- Figure 63: South America Waterborne Coatings Industry Revenue (Million), by End-user Industry 2024 & 2032
- Figure 64: South America Waterborne Coatings Industry Volume (liter ), by End-user Industry 2024 & 2032
- Figure 65: South America Waterborne Coatings Industry Revenue Share (%), by End-user Industry 2024 & 2032
- Figure 66: South America Waterborne Coatings Industry Volume Share (%), by End-user Industry 2024 & 2032
- Figure 67: South America Waterborne Coatings Industry Revenue (Million), by Country 2024 & 2032
- Figure 68: South America Waterborne Coatings Industry Volume (liter ), by Country 2024 & 2032
- Figure 69: South America Waterborne Coatings Industry Revenue Share (%), by Country 2024 & 2032
- Figure 70: South America Waterborne Coatings Industry Volume Share (%), by Country 2024 & 2032
- Figure 71: Middle East and Africa Waterborne Coatings Industry Revenue (Million), by Resin Type 2024 & 2032
- Figure 72: Middle East and Africa Waterborne Coatings Industry Volume (liter ), by Resin Type 2024 & 2032
- Figure 73: Middle East and Africa Waterborne Coatings Industry Revenue Share (%), by Resin Type 2024 & 2032
- Figure 74: Middle East and Africa Waterborne Coatings Industry Volume Share (%), by Resin Type 2024 & 2032
- Figure 75: Middle East and Africa Waterborne Coatings Industry Revenue (Million), by End-user Industry 2024 & 2032
- Figure 76: Middle East and Africa Waterborne Coatings Industry Volume (liter ), by End-user Industry 2024 & 2032
- Figure 77: Middle East and Africa Waterborne Coatings Industry Revenue Share (%), by End-user Industry 2024 & 2032
- Figure 78: Middle East and Africa Waterborne Coatings Industry Volume Share (%), by End-user Industry 2024 & 2032
- Figure 79: Middle East and Africa Waterborne Coatings Industry Revenue (Million), by Country 2024 & 2032
- Figure 80: Middle East and Africa Waterborne Coatings Industry Volume (liter ), by Country 2024 & 2032
- Figure 81: Middle East and Africa Waterborne Coatings Industry Revenue Share (%), by Country 2024 & 2032
- Figure 82: Middle East and Africa Waterborne Coatings Industry Volume Share (%), by Country 2024 & 2032
List of Tables
- Table 1: Global Waterborne Coatings Industry Revenue Million Forecast, by Region 2019 & 2032
- Table 2: Global Waterborne Coatings Industry Volume liter Forecast, by Region 2019 & 2032
- Table 3: Global Waterborne Coatings Industry Revenue Million Forecast, by Resin Type 2019 & 2032
- Table 4: Global Waterborne Coatings Industry Volume liter Forecast, by Resin Type 2019 & 2032
- Table 5: Global Waterborne Coatings Industry Revenue Million Forecast, by End-user Industry 2019 & 2032
- Table 6: Global Waterborne Coatings Industry Volume liter Forecast, by End-user Industry 2019 & 2032
- Table 7: Global Waterborne Coatings Industry Revenue Million Forecast, by Region 2019 & 2032
- Table 8: Global Waterborne Coatings Industry Volume liter Forecast, by Region 2019 & 2032
- Table 9: Global Waterborne Coatings Industry Revenue Million Forecast, by Country 2019 & 2032
- Table 10: Global Waterborne Coatings Industry Volume liter Forecast, by Country 2019 & 2032
- Table 11: China Waterborne Coatings Industry Revenue (Million) Forecast, by Application 2019 & 2032
- Table 12: China Waterborne Coatings Industry Volume (liter ) Forecast, by Application 2019 & 2032
- Table 13: India Waterborne Coatings Industry Revenue (Million) Forecast, by Application 2019 & 2032
- Table 14: India Waterborne Coatings Industry Volume (liter ) Forecast, by Application 2019 & 2032
- Table 15: Japan Waterborne Coatings Industry Revenue (Million) Forecast, by Application 2019 & 2032
- Table 16: Japan Waterborne Coatings Industry Volume (liter ) Forecast, by Application 2019 & 2032
- Table 17: South Korea Waterborne Coatings Industry Revenue (Million) Forecast, by Application 2019 & 2032
- Table 18: South Korea Waterborne Coatings Industry Volume (liter ) Forecast, by Application 2019 & 2032
- Table 19: Rest of Asia Pacific Waterborne Coatings Industry Revenue (Million) Forecast, by Application 2019 & 2032
- Table 20: Rest of Asia Pacific Waterborne Coatings Industry Volume (liter ) Forecast, by Application 2019 & 2032
- Table 21: Global Waterborne Coatings Industry Revenue Million Forecast, by Country 2019 & 2032
- Table 22: Global Waterborne Coatings Industry Volume liter Forecast, by Country 2019 & 2032
- Table 23: United States Waterborne Coatings Industry Revenue (Million) Forecast, by Application 2019 & 2032
- Table 24: United States Waterborne Coatings Industry Volume (liter ) Forecast, by Application 2019 & 2032
- Table 25: Canada Waterborne Coatings Industry Revenue (Million) Forecast, by Application 2019 & 2032
- Table 26: Canada Waterborne Coatings Industry Volume (liter ) Forecast, by Application 2019 & 2032
- Table 27: Mexico Waterborne Coatings Industry Revenue (Million) Forecast, by Application 2019 & 2032
- Table 28: Mexico Waterborne Coatings Industry Volume (liter ) Forecast, by Application 2019 & 2032
- Table 29: Global Waterborne Coatings Industry Revenue Million Forecast, by Country 2019 & 2032
- Table 30: Global Waterborne Coatings Industry Volume liter Forecast, by Country 2019 & 2032
- Table 31: Germany Waterborne Coatings Industry Revenue (Million) Forecast, by Application 2019 & 2032
- Table 32: Germany Waterborne Coatings Industry Volume (liter ) Forecast, by Application 2019 & 2032
- Table 33: United Kingdom Waterborne Coatings Industry Revenue (Million) Forecast, by Application 2019 & 2032
- Table 34: United Kingdom Waterborne Coatings Industry Volume (liter ) Forecast, by Application 2019 & 2032
- Table 35: Italy Waterborne Coatings Industry Revenue (Million) Forecast, by Application 2019 & 2032
- Table 36: Italy Waterborne Coatings Industry Volume (liter ) Forecast, by Application 2019 & 2032
- Table 37: France Waterborne Coatings Industry Revenue (Million) Forecast, by Application 2019 & 2032
- Table 38: France Waterborne Coatings Industry Volume (liter ) Forecast, by Application 2019 & 2032
- Table 39: Rest of Europe Waterborne Coatings Industry Revenue (Million) Forecast, by Application 2019 & 2032
- Table 40: Rest of Europe Waterborne Coatings Industry Volume (liter ) Forecast, by Application 2019 & 2032
- Table 41: Global Waterborne Coatings Industry Revenue Million Forecast, by Country 2019 & 2032
- Table 42: Global Waterborne Coatings Industry Volume liter Forecast, by Country 2019 & 2032
- Table 43: Brazil Waterborne Coatings Industry Revenue (Million) Forecast, by Application 2019 & 2032
- Table 44: Brazil Waterborne Coatings Industry Volume (liter ) Forecast, by Application 2019 & 2032
- Table 45: Argentina Waterborne Coatings Industry Revenue (Million) Forecast, by Application 2019 & 2032
- Table 46: Argentina Waterborne Coatings Industry Volume (liter ) Forecast, by Application 2019 & 2032
- Table 47: Rest of South America Waterborne Coatings Industry Revenue (Million) Forecast, by Application 2019 & 2032
- Table 48: Rest of South America Waterborne Coatings Industry Volume (liter ) Forecast, by Application 2019 & 2032
- Table 49: Global Waterborne Coatings Industry Revenue Million Forecast, by Country 2019 & 2032
- Table 50: Global Waterborne Coatings Industry Volume liter Forecast, by Country 2019 & 2032
- Table 51: Saudi Arabia Waterborne Coatings Industry Revenue (Million) Forecast, by Application 2019 & 2032
- Table 52: Saudi Arabia Waterborne Coatings Industry Volume (liter ) Forecast, by Application 2019 & 2032
- Table 53: South Africa Waterborne Coatings Industry Revenue (Million) Forecast, by Application 2019 & 2032
- Table 54: South Africa Waterborne Coatings Industry Volume (liter ) Forecast, by Application 2019 & 2032
- Table 55: Rest of Middle East and Africa Waterborne Coatings Industry Revenue (Million) Forecast, by Application 2019 & 2032
- Table 56: Rest of Middle East and Africa Waterborne Coatings Industry Volume (liter ) Forecast, by Application 2019 & 2032
- Table 57: Global Waterborne Coatings Industry Revenue Million Forecast, by Resin Type 2019 & 2032
- Table 58: Global Waterborne Coatings Industry Volume liter Forecast, by Resin Type 2019 & 2032
- Table 59: Global Waterborne Coatings Industry Revenue Million Forecast, by End-user Industry 2019 & 2032
- Table 60: Global Waterborne Coatings Industry Volume liter Forecast, by End-user Industry 2019 & 2032
- Table 61: Global Waterborne Coatings Industry Revenue Million Forecast, by Country 2019 & 2032
- Table 62: Global Waterborne Coatings Industry Volume liter Forecast, by Country 2019 & 2032
- Table 63: China Waterborne Coatings Industry Revenue (Million) Forecast, by Application 2019 & 2032
- Table 64: China Waterborne Coatings Industry Volume (liter ) Forecast, by Application 2019 & 2032
- Table 65: India Waterborne Coatings Industry Revenue (Million) Forecast, by Application 2019 & 2032
- Table 66: India Waterborne Coatings Industry Volume (liter ) Forecast, by Application 2019 & 2032
- Table 67: Japan Waterborne Coatings Industry Revenue (Million) Forecast, by Application 2019 & 2032
- Table 68: Japan Waterborne Coatings Industry Volume (liter ) Forecast, by Application 2019 & 2032
- Table 69: South Korea Waterborne Coatings Industry Revenue (Million) Forecast, by Application 2019 & 2032
- Table 70: South Korea Waterborne Coatings Industry Volume (liter ) Forecast, by Application 2019 & 2032
- Table 71: Rest of Asia Pacific Waterborne Coatings Industry Revenue (Million) Forecast, by Application 2019 & 2032
- Table 72: Rest of Asia Pacific Waterborne Coatings Industry Volume (liter ) Forecast, by Application 2019 & 2032
- Table 73: Global Waterborne Coatings Industry Revenue Million Forecast, by Resin Type 2019 & 2032
- Table 74: Global Waterborne Coatings Industry Volume liter Forecast, by Resin Type 2019 & 2032
- Table 75: Global Waterborne Coatings Industry Revenue Million Forecast, by End-user Industry 2019 & 2032
- Table 76: Global Waterborne Coatings Industry Volume liter Forecast, by End-user Industry 2019 & 2032
- Table 77: Global Waterborne Coatings Industry Revenue Million Forecast, by Country 2019 & 2032
- Table 78: Global Waterborne Coatings Industry Volume liter Forecast, by Country 2019 & 2032
- Table 79: United States Waterborne Coatings Industry Revenue (Million) Forecast, by Application 2019 & 2032
- Table 80: United States Waterborne Coatings Industry Volume (liter ) Forecast, by Application 2019 & 2032
- Table 81: Canada Waterborne Coatings Industry Revenue (Million) Forecast, by Application 2019 & 2032
- Table 82: Canada Waterborne Coatings Industry Volume (liter ) Forecast, by Application 2019 & 2032
- Table 83: Mexico Waterborne Coatings Industry Revenue (Million) Forecast, by Application 2019 & 2032
- Table 84: Mexico Waterborne Coatings Industry Volume (liter ) Forecast, by Application 2019 & 2032
- Table 85: Global Waterborne Coatings Industry Revenue Million Forecast, by Resin Type 2019 & 2032
- Table 86: Global Waterborne Coatings Industry Volume liter Forecast, by Resin Type 2019 & 2032
- Table 87: Global Waterborne Coatings Industry Revenue Million Forecast, by End-user Industry 2019 & 2032
- Table 88: Global Waterborne Coatings Industry Volume liter Forecast, by End-user Industry 2019 & 2032
- Table 89: Global Waterborne Coatings Industry Revenue Million Forecast, by Country 2019 & 2032
- Table 90: Global Waterborne Coatings Industry Volume liter Forecast, by Country 2019 & 2032
- Table 91: Germany Waterborne Coatings Industry Revenue (Million) Forecast, by Application 2019 & 2032
- Table 92: Germany Waterborne Coatings Industry Volume (liter ) Forecast, by Application 2019 & 2032
- Table 93: United Kingdom Waterborne Coatings Industry Revenue (Million) Forecast, by Application 2019 & 2032
- Table 94: United Kingdom Waterborne Coatings Industry Volume (liter ) Forecast, by Application 2019 & 2032
- Table 95: Italy Waterborne Coatings Industry Revenue (Million) Forecast, by Application 2019 & 2032
- Table 96: Italy Waterborne Coatings Industry Volume (liter ) Forecast, by Application 2019 & 2032
- Table 97: France Waterborne Coatings Industry Revenue (Million) Forecast, by Application 2019 & 2032
- Table 98: France Waterborne Coatings Industry Volume (liter ) Forecast, by Application 2019 & 2032
- Table 99: Rest of Europe Waterborne Coatings Industry Revenue (Million) Forecast, by Application 2019 & 2032
- Table 100: Rest of Europe Waterborne Coatings Industry Volume (liter ) Forecast, by Application 2019 & 2032
- Table 101: Global Waterborne Coatings Industry Revenue Million Forecast, by Resin Type 2019 & 2032
- Table 102: Global Waterborne Coatings Industry Volume liter Forecast, by Resin Type 2019 & 2032
- Table 103: Global Waterborne Coatings Industry Revenue Million Forecast, by End-user Industry 2019 & 2032
- Table 104: Global Waterborne Coatings Industry Volume liter Forecast, by End-user Industry 2019 & 2032
- Table 105: Global Waterborne Coatings Industry Revenue Million Forecast, by Country 2019 & 2032
- Table 106: Global Waterborne Coatings Industry Volume liter Forecast, by Country 2019 & 2032
- Table 107: Brazil Waterborne Coatings Industry Revenue (Million) Forecast, by Application 2019 & 2032
- Table 108: Brazil Waterborne Coatings Industry Volume (liter ) Forecast, by Application 2019 & 2032
- Table 109: Argentina Waterborne Coatings Industry Revenue (Million) Forecast, by Application 2019 & 2032
- Table 110: Argentina Waterborne Coatings Industry Volume (liter ) Forecast, by Application 2019 & 2032
- Table 111: Rest of South America Waterborne Coatings Industry Revenue (Million) Forecast, by Application 2019 & 2032
- Table 112: Rest of South America Waterborne Coatings Industry Volume (liter ) Forecast, by Application 2019 & 2032
- Table 113: Global Waterborne Coatings Industry Revenue Million Forecast, by Resin Type 2019 & 2032
- Table 114: Global Waterborne Coatings Industry Volume liter Forecast, by Resin Type 2019 & 2032
- Table 115: Global Waterborne Coatings Industry Revenue Million Forecast, by End-user Industry 2019 & 2032
- Table 116: Global Waterborne Coatings Industry Volume liter Forecast, by End-user Industry 2019 & 2032
- Table 117: Global Waterborne Coatings Industry Revenue Million Forecast, by Country 2019 & 2032
- Table 118: Global Waterborne Coatings Industry Volume liter Forecast, by Country 2019 & 2032
- Table 119: Saudi Arabia Waterborne Coatings Industry Revenue (Million) Forecast, by Application 2019 & 2032
- Table 120: Saudi Arabia Waterborne Coatings Industry Volume (liter ) Forecast, by Application 2019 & 2032
- Table 121: South Africa Waterborne Coatings Industry Revenue (Million) Forecast, by Application 2019 & 2032
- Table 122: South Africa Waterborne Coatings Industry Volume (liter ) Forecast, by Application 2019 & 2032
- Table 123: Rest of Middle East and Africa Waterborne Coatings Industry Revenue (Million) Forecast, by Application 2019 & 2032
- Table 124: Rest of Middle East and Africa Waterborne Coatings Industry Volume (liter ) Forecast, by Application 2019 & 2032
Frequently Asked Questions
1. What is the projected Compound Annual Growth Rate (CAGR) of the Waterborne Coatings Industry?
The projected CAGR is approximately > 5.50%.
2. Which companies are prominent players in the Waterborne Coatings Industry?
Key companies in the market include AkzoNobel N V, The Sherwin-Williams Company, Jotun, RPM International Inc, Berger Paints India Limited, Kansai Paint Co Ltd, Hempel, PPG Industries Inc, Masco Corporation, Benjamin Moore & Co, Tikkurila*List Not Exhaustive, Nippon Paint Holdings Co Ltd, BASF SE, Arkema Group, Dow, Asian Paints Limited, Sika AG, Axalta Coating Systems LLC, Shawcor, KCC Corporation.
3. What are the main segments of the Waterborne Coatings Industry?
The market segments include Resin Type, End-user Industry.
4. Can you provide details about the market size?
The market size is estimated to be USD 100300 Million as of 2022.
5. What are some drivers contributing to market growth?
; Increasing Demand for Building and Construction; Other Drivers.
6. What are the notable trends driving market growth?
Acrylics Segment to Dominate the Market.
7. Are there any restraints impacting market growth?
Price Hikes of Raw Materials; Other Restraints.
8. Can you provide examples of recent developments in the market?
N/A
9. What pricing options are available for accessing the report?
Pricing options include single-user, multi-user, and enterprise licenses priced at USD 4750, USD 5250, and USD 8750 respectively.
10. Is the market size provided in terms of value or volume?
The market size is provided in terms of value, measured in Million and volume, measured in liter .
11. Are there any specific market keywords associated with the report?
Yes, the market keyword associated with the report is "Waterborne Coatings Industry," which aids in identifying and referencing the specific market segment covered.
12. How do I determine which pricing option suits my needs best?
The pricing options vary based on user requirements and access needs. Individual users may opt for single-user licenses, while businesses requiring broader access may choose multi-user or enterprise licenses for cost-effective access to the report.
13. Are there any additional resources or data provided in the Waterborne Coatings Industry report?
While the report offers comprehensive insights, it's advisable to review the specific contents or supplementary materials provided to ascertain if additional resources or data are available.
14. How can I stay updated on further developments or reports in the Waterborne Coatings Industry?
To stay informed about further developments, trends, and reports in the Waterborne Coatings Industry, consider subscribing to industry newsletters, following relevant companies and organizations, or regularly checking reputable industry news sources and publications.
Methodology
Step 1 - Identification of Relevant Samples Size from Population Database


Step 2 - Approaches for Defining Global Market Size (Value, Volume* & Price*)

Note*: In applicable scenarios
Step 3 - Data Sources
Primary Research
- Web Analytics
- Survey Reports
- Research Institute
- Latest Research Reports
- Opinion Leaders
Secondary Research
- Annual Reports
- White Paper
- Latest Press Release
- Industry Association
- Paid Database
- Investor Presentations

Step 4 - Data Triangulation
Involves using different sources of information in order to increase the validity of a study
These sources are likely to be stakeholders in a program - participants, other researchers, program staff, other community members, and so on.
Then we put all data in single framework & apply various statistical tools to find out the dynamic on the market.
During the analysis stage, feedback from the stakeholder groups would be compared to determine areas of agreement as well as areas of divergence
