

Key Insights
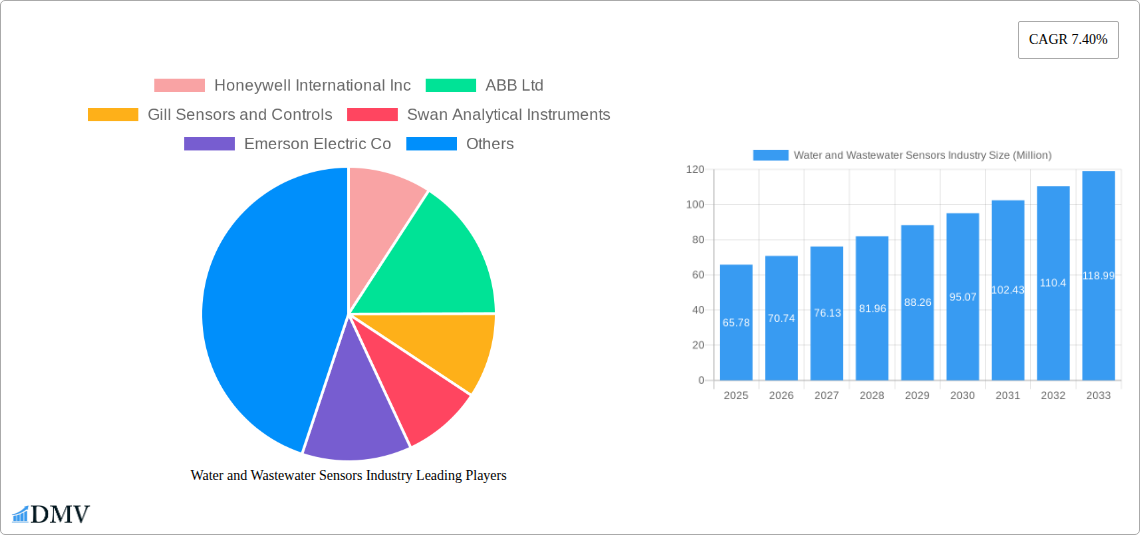
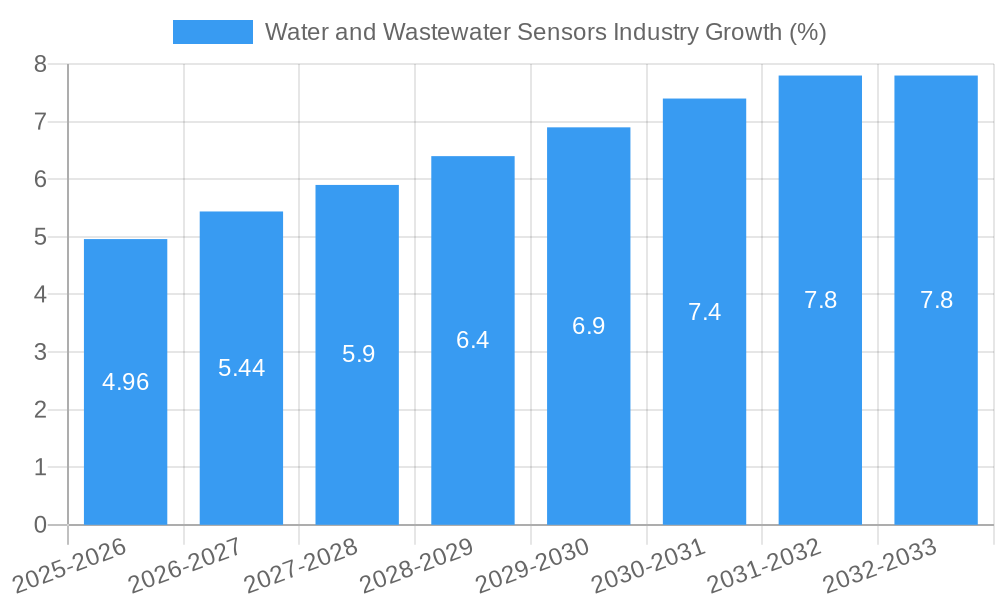
The global water and wastewater sensors market, valued at $65.78 million in 2025, is poised for significant growth, exhibiting a Compound Annual Growth Rate (CAGR) of 7.40% from 2025 to 2033. This robust expansion is driven by several key factors. Increasing urbanization and industrialization lead to a greater demand for efficient water management and treatment solutions. Stringent government regulations regarding water quality monitoring and the need to comply with environmental protection standards are further propelling market growth. Advancements in sensor technology, such as the development of more accurate, reliable, and cost-effective sensors, are also contributing to market expansion. The rising adoption of smart water management systems, integrating sensor data for real-time monitoring and control, represents a significant growth opportunity. Within the market, pH, DO, and turbidity sensors hold prominent positions, driven by their crucial role in monitoring water quality parameters. Municipalities represent a large segment, followed by industrial wastewater treatment facilities. While North America and Europe currently hold significant market share, the Asia-Pacific region is anticipated to experience substantial growth due to rapid industrialization and infrastructure development. Challenges, however, remain, including the high initial investment costs associated with sensor implementation and the need for skilled personnel to operate and maintain these systems.
The competitive landscape is characterized by a mix of established players like Honeywell, ABB, and Emerson, alongside specialized sensor manufacturers. These companies are focusing on innovation, strategic partnerships, and geographical expansion to maintain their market share and capitalize on the growing demand. The market is expected to see a continued shift towards advanced sensor technologies, including IoT-enabled sensors and AI-powered analytics, enhancing data analysis and predictive maintenance capabilities. The integration of these advanced technologies with cloud-based platforms will further streamline water management processes and improve overall efficiency. Furthermore, increasing awareness of water scarcity and the need for sustainable water management practices will continue to drive demand for sophisticated water quality monitoring solutions in the coming years. The market’s future growth trajectory is projected to remain positive, reflecting the ongoing commitment to improving water resource management globally.
Water and Wastewater Sensors Industry Market Report: 2019-2033
This comprehensive report provides a detailed analysis of the Water and Wastewater Sensors industry, projecting a market value of $XX Million by 2033. Covering the period from 2019 to 2033, with 2025 as the base and estimated year, this report is an invaluable resource for stakeholders seeking to understand market trends, technological advancements, and future opportunities within this crucial sector. The study meticulously examines key segments, prominent players, and emerging innovations, providing actionable insights for strategic decision-making.
Water and Wastewater Sensors Industry Market Composition & Trends
This section delves into the competitive landscape of the water and wastewater sensors market, analyzing market concentration, innovation drivers, regulatory frameworks, substitute products, end-user profiles, and mergers and acquisitions (M&A) activities. The market is moderately concentrated, with key players like Honeywell International Inc, ABB Ltd, and Emerson Electric Co holding significant market share. However, the emergence of innovative startups is increasing competition.
- Market Share Distribution (2024): Honeywell International Inc. (15%), ABB Ltd. (12%), Emerson Electric Co. (10%), Others (63%). These figures are estimates based on publicly available information and market research reports. Precise figures are difficult to obtain due to the fragmented nature of the market and varying reporting standards.
- Innovation Catalysts: Stringent environmental regulations, growing demand for efficient water management solutions, and advancements in sensor technologies are driving innovation.
- Regulatory Landscape: The industry is heavily influenced by environmental protection agencies' regulations regarding water quality monitoring and reporting. Compliance necessitates the adoption of advanced sensor technologies.
- Substitute Products: While no direct substitutes exist, alternative methods for water quality assessment, such as manual testing, may limit the market growth of certain sensor types.
- End-User Profiles: The primary end-users are municipalities (water treatment plants and sewage management) and industrial wastewater treatment facilities.
- M&A Activities: The past five years have witnessed several strategic acquisitions and partnerships, with an estimated total M&A deal value exceeding $XX Million. Many acquisitions focus on integrating advanced technologies or expanding geographic reach.
Water and Wastewater Sensors Industry Evolution
The water and wastewater sensors market exhibits a robust growth trajectory, fueled by increasing urbanization, industrialization, and stricter environmental regulations. From 2019 to 2024, the market registered a Compound Annual Growth Rate (CAGR) of approximately XX%. This growth is projected to continue, with a forecasted CAGR of XX% from 2025 to 2033. This expansion is driven by several key factors: the increasing adoption of advanced sensor technologies like IoT-enabled sensors for real-time monitoring and data analytics; the development of more accurate, reliable, and maintenance-free sensors; and a rising awareness among stakeholders regarding the importance of efficient water management. The market is also witnessing a shift towards multi-parameter sensors, which can simultaneously measure multiple water quality parameters, enhancing efficiency and cost-effectiveness. The adoption rate of these advanced sensors is growing steadily, with an estimated XX% increase in adoption between 2024 and 2025.
Leading Regions, Countries, or Segments in Water and Wastewater Sensors Industry
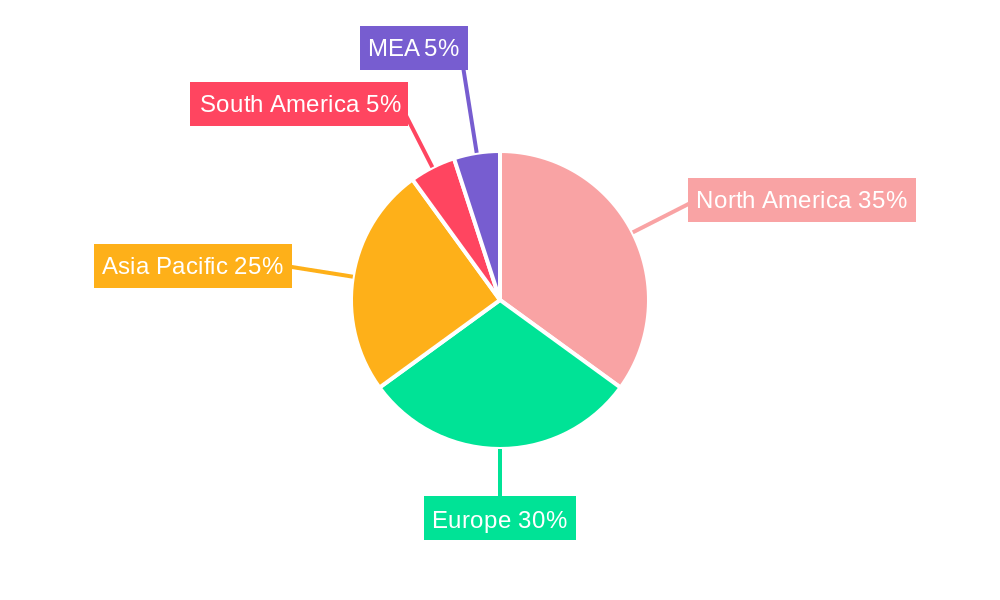
North America currently holds the largest market share, driven by stringent environmental regulations and significant investments in water infrastructure. However, the Asia-Pacific region is expected to experience the fastest growth rate due to rapid industrialization and urbanization in developing economies.
- Key Drivers for North American Dominance:
- Strong regulatory framework and enforcement.
- High investments in water infrastructure upgrades.
- Increased focus on water conservation and sustainability.
- Key Drivers for Asia-Pacific Growth:
- Rapid urbanization and industrialization leading to increased water demand.
- Rising government investments in water management projects.
- Growing awareness of water pollution and its environmental impact.
- Dominant Segment - Application: Municipalities account for the largest segment share in the application segment due to the vast scale of their water treatment operations.
- Dominant Segment - Type: pH sensors are the most dominant type due to the critical role pH plays in water treatment processes.
Water and Wastewater Sensors Industry Product Innovations
Recent innovations center on enhancing sensor accuracy, reliability, and ease of maintenance. The development of self-cleaning sensors, calibration-free sensors, and multi-parameter sensors are key examples. These innovations address the challenges associated with fouling, calibration requirements, and the need for comprehensive water quality monitoring. The unique selling proposition of these new sensors lies in their ability to reduce operational costs, improve data accuracy, and simplify water quality management.
Propelling Factors for Water and Wastewater Sensors Industry Growth
Several factors contribute to the industry's growth:
- Technological Advancements: The development of IoT-enabled sensors, AI-powered analytics, and advanced materials for improved sensor performance is driving market expansion.
- Stringent Environmental Regulations: Governments worldwide are implementing stricter regulations for water quality, creating a strong demand for advanced monitoring solutions.
- Growing Urbanization and Industrialization: The increasing population and industrial activities place a greater strain on water resources, necessitating more efficient water management.
Obstacles in the Water and Wastewater Sensors Industry Market
The industry faces several challenges:
- High Initial Investment Costs: The cost of implementing advanced sensor technologies can be a barrier for some municipalities and industries.
- Supply Chain Disruptions: Global supply chain issues can impact the availability and pricing of sensor components.
- Competitive Pressures: The growing number of players in the market intensifies competition, affecting pricing and profit margins.
Future Opportunities in Water and Wastewater Sensors Industry
Future opportunities lie in:
- Smart Water Management Systems: Integrating sensors with data analytics and AI to optimize water management processes.
- Development of Miniaturized and Low-Cost Sensors: Increasing accessibility and affordability of water quality monitoring.
- Expansion into Emerging Markets: Untapped potential exists in developing countries with growing needs for water infrastructure.
Major Players in the Water and Wastewater Sensors Industry Ecosystem
- Honeywell International Inc
- ABB Ltd
- Gill Sensors and Controls
- Swan Analytical Instruments
- Emerson Electric Co
- Schneider Electric SE
- Omron Corporation
- Aganoxa
- Delta Phase Electronics Inc
- Yokogawa Electric Corporation
Key Developments in Water and Wastewater Sensors Industry Industry
- November 2022: HORIBA, Ltd. launched the world's first Gel-filled Self-Cleaning pH Electrode, improving accuracy and reducing maintenance in wastewater treatment.
- April 2022: ANB Sensors introduced calibration-free pH sensors, simplifying pH monitoring and lowering costs.
Strategic Water and Wastewater Sensors Industry Market Forecast
The water and wastewater sensors market is poised for significant growth, driven by technological advancements, stringent regulations, and increasing demand for efficient water management solutions. The market’s future potential is considerable, with opportunities across various segments and regions. The focus on sustainability and smart water management will be key drivers in shaping the market landscape in the coming years.
Water and Wastewater Sensors Industry Segmentation
-
1. Type
- 1.1. pH Sensors
- 1.2. DO Sensors
- 1.3. Temperature Sensors
- 1.4. Turbidity Sensors
- 1.5. Other Types (ORP, Conductivity, etc.)
-
2. Application
- 2.1. Municipalities
- 2.2. Industrial Wastewater Treatment
Water and Wastewater Sensors Industry Segmentation By Geography
- 1. North America
- 2. Europe
- 3. Asia
- 4. Australia and New Zealand
Water and Wastewater Sensors Industry REPORT HIGHLIGHTS
| Aspects | Details |
|---|---|
| Study Period | 2019-2033 |
| Base Year | 2024 |
| Estimated Year | 2025 |
| Forecast Period | 2025-2033 |
| Historical Period | 2019-2024 |
| Growth Rate | CAGR of 7.40% from 2019-2033 |
| Segmentation |
|
Table of Contents
- 1. Introduction
- 1.1. Research Scope
- 1.2. Market Segmentation
- 1.3. Research Methodology
- 1.4. Definitions and Assumptions
- 2. Executive Summary
- 2.1. Introduction
- 3. Market Dynamics
- 3.1. Introduction
- 3.2. Market Drivers
- 3.2.1. Incremental Technological Advancements aiding the Market Growth
- 3.3. Market Restrains
- 3.3.1 Growing Complexity of Wearable Devices and Limited Use of Features
- 3.3.2 augmented With Security Risks
- 3.4. Market Trends
- 3.4.1. pH Sensor Expected to Witness Increased Demand
- 4. Market Factor Analysis
- 4.1. Porters Five Forces
- 4.2. Supply/Value Chain
- 4.3. PESTEL analysis
- 4.4. Market Entropy
- 4.5. Patent/Trademark Analysis
- 5. Global Water and Wastewater Sensors Industry Analysis, Insights and Forecast, 2019-2031
- 5.1. Market Analysis, Insights and Forecast - by Type
- 5.1.1. pH Sensors
- 5.1.2. DO Sensors
- 5.1.3. Temperature Sensors
- 5.1.4. Turbidity Sensors
- 5.1.5. Other Types (ORP, Conductivity, etc.)
- 5.2. Market Analysis, Insights and Forecast - by Application
- 5.2.1. Municipalities
- 5.2.2. Industrial Wastewater Treatment
- 5.3. Market Analysis, Insights and Forecast - by Region
- 5.3.1. North America
- 5.3.2. Europe
- 5.3.3. Asia
- 5.3.4. Australia and New Zealand
- 5.1. Market Analysis, Insights and Forecast - by Type
- 6. North America Water and Wastewater Sensors Industry Analysis, Insights and Forecast, 2019-2031
- 6.1. Market Analysis, Insights and Forecast - by Type
- 6.1.1. pH Sensors
- 6.1.2. DO Sensors
- 6.1.3. Temperature Sensors
- 6.1.4. Turbidity Sensors
- 6.1.5. Other Types (ORP, Conductivity, etc.)
- 6.2. Market Analysis, Insights and Forecast - by Application
- 6.2.1. Municipalities
- 6.2.2. Industrial Wastewater Treatment
- 6.1. Market Analysis, Insights and Forecast - by Type
- 7. Europe Water and Wastewater Sensors Industry Analysis, Insights and Forecast, 2019-2031
- 7.1. Market Analysis, Insights and Forecast - by Type
- 7.1.1. pH Sensors
- 7.1.2. DO Sensors
- 7.1.3. Temperature Sensors
- 7.1.4. Turbidity Sensors
- 7.1.5. Other Types (ORP, Conductivity, etc.)
- 7.2. Market Analysis, Insights and Forecast - by Application
- 7.2.1. Municipalities
- 7.2.2. Industrial Wastewater Treatment
- 7.1. Market Analysis, Insights and Forecast - by Type
- 8. Asia Water and Wastewater Sensors Industry Analysis, Insights and Forecast, 2019-2031
- 8.1. Market Analysis, Insights and Forecast - by Type
- 8.1.1. pH Sensors
- 8.1.2. DO Sensors
- 8.1.3. Temperature Sensors
- 8.1.4. Turbidity Sensors
- 8.1.5. Other Types (ORP, Conductivity, etc.)
- 8.2. Market Analysis, Insights and Forecast - by Application
- 8.2.1. Municipalities
- 8.2.2. Industrial Wastewater Treatment
- 8.1. Market Analysis, Insights and Forecast - by Type
- 9. Australia and New Zealand Water and Wastewater Sensors Industry Analysis, Insights and Forecast, 2019-2031
- 9.1. Market Analysis, Insights and Forecast - by Type
- 9.1.1. pH Sensors
- 9.1.2. DO Sensors
- 9.1.3. Temperature Sensors
- 9.1.4. Turbidity Sensors
- 9.1.5. Other Types (ORP, Conductivity, etc.)
- 9.2. Market Analysis, Insights and Forecast - by Application
- 9.2.1. Municipalities
- 9.2.2. Industrial Wastewater Treatment
- 9.1. Market Analysis, Insights and Forecast - by Type
- 10. North America Water and Wastewater Sensors Industry Analysis, Insights and Forecast, 2019-2031
- 10.1. Market Analysis, Insights and Forecast - By Country/Sub-region
- 10.1.1. undefined
- 11. Europe Water and Wastewater Sensors Industry Analysis, Insights and Forecast, 2019-2031
- 11.1. Market Analysis, Insights and Forecast - By Country/Sub-region
- 11.1.1. undefined
- 12. Asia Pacific Water and Wastewater Sensors Industry Analysis, Insights and Forecast, 2019-2031
- 12.1. Market Analysis, Insights and Forecast - By Country/Sub-region
- 12.1.1. undefined
- 13. South America Water and Wastewater Sensors Industry Analysis, Insights and Forecast, 2019-2031
- 13.1. Market Analysis, Insights and Forecast - By Country/Sub-region
- 13.1.1. undefined
- 14. North America Water and Wastewater Sensors Industry Analysis, Insights and Forecast, 2019-2031
- 14.1. Market Analysis, Insights and Forecast - By Country/Sub-region
- 14.1.1. undefined
- 15. MEA Water and Wastewater Sensors Industry Analysis, Insights and Forecast, 2019-2031
- 15.1. Market Analysis, Insights and Forecast - By Country/Sub-region
- 15.1.1. undefined
- 16. Competitive Analysis
- 16.1. Global Market Share Analysis 2024
- 16.2. Company Profiles
- 16.2.1 Honeywell International Inc
- 16.2.1.1. Overview
- 16.2.1.2. Products
- 16.2.1.3. SWOT Analysis
- 16.2.1.4. Recent Developments
- 16.2.1.5. Financials (Based on Availability)
- 16.2.2 ABB Ltd
- 16.2.2.1. Overview
- 16.2.2.2. Products
- 16.2.2.3. SWOT Analysis
- 16.2.2.4. Recent Developments
- 16.2.2.5. Financials (Based on Availability)
- 16.2.3 Gill Sensors and Controls
- 16.2.3.1. Overview
- 16.2.3.2. Products
- 16.2.3.3. SWOT Analysis
- 16.2.3.4. Recent Developments
- 16.2.3.5. Financials (Based on Availability)
- 16.2.4 Swan Analytical Instruments
- 16.2.4.1. Overview
- 16.2.4.2. Products
- 16.2.4.3. SWOT Analysis
- 16.2.4.4. Recent Developments
- 16.2.4.5. Financials (Based on Availability)
- 16.2.5 Emerson Electric Co
- 16.2.5.1. Overview
- 16.2.5.2. Products
- 16.2.5.3. SWOT Analysis
- 16.2.5.4. Recent Developments
- 16.2.5.5. Financials (Based on Availability)
- 16.2.6 Schneider Electric SE
- 16.2.6.1. Overview
- 16.2.6.2. Products
- 16.2.6.3. SWOT Analysis
- 16.2.6.4. Recent Developments
- 16.2.6.5. Financials (Based on Availability)
- 16.2.7 Omron Corporation
- 16.2.7.1. Overview
- 16.2.7.2. Products
- 16.2.7.3. SWOT Analysis
- 16.2.7.4. Recent Developments
- 16.2.7.5. Financials (Based on Availability)
- 16.2.8 Aganoxa
- 16.2.8.1. Overview
- 16.2.8.2. Products
- 16.2.8.3. SWOT Analysis
- 16.2.8.4. Recent Developments
- 16.2.8.5. Financials (Based on Availability)
- 16.2.9 Delta Phase Electronics Inc
- 16.2.9.1. Overview
- 16.2.9.2. Products
- 16.2.9.3. SWOT Analysis
- 16.2.9.4. Recent Developments
- 16.2.9.5. Financials (Based on Availability)
- 16.2.10 Yokogawa Electric Corporation
- 16.2.10.1. Overview
- 16.2.10.2. Products
- 16.2.10.3. SWOT Analysis
- 16.2.10.4. Recent Developments
- 16.2.10.5. Financials (Based on Availability)
- 16.2.1 Honeywell International Inc
List of Figures
- Figure 1: Global Water and Wastewater Sensors Industry Revenue Breakdown (Million, %) by Region 2024 & 2032
- Figure 2: Global Water and Wastewater Sensors Industry Volume Breakdown (K Unit, %) by Region 2024 & 2032
- Figure 3: North America Water and Wastewater Sensors Industry Revenue (Million), by Country 2024 & 2032
- Figure 4: North America Water and Wastewater Sensors Industry Volume (K Unit), by Country 2024 & 2032
- Figure 5: North America Water and Wastewater Sensors Industry Revenue Share (%), by Country 2024 & 2032
- Figure 6: North America Water and Wastewater Sensors Industry Volume Share (%), by Country 2024 & 2032
- Figure 7: Europe Water and Wastewater Sensors Industry Revenue (Million), by Country 2024 & 2032
- Figure 8: Europe Water and Wastewater Sensors Industry Volume (K Unit), by Country 2024 & 2032
- Figure 9: Europe Water and Wastewater Sensors Industry Revenue Share (%), by Country 2024 & 2032
- Figure 10: Europe Water and Wastewater Sensors Industry Volume Share (%), by Country 2024 & 2032
- Figure 11: Asia Pacific Water and Wastewater Sensors Industry Revenue (Million), by Country 2024 & 2032
- Figure 12: Asia Pacific Water and Wastewater Sensors Industry Volume (K Unit), by Country 2024 & 2032
- Figure 13: Asia Pacific Water and Wastewater Sensors Industry Revenue Share (%), by Country 2024 & 2032
- Figure 14: Asia Pacific Water and Wastewater Sensors Industry Volume Share (%), by Country 2024 & 2032
- Figure 15: South America Water and Wastewater Sensors Industry Revenue (Million), by Country 2024 & 2032
- Figure 16: South America Water and Wastewater Sensors Industry Volume (K Unit), by Country 2024 & 2032
- Figure 17: South America Water and Wastewater Sensors Industry Revenue Share (%), by Country 2024 & 2032
- Figure 18: South America Water and Wastewater Sensors Industry Volume Share (%), by Country 2024 & 2032
- Figure 19: North America Water and Wastewater Sensors Industry Revenue (Million), by Country 2024 & 2032
- Figure 20: North America Water and Wastewater Sensors Industry Volume (K Unit), by Country 2024 & 2032
- Figure 21: North America Water and Wastewater Sensors Industry Revenue Share (%), by Country 2024 & 2032
- Figure 22: North America Water and Wastewater Sensors Industry Volume Share (%), by Country 2024 & 2032
- Figure 23: MEA Water and Wastewater Sensors Industry Revenue (Million), by Country 2024 & 2032
- Figure 24: MEA Water and Wastewater Sensors Industry Volume (K Unit), by Country 2024 & 2032
- Figure 25: MEA Water and Wastewater Sensors Industry Revenue Share (%), by Country 2024 & 2032
- Figure 26: MEA Water and Wastewater Sensors Industry Volume Share (%), by Country 2024 & 2032
- Figure 27: North America Water and Wastewater Sensors Industry Revenue (Million), by Type 2024 & 2032
- Figure 28: North America Water and Wastewater Sensors Industry Volume (K Unit), by Type 2024 & 2032
- Figure 29: North America Water and Wastewater Sensors Industry Revenue Share (%), by Type 2024 & 2032
- Figure 30: North America Water and Wastewater Sensors Industry Volume Share (%), by Type 2024 & 2032
- Figure 31: North America Water and Wastewater Sensors Industry Revenue (Million), by Application 2024 & 2032
- Figure 32: North America Water and Wastewater Sensors Industry Volume (K Unit), by Application 2024 & 2032
- Figure 33: North America Water and Wastewater Sensors Industry Revenue Share (%), by Application 2024 & 2032
- Figure 34: North America Water and Wastewater Sensors Industry Volume Share (%), by Application 2024 & 2032
- Figure 35: North America Water and Wastewater Sensors Industry Revenue (Million), by Country 2024 & 2032
- Figure 36: North America Water and Wastewater Sensors Industry Volume (K Unit), by Country 2024 & 2032
- Figure 37: North America Water and Wastewater Sensors Industry Revenue Share (%), by Country 2024 & 2032
- Figure 38: North America Water and Wastewater Sensors Industry Volume Share (%), by Country 2024 & 2032
- Figure 39: Europe Water and Wastewater Sensors Industry Revenue (Million), by Type 2024 & 2032
- Figure 40: Europe Water and Wastewater Sensors Industry Volume (K Unit), by Type 2024 & 2032
- Figure 41: Europe Water and Wastewater Sensors Industry Revenue Share (%), by Type 2024 & 2032
- Figure 42: Europe Water and Wastewater Sensors Industry Volume Share (%), by Type 2024 & 2032
- Figure 43: Europe Water and Wastewater Sensors Industry Revenue (Million), by Application 2024 & 2032
- Figure 44: Europe Water and Wastewater Sensors Industry Volume (K Unit), by Application 2024 & 2032
- Figure 45: Europe Water and Wastewater Sensors Industry Revenue Share (%), by Application 2024 & 2032
- Figure 46: Europe Water and Wastewater Sensors Industry Volume Share (%), by Application 2024 & 2032
- Figure 47: Europe Water and Wastewater Sensors Industry Revenue (Million), by Country 2024 & 2032
- Figure 48: Europe Water and Wastewater Sensors Industry Volume (K Unit), by Country 2024 & 2032
- Figure 49: Europe Water and Wastewater Sensors Industry Revenue Share (%), by Country 2024 & 2032
- Figure 50: Europe Water and Wastewater Sensors Industry Volume Share (%), by Country 2024 & 2032
- Figure 51: Asia Water and Wastewater Sensors Industry Revenue (Million), by Type 2024 & 2032
- Figure 52: Asia Water and Wastewater Sensors Industry Volume (K Unit), by Type 2024 & 2032
- Figure 53: Asia Water and Wastewater Sensors Industry Revenue Share (%), by Type 2024 & 2032
- Figure 54: Asia Water and Wastewater Sensors Industry Volume Share (%), by Type 2024 & 2032
- Figure 55: Asia Water and Wastewater Sensors Industry Revenue (Million), by Application 2024 & 2032
- Figure 56: Asia Water and Wastewater Sensors Industry Volume (K Unit), by Application 2024 & 2032
- Figure 57: Asia Water and Wastewater Sensors Industry Revenue Share (%), by Application 2024 & 2032
- Figure 58: Asia Water and Wastewater Sensors Industry Volume Share (%), by Application 2024 & 2032
- Figure 59: Asia Water and Wastewater Sensors Industry Revenue (Million), by Country 2024 & 2032
- Figure 60: Asia Water and Wastewater Sensors Industry Volume (K Unit), by Country 2024 & 2032
- Figure 61: Asia Water and Wastewater Sensors Industry Revenue Share (%), by Country 2024 & 2032
- Figure 62: Asia Water and Wastewater Sensors Industry Volume Share (%), by Country 2024 & 2032
- Figure 63: Australia and New Zealand Water and Wastewater Sensors Industry Revenue (Million), by Type 2024 & 2032
- Figure 64: Australia and New Zealand Water and Wastewater Sensors Industry Volume (K Unit), by Type 2024 & 2032
- Figure 65: Australia and New Zealand Water and Wastewater Sensors Industry Revenue Share (%), by Type 2024 & 2032
- Figure 66: Australia and New Zealand Water and Wastewater Sensors Industry Volume Share (%), by Type 2024 & 2032
- Figure 67: Australia and New Zealand Water and Wastewater Sensors Industry Revenue (Million), by Application 2024 & 2032
- Figure 68: Australia and New Zealand Water and Wastewater Sensors Industry Volume (K Unit), by Application 2024 & 2032
- Figure 69: Australia and New Zealand Water and Wastewater Sensors Industry Revenue Share (%), by Application 2024 & 2032
- Figure 70: Australia and New Zealand Water and Wastewater Sensors Industry Volume Share (%), by Application 2024 & 2032
- Figure 71: Australia and New Zealand Water and Wastewater Sensors Industry Revenue (Million), by Country 2024 & 2032
- Figure 72: Australia and New Zealand Water and Wastewater Sensors Industry Volume (K Unit), by Country 2024 & 2032
- Figure 73: Australia and New Zealand Water and Wastewater Sensors Industry Revenue Share (%), by Country 2024 & 2032
- Figure 74: Australia and New Zealand Water and Wastewater Sensors Industry Volume Share (%), by Country 2024 & 2032
List of Tables
- Table 1: Global Water and Wastewater Sensors Industry Revenue Million Forecast, by Region 2019 & 2032
- Table 2: Global Water and Wastewater Sensors Industry Volume K Unit Forecast, by Region 2019 & 2032
- Table 3: Global Water and Wastewater Sensors Industry Revenue Million Forecast, by Type 2019 & 2032
- Table 4: Global Water and Wastewater Sensors Industry Volume K Unit Forecast, by Type 2019 & 2032
- Table 5: Global Water and Wastewater Sensors Industry Revenue Million Forecast, by Application 2019 & 2032
- Table 6: Global Water and Wastewater Sensors Industry Volume K Unit Forecast, by Application 2019 & 2032
- Table 7: Global Water and Wastewater Sensors Industry Revenue Million Forecast, by Region 2019 & 2032
- Table 8: Global Water and Wastewater Sensors Industry Volume K Unit Forecast, by Region 2019 & 2032
- Table 9: Global Water and Wastewater Sensors Industry Revenue Million Forecast, by Country 2019 & 2032
- Table 10: Global Water and Wastewater Sensors Industry Volume K Unit Forecast, by Country 2019 & 2032
- Table 11: Global Water and Wastewater Sensors Industry Revenue Million Forecast, by Country 2019 & 2032
- Table 12: Global Water and Wastewater Sensors Industry Volume K Unit Forecast, by Country 2019 & 2032
- Table 13: Global Water and Wastewater Sensors Industry Revenue Million Forecast, by Country 2019 & 2032
- Table 14: Global Water and Wastewater Sensors Industry Volume K Unit Forecast, by Country 2019 & 2032
- Table 15: Global Water and Wastewater Sensors Industry Revenue Million Forecast, by Country 2019 & 2032
- Table 16: Global Water and Wastewater Sensors Industry Volume K Unit Forecast, by Country 2019 & 2032
- Table 17: Global Water and Wastewater Sensors Industry Revenue Million Forecast, by Country 2019 & 2032
- Table 18: Global Water and Wastewater Sensors Industry Volume K Unit Forecast, by Country 2019 & 2032
- Table 19: Global Water and Wastewater Sensors Industry Revenue Million Forecast, by Country 2019 & 2032
- Table 20: Global Water and Wastewater Sensors Industry Volume K Unit Forecast, by Country 2019 & 2032
- Table 21: Global Water and Wastewater Sensors Industry Revenue Million Forecast, by Type 2019 & 2032
- Table 22: Global Water and Wastewater Sensors Industry Volume K Unit Forecast, by Type 2019 & 2032
- Table 23: Global Water and Wastewater Sensors Industry Revenue Million Forecast, by Application 2019 & 2032
- Table 24: Global Water and Wastewater Sensors Industry Volume K Unit Forecast, by Application 2019 & 2032
- Table 25: Global Water and Wastewater Sensors Industry Revenue Million Forecast, by Country 2019 & 2032
- Table 26: Global Water and Wastewater Sensors Industry Volume K Unit Forecast, by Country 2019 & 2032
- Table 27: Global Water and Wastewater Sensors Industry Revenue Million Forecast, by Type 2019 & 2032
- Table 28: Global Water and Wastewater Sensors Industry Volume K Unit Forecast, by Type 2019 & 2032
- Table 29: Global Water and Wastewater Sensors Industry Revenue Million Forecast, by Application 2019 & 2032
- Table 30: Global Water and Wastewater Sensors Industry Volume K Unit Forecast, by Application 2019 & 2032
- Table 31: Global Water and Wastewater Sensors Industry Revenue Million Forecast, by Country 2019 & 2032
- Table 32: Global Water and Wastewater Sensors Industry Volume K Unit Forecast, by Country 2019 & 2032
- Table 33: Global Water and Wastewater Sensors Industry Revenue Million Forecast, by Type 2019 & 2032
- Table 34: Global Water and Wastewater Sensors Industry Volume K Unit Forecast, by Type 2019 & 2032
- Table 35: Global Water and Wastewater Sensors Industry Revenue Million Forecast, by Application 2019 & 2032
- Table 36: Global Water and Wastewater Sensors Industry Volume K Unit Forecast, by Application 2019 & 2032
- Table 37: Global Water and Wastewater Sensors Industry Revenue Million Forecast, by Country 2019 & 2032
- Table 38: Global Water and Wastewater Sensors Industry Volume K Unit Forecast, by Country 2019 & 2032
- Table 39: Global Water and Wastewater Sensors Industry Revenue Million Forecast, by Type 2019 & 2032
- Table 40: Global Water and Wastewater Sensors Industry Volume K Unit Forecast, by Type 2019 & 2032
- Table 41: Global Water and Wastewater Sensors Industry Revenue Million Forecast, by Application 2019 & 2032
- Table 42: Global Water and Wastewater Sensors Industry Volume K Unit Forecast, by Application 2019 & 2032
- Table 43: Global Water and Wastewater Sensors Industry Revenue Million Forecast, by Country 2019 & 2032
- Table 44: Global Water and Wastewater Sensors Industry Volume K Unit Forecast, by Country 2019 & 2032
Frequently Asked Questions
1. What is the projected Compound Annual Growth Rate (CAGR) of the Water and Wastewater Sensors Industry?
The projected CAGR is approximately 7.40%.
2. Which companies are prominent players in the Water and Wastewater Sensors Industry?
Key companies in the market include Honeywell International Inc, ABB Ltd, Gill Sensors and Controls, Swan Analytical Instruments, Emerson Electric Co, Schneider Electric SE, Omron Corporation, Aganoxa, Delta Phase Electronics Inc, Yokogawa Electric Corporation.
3. What are the main segments of the Water and Wastewater Sensors Industry?
The market segments include Type, Application.
4. Can you provide details about the market size?
The market size is estimated to be USD 65.78 Million as of 2022.
5. What are some drivers contributing to market growth?
Incremental Technological Advancements aiding the Market Growth.
6. What are the notable trends driving market growth?
pH Sensor Expected to Witness Increased Demand.
7. Are there any restraints impacting market growth?
Growing Complexity of Wearable Devices and Limited Use of Features. augmented With Security Risks.
8. Can you provide examples of recent developments in the market?
November 2022: HORIBA, Ltd., a member of the HORIBA Group, announced the release of the world's first Gel-filled Self-Cleaning pH Electrode incorporating innovative antifoul technology. This pioneering technology addresses the critical need for pH testing and condition management in sewage and wastewater treatment plants, where it plays a vital role in the activation of sludge for water-cleaning processes. The Gel-filled Self-Cleaning pH Electrode features state-of-the-art photocatalyst technology developed in collaboration with Mie University. It integrates an ultraviolet light-emitting diode (UV-LED) within the electrode itself.
9. What pricing options are available for accessing the report?
Pricing options include single-user, multi-user, and enterprise licenses priced at USD 4750, USD 5250, and USD 8750 respectively.
10. Is the market size provided in terms of value or volume?
The market size is provided in terms of value, measured in Million and volume, measured in K Unit.
11. Are there any specific market keywords associated with the report?
Yes, the market keyword associated with the report is "Water and Wastewater Sensors Industry," which aids in identifying and referencing the specific market segment covered.
12. How do I determine which pricing option suits my needs best?
The pricing options vary based on user requirements and access needs. Individual users may opt for single-user licenses, while businesses requiring broader access may choose multi-user or enterprise licenses for cost-effective access to the report.
13. Are there any additional resources or data provided in the Water and Wastewater Sensors Industry report?
While the report offers comprehensive insights, it's advisable to review the specific contents or supplementary materials provided to ascertain if additional resources or data are available.
14. How can I stay updated on further developments or reports in the Water and Wastewater Sensors Industry?
To stay informed about further developments, trends, and reports in the Water and Wastewater Sensors Industry, consider subscribing to industry newsletters, following relevant companies and organizations, or regularly checking reputable industry news sources and publications.
Methodology
Step 1 - Identification of Relevant Samples Size from Population Database


Step 2 - Approaches for Defining Global Market Size (Value, Volume* & Price*)

Note*: In applicable scenarios
Step 3 - Data Sources
Primary Research
- Web Analytics
- Survey Reports
- Research Institute
- Latest Research Reports
- Opinion Leaders
Secondary Research
- Annual Reports
- White Paper
- Latest Press Release
- Industry Association
- Paid Database
- Investor Presentations

Step 4 - Data Triangulation
Involves using different sources of information in order to increase the validity of a study
These sources are likely to be stakeholders in a program - participants, other researchers, program staff, other community members, and so on.
Then we put all data in single framework & apply various statistical tools to find out the dynamic on the market.
During the analysis stage, feedback from the stakeholder groups would be compared to determine areas of agreement as well as areas of divergence
